Deprecated (16384): The ArrayAccess methods will be removed in 4.0.0.Use getParam(), getData() and getQuery() instead. - /home/brlfuser/public_html/src/Controller/ArtileDetailController.php, line: 73
You can disable deprecation warnings by setting `Error.errorLevel` to `E_ALL & ~E_USER_DEPRECATED` in your config/app.php. [CORE/src/Core/functions.php, line 311]
deprecationWarning - CORE/src/Core/functions.php, line 311
Cake\Http\ServerRequest::offsetGet() - CORE/src/Http/ServerRequest.php, line 2421
App\Controller\ArtileDetailController::printArticle() - APP/Controller/ArtileDetailController.php, line 73
Cake\Controller\Controller::invokeAction() - CORE/src/Controller/Controller.php, line 610
Cake\Http\ActionDispatcher::_invoke() - CORE/src/Http/ActionDispatcher.php, line 120
Cake\Http\ActionDispatcher::dispatch() - CORE/src/Http/ActionDispatcher.php, line 94
Cake\Http\BaseApplication::__invoke() - CORE/src/Http/BaseApplication.php, line 235
Cake\Http\Runner::__invoke() - CORE/src/Http/Runner.php, line 65
Cake\Routing\Middleware\RoutingMiddleware::__invoke() - CORE/src/Routing/Middleware/RoutingMiddleware.php, line 162
Cake\Http\Runner::__invoke() - CORE/src/Http/Runner.php, line 65
Cake\Routing\Middleware\AssetMiddleware::__invoke() - CORE/src/Routing/Middleware/AssetMiddleware.php, line 88
Cake\Http\Runner::__invoke() - CORE/src/Http/Runner.php, line 65
Cake\Error\Middleware\ErrorHandlerMiddleware::__invoke() - CORE/src/Error/Middleware/ErrorHandlerMiddleware.php, line 96
Cake\Http\Runner::__invoke() - CORE/src/Http/Runner.php, line 65
Cake\Http\Runner::run() - CORE/src/Http/Runner.php, line 51
Cake\Http\Server::run() - CORE/src/Http/Server.php, line 98
Deprecated (16384): The ArrayAccess methods will be removed in 4.0.0.Use getParam(), getData() and getQuery() instead. - /home/brlfuser/public_html/src/Controller/ArtileDetailController.php, line: 74
You can disable deprecation warnings by setting `Error.errorLevel` to `E_ALL & ~E_USER_DEPRECATED` in your config/app.php. [CORE/src/Core/functions.php, line 311]
deprecationWarning - CORE/src/Core/functions.php, line 311
Cake\Http\ServerRequest::offsetGet() - CORE/src/Http/ServerRequest.php, line 2421
App\Controller\ArtileDetailController::printArticle() - APP/Controller/ArtileDetailController.php, line 74
Cake\Controller\Controller::invokeAction() - CORE/src/Controller/Controller.php, line 610
Cake\Http\ActionDispatcher::_invoke() - CORE/src/Http/ActionDispatcher.php, line 120
Cake\Http\ActionDispatcher::dispatch() - CORE/src/Http/ActionDispatcher.php, line 94
Cake\Http\BaseApplication::__invoke() - CORE/src/Http/BaseApplication.php, line 235
Cake\Http\Runner::__invoke() - CORE/src/Http/Runner.php, line 65
Cake\Routing\Middleware\RoutingMiddleware::__invoke() - CORE/src/Routing/Middleware/RoutingMiddleware.php, line 162
Cake\Http\Runner::__invoke() - CORE/src/Http/Runner.php, line 65
Cake\Routing\Middleware\AssetMiddleware::__invoke() - CORE/src/Routing/Middleware/AssetMiddleware.php, line 88
Cake\Http\Runner::__invoke() - CORE/src/Http/Runner.php, line 65
Cake\Error\Middleware\ErrorHandlerMiddleware::__invoke() - CORE/src/Error/Middleware/ErrorHandlerMiddleware.php, line 96
Cake\Http\Runner::__invoke() - CORE/src/Http/Runner.php, line 65
Cake\Http\Runner::run() - CORE/src/Http/Runner.php, line 51
Cake\Http\Server::run() - CORE/src/Http/Server.php, line 98
Warning (512): Unable to emit headers. Headers sent in file=/home/brlfuser/public_html/vendor/cakephp/cakephp/src/Error/Debugger.php line=853 [CORE/src/Http/ResponseEmitter.php, line 48]
if (Configure::read('debug')) {
trigger_error($message, E_USER_WARNING);
} else {
$response = object(Cake\Http\Response) {
'status' => (int) 200,
'contentType' => 'text/html',
'headers' => [
'Content-Type' => [
[maximum depth reached]
]
],
'file' => null,
'fileRange' => [],
'cookies' => object(Cake\Http\Cookie\CookieCollection) {},
'cacheDirectives' => [],
'body' => '<!DOCTYPE html PUBLIC "-//W3C//DTD XHTML 1.0 Transitional//EN"
"http://www.w3.org/TR/xhtml1/DTD/xhtml1-transitional.dtd">
<html xmlns="http://www.w3.org/1999/xhtml">
<head>
<link rel="canonical" href="https://im4change.in/<pre class="cake-error"><a href="javascript:void(0);" onclick="document.getElementById('cakeErr67feb98dae9a9-trace').style.display = (document.getElementById('cakeErr67feb98dae9a9-trace').style.display == 'none' ? '' : 'none');"><b>Notice</b> (8)</a>: Undefined variable: urlPrefix [<b>APP/Template/Layout/printlayout.ctp</b>, line <b>8</b>]<div id="cakeErr67feb98dae9a9-trace" class="cake-stack-trace" style="display: none;"><a href="javascript:void(0);" onclick="document.getElementById('cakeErr67feb98dae9a9-code').style.display = (document.getElementById('cakeErr67feb98dae9a9-code').style.display == 'none' ? '' : 'none')">Code</a> <a href="javascript:void(0);" onclick="document.getElementById('cakeErr67feb98dae9a9-context').style.display = (document.getElementById('cakeErr67feb98dae9a9-context').style.display == 'none' ? '' : 'none')">Context</a><pre id="cakeErr67feb98dae9a9-code" class="cake-code-dump" style="display: none;"><code><span style="color: #000000"><span style="color: #0000BB"></span><span style="color: #007700"><</span><span style="color: #0000BB">head</span><span style="color: #007700">>
</span></span></code>
<span class="code-highlight"><code><span style="color: #000000"> <link rel="canonical" href="<span style="color: #0000BB"><?php </span><span style="color: #007700">echo </span><span style="color: #0000BB">Configure</span><span style="color: #007700">::</span><span style="color: #0000BB">read</span><span style="color: #007700">(</span><span style="color: #DD0000">'SITE_URL'</span><span style="color: #007700">); </span><span style="color: #0000BB">?><?php </span><span style="color: #007700">echo </span><span style="color: #0000BB">$urlPrefix</span><span style="color: #007700">;</span><span style="color: #0000BB">?><?php </span><span style="color: #007700">echo </span><span style="color: #0000BB">$article_current</span><span style="color: #007700">-></span><span style="color: #0000BB">category</span><span style="color: #007700">-></span><span style="color: #0000BB">slug</span><span style="color: #007700">; </span><span style="color: #0000BB">?></span>/<span style="color: #0000BB"><?php </span><span style="color: #007700">echo </span><span style="color: #0000BB">$article_current</span><span style="color: #007700">-></span><span style="color: #0000BB">seo_url</span><span style="color: #007700">; </span><span style="color: #0000BB">?></span>.html"/>
</span></code></span>
<code><span style="color: #000000"><span style="color: #0000BB"> </span><span style="color: #007700"><</span><span style="color: #0000BB">meta http</span><span style="color: #007700">-</span><span style="color: #0000BB">equiv</span><span style="color: #007700">=</span><span style="color: #DD0000">"Content-Type" </span><span style="color: #0000BB">content</span><span style="color: #007700">=</span><span style="color: #DD0000">"text/html; charset=utf-8"</span><span style="color: #007700">/>
</span></span></code></pre><pre id="cakeErr67feb98dae9a9-context" class="cake-context" style="display: none;">$viewFile = '/home/brlfuser/public_html/src/Template/Layout/printlayout.ctp'
$dataForView = [
'article_current' => object(App\Model\Entity\Article) {
'id' => (int) 21075,
'title' => 'A report card for India’s states -Pranjul Bhandari',
'subheading' => '',
'description' => '<div align="justify">
-Live Mint
</div>
<p align="justify">
<img src="tinymce/uploaded/Growth_1.bmp" alt="Growth" /><br />
<em>Cherry-picked indicators of progress cannot convey the complexities of development in India's diverse states </em>
</p>
<p align="justify">
Which Indian states have fared better than their peers and which ones have done relatively worse is a perennial question for discussion. There is more at stake than mere grading of states here. Investment flows, central government funds and praises for being a good state are all linked to this seemingly straightforward question.
</p>
<p align="justify">
It seems to have become fashionable for chief ministers to competitively boast about their performance. Most have a few favourite indicators that they brandish for this purpose. While some highlight the improvement in an indicator over the five odd years of their tenure as proof of good governance, others take a further step and stress how these indicators are better than another state's or even the national average.
</p>
<p align="justify">
A few stray indicators and anecdotes, however, cannot form a fair report card. That requires a more comprehensive assessment. It is not very telling for a much prosperous state (for example, Gujarat) to be compared with a less prosperous state (say, Bihar), which may have been disadvantaged for a variety of historical reasons. If states have to be compared in a constructive way, the yardstick for comparison needs to be levelled first.
</p>
<p align="justify">
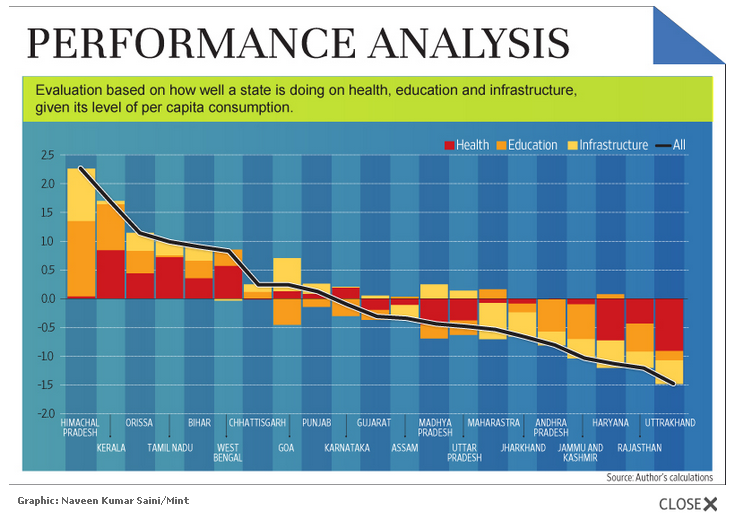
How do we establish a fair and comprehensive basis for comparing the performance of states? How do we judge the authenticity of lofty claims? Here's a different way of looking at it: focus on health, education and infrastructure, which are the biggest development tasks at hand. Rather than depending on a single indicator, several indicators can be bunched together, forming an index for each of the three. For health, both input (for example, immunization) and output (infant mortality rate) variables are used. For education, indicators that reflect both quantity (net enrolment rate), as well as quality (reading level for enrolled children), are used. For infrastructure, indicators across electricity, communication, banking and transportation are bunched up. To keep the comparison impartial, the principal component, a tool for combining the indicators, is employed. The data is ordered such that a higher index value means a better performing state.
</p>
<p align="justify">
What do the results show? We find that across health, education and infrastructure, Kerala, Goa and Himachal Pradesh are among the best performers and the so-called BIMARU states-Bihar, Madhya Pradesh (MP), Rajasthan and Uttar Pradesh (UP)-are laggards. This is hardly surprising. After all, the wonders of Kerala are well documented by Amartya Sen and several others and the demographer Ashish Bose coined the term BIMARU way back in the 1980s to highlight their lower levels of development.
</p>
<p align="justify">
How does one get to a more telling and appropriate comparison of states that controls for their inherent differences? How do we put the states on a level playing field? This can be done by controlling for consumption per person. We evaluate how well a state is doing on health, education and infrastructure, given its level of per capita consumption. This allows us to ask more sophisticated questions: is Gujarat doing as good a job with the resources it has at its disposal in contrast to, say, Bihar or Maharashtra? Although per capita gross domestic product (GDP) and consumption broadly measure the same thing and are tightly correlated, consumption has the benefit of reflecting actual purchasing power by including income generated from outside the state (inter-state remittances) and excluding income which gets diverted away from a state (especially for mining states).
</p>
<p align="justify">
This levelling exercise yields some interesting insights, (summarized in the accompanying chart that ranks states on performance from left to right, with the height of the bar indicating how much better a state is from the all-India benchmark). There is a clear differentiation among the BIMARU states. The rankings of Orissa, Bihar and Chhattisgarh rise sharply across all the three sectors. Orissa and Bihar, in particular, seem to be doing well by all India standards given their low level of income. MP and UP are below average, especially in health. Jharkhand and Rajasthan seem to be doing pretty poorly on all three fronts.
</p>
<p align="justify">
Coastal Kerala and West Bengal are good performers in health and education, though Kerala is, of course, in a higher league. Notably, both the states with their common history of Left rule are performing just about average on infrastructure. Among the hill states, there is a clear divide between the high-ranging Himachal Pradesh as the best in India and a flailing Uttarakhand far behind.
</p>
<p align="justify">
While Punjab fares decently on infrastructure, it slips from being a top-tier state in health and education to a medium-ranging one. This is surprising, given the common perception of healthy Punjabis being uncompromising with their food habits. In contrast, the more subdued Tamils seem to be a healthier lot.
</p>
<p align="justify">
While the much discussed Gujarat comes out as slightly better than the all-India average on infrastructure, it does not fare too well on education and does poorly on health. Finally, while Maharashtra does well on education, it is quite average on health and quite poor on infrastructure for the wealth it enjoys.
</p>
<p align="justify">
We also find a significantly positive relationship between consumption and our three constructed indices, suggesting that in the long run, better development outcomes are indeed associated with high consumption and GDP. However, all of these observations are limited to simple associations rather than causal relationships, which can be more complex to establish.
</p>
<p align="justify">
<em>Pranjul Bhandari is an economist headed to the John F. Kennedy School of Government at Harvard University as a Mason Fellow.</em>
</p>',
'credit_writer' => 'Live Mint, 20 May, 2013, http://www.livemint.com/Opinion/VCyAxbnkhyA47bXE9Z9wfM/A-report-card-for-Indias-states.html',
'article_img' => '',
'article_img_thumb' => '',
'status' => (int) 1,
'show_on_home' => (int) 1,
'lang' => 'EN',
'category_id' => (int) 16,
'tag_keyword' => '',
'seo_url' => 'a-report-card-for-indias-states-pranjul-bhandari-21220',
'meta_title' => null,
'meta_keywords' => null,
'meta_description' => null,
'noindex' => (int) 0,
'publish_date' => object(Cake\I18n\FrozenDate) {},
'most_visit_section_id' => null,
'article_big_img' => null,
'liveid' => (int) 21220,
'created' => object(Cake\I18n\FrozenTime) {},
'modified' => object(Cake\I18n\FrozenTime) {},
'edate' => '',
'tags' => [
[maximum depth reached]
],
'category' => object(App\Model\Entity\Category) {},
'[new]' => false,
'[accessible]' => [
[maximum depth reached]
],
'[dirty]' => [[maximum depth reached]],
'[original]' => [[maximum depth reached]],
'[virtual]' => [[maximum depth reached]],
'[hasErrors]' => false,
'[errors]' => [[maximum depth reached]],
'[invalid]' => [[maximum depth reached]],
'[repository]' => 'Articles'
},
'articleid' => (int) 21075,
'metaTitle' => 'LATEST NEWS UPDATES | A report card for India’s states -Pranjul Bhandari',
'metaKeywords' => 'Human Development,Health,education,economy,Growth',
'metaDesc' => '
-Live Mint
Cherry-picked indicators of progress cannot convey the complexities of development in India's diverse states
Which Indian states have fared better than their peers and which ones have done relatively worse is a perennial question for discussion. There is more...',
'disp' => '<div align="justify">-Live Mint</div><p align="justify"><img src="https://im4change.in/siteadmin/tinymce/uploaded/Growth_1.bmp" alt="Growth" /><br /><em>Cherry-picked indicators of progress cannot convey the complexities of development in India's diverse states </em></p><p align="justify">Which Indian states have fared better than their peers and which ones have done relatively worse is a perennial question for discussion. There is more at stake than mere grading of states here. Investment flows, central government funds and praises for being a good state are all linked to this seemingly straightforward question.</p><p align="justify">It seems to have become fashionable for chief ministers to competitively boast about their performance. Most have a few favourite indicators that they brandish for this purpose. While some highlight the improvement in an indicator over the five odd years of their tenure as proof of good governance, others take a further step and stress how these indicators are better than another state's or even the national average.</p><p align="justify">A few stray indicators and anecdotes, however, cannot form a fair report card. That requires a more comprehensive assessment. It is not very telling for a much prosperous state (for example, Gujarat) to be compared with a less prosperous state (say, Bihar), which may have been disadvantaged for a variety of historical reasons. If states have to be compared in a constructive way, the yardstick for comparison needs to be levelled first. </p><p align="justify">How do we establish a fair and comprehensive basis for comparing the performance of states? How do we judge the authenticity of lofty claims? Here's a different way of looking at it: focus on health, education and infrastructure, which are the biggest development tasks at hand. Rather than depending on a single indicator, several indicators can be bunched together, forming an index for each of the three. For health, both input (for example, immunization) and output (infant mortality rate) variables are used. For education, indicators that reflect both quantity (net enrolment rate), as well as quality (reading level for enrolled children), are used. For infrastructure, indicators across electricity, communication, banking and transportation are bunched up. To keep the comparison impartial, the principal component, a tool for combining the indicators, is employed. The data is ordered such that a higher index value means a better performing state.</p><p align="justify">What do the results show? We find that across health, education and infrastructure, Kerala, Goa and Himachal Pradesh are among the best performers and the so-called BIMARU states-Bihar, Madhya Pradesh (MP), Rajasthan and Uttar Pradesh (UP)-are laggards. This is hardly surprising. After all, the wonders of Kerala are well documented by Amartya Sen and several others and the demographer Ashish Bose coined the term BIMARU way back in the 1980s to highlight their lower levels of development.</p><p align="justify">How does one get to a more telling and appropriate comparison of states that controls for their inherent differences? How do we put the states on a level playing field? This can be done by controlling for consumption per person. We evaluate how well a state is doing on health, education and infrastructure, given its level of per capita consumption. This allows us to ask more sophisticated questions: is Gujarat doing as good a job with the resources it has at its disposal in contrast to, say, Bihar or Maharashtra? Although per capita gross domestic product (GDP) and consumption broadly measure the same thing and are tightly correlated, consumption has the benefit of reflecting actual purchasing power by including income generated from outside the state (inter-state remittances) and excluding income which gets diverted away from a state (especially for mining states).</p><p align="justify">This levelling exercise yields some interesting insights, (summarized in the accompanying chart that ranks states on performance from left to right, with the height of the bar indicating how much better a state is from the all-India benchmark). There is a clear differentiation among the BIMARU states. The rankings of Orissa, Bihar and Chhattisgarh rise sharply across all the three sectors. Orissa and Bihar, in particular, seem to be doing well by all India standards given their low level of income. MP and UP are below average, especially in health. Jharkhand and Rajasthan seem to be doing pretty poorly on all three fronts.</p><p align="justify">Coastal Kerala and West Bengal are good performers in health and education, though Kerala is, of course, in a higher league. Notably, both the states with their common history of Left rule are performing just about average on infrastructure. Among the hill states, there is a clear divide between the high-ranging Himachal Pradesh as the best in India and a flailing Uttarakhand far behind.</p><p align="justify">While Punjab fares decently on infrastructure, it slips from being a top-tier state in health and education to a medium-ranging one. This is surprising, given the common perception of healthy Punjabis being uncompromising with their food habits. In contrast, the more subdued Tamils seem to be a healthier lot.</p><p align="justify">While the much discussed Gujarat comes out as slightly better than the all-India average on infrastructure, it does not fare too well on education and does poorly on health. Finally, while Maharashtra does well on education, it is quite average on health and quite poor on infrastructure for the wealth it enjoys.</p><p align="justify">We also find a significantly positive relationship between consumption and our three constructed indices, suggesting that in the long run, better development outcomes are indeed associated with high consumption and GDP. However, all of these observations are limited to simple associations rather than causal relationships, which can be more complex to establish.</p><p align="justify"><em>Pranjul Bhandari is an economist headed to the John F. Kennedy School of Government at Harvard University as a Mason Fellow.</em></p>',
'lang' => 'English',
'SITE_URL' => 'https://im4change.in/',
'site_title' => 'im4change',
'adminprix' => 'admin'
]
$article_current = object(App\Model\Entity\Article) {
'id' => (int) 21075,
'title' => 'A report card for India’s states -Pranjul Bhandari',
'subheading' => '',
'description' => '<div align="justify">
-Live Mint
</div>
<p align="justify">
<img src="tinymce/uploaded/Growth_1.bmp" alt="Growth" /><br />
<em>Cherry-picked indicators of progress cannot convey the complexities of development in India's diverse states </em>
</p>
<p align="justify">
Which Indian states have fared better than their peers and which ones have done relatively worse is a perennial question for discussion. There is more at stake than mere grading of states here. Investment flows, central government funds and praises for being a good state are all linked to this seemingly straightforward question.
</p>
<p align="justify">
It seems to have become fashionable for chief ministers to competitively boast about their performance. Most have a few favourite indicators that they brandish for this purpose. While some highlight the improvement in an indicator over the five odd years of their tenure as proof of good governance, others take a further step and stress how these indicators are better than another state's or even the national average.
</p>
<p align="justify">
A few stray indicators and anecdotes, however, cannot form a fair report card. That requires a more comprehensive assessment. It is not very telling for a much prosperous state (for example, Gujarat) to be compared with a less prosperous state (say, Bihar), which may have been disadvantaged for a variety of historical reasons. If states have to be compared in a constructive way, the yardstick for comparison needs to be levelled first.
</p>
<p align="justify">
How do we establish a fair and comprehensive basis for comparing the performance of states? How do we judge the authenticity of lofty claims? Here's a different way of looking at it: focus on health, education and infrastructure, which are the biggest development tasks at hand. Rather than depending on a single indicator, several indicators can be bunched together, forming an index for each of the three. For health, both input (for example, immunization) and output (infant mortality rate) variables are used. For education, indicators that reflect both quantity (net enrolment rate), as well as quality (reading level for enrolled children), are used. For infrastructure, indicators across electricity, communication, banking and transportation are bunched up. To keep the comparison impartial, the principal component, a tool for combining the indicators, is employed. The data is ordered such that a higher index value means a better performing state.
</p>
<p align="justify">
What do the results show? We find that across health, education and infrastructure, Kerala, Goa and Himachal Pradesh are among the best performers and the so-called BIMARU states-Bihar, Madhya Pradesh (MP), Rajasthan and Uttar Pradesh (UP)-are laggards. This is hardly surprising. After all, the wonders of Kerala are well documented by Amartya Sen and several others and the demographer Ashish Bose coined the term BIMARU way back in the 1980s to highlight their lower levels of development.
</p>
<p align="justify">
How does one get to a more telling and appropriate comparison of states that controls for their inherent differences? How do we put the states on a level playing field? This can be done by controlling for consumption per person. We evaluate how well a state is doing on health, education and infrastructure, given its level of per capita consumption. This allows us to ask more sophisticated questions: is Gujarat doing as good a job with the resources it has at its disposal in contrast to, say, Bihar or Maharashtra? Although per capita gross domestic product (GDP) and consumption broadly measure the same thing and are tightly correlated, consumption has the benefit of reflecting actual purchasing power by including income generated from outside the state (inter-state remittances) and excluding income which gets diverted away from a state (especially for mining states).
</p>
<p align="justify">
This levelling exercise yields some interesting insights, (summarized in the accompanying chart that ranks states on performance from left to right, with the height of the bar indicating how much better a state is from the all-India benchmark). There is a clear differentiation among the BIMARU states. The rankings of Orissa, Bihar and Chhattisgarh rise sharply across all the three sectors. Orissa and Bihar, in particular, seem to be doing well by all India standards given their low level of income. MP and UP are below average, especially in health. Jharkhand and Rajasthan seem to be doing pretty poorly on all three fronts.
</p>
<p align="justify">
Coastal Kerala and West Bengal are good performers in health and education, though Kerala is, of course, in a higher league. Notably, both the states with their common history of Left rule are performing just about average on infrastructure. Among the hill states, there is a clear divide between the high-ranging Himachal Pradesh as the best in India and a flailing Uttarakhand far behind.
</p>
<p align="justify">
While Punjab fares decently on infrastructure, it slips from being a top-tier state in health and education to a medium-ranging one. This is surprising, given the common perception of healthy Punjabis being uncompromising with their food habits. In contrast, the more subdued Tamils seem to be a healthier lot.
</p>
<p align="justify">
While the much discussed Gujarat comes out as slightly better than the all-India average on infrastructure, it does not fare too well on education and does poorly on health. Finally, while Maharashtra does well on education, it is quite average on health and quite poor on infrastructure for the wealth it enjoys.
</p>
<p align="justify">
We also find a significantly positive relationship between consumption and our three constructed indices, suggesting that in the long run, better development outcomes are indeed associated with high consumption and GDP. However, all of these observations are limited to simple associations rather than causal relationships, which can be more complex to establish.
</p>
<p align="justify">
<em>Pranjul Bhandari is an economist headed to the John F. Kennedy School of Government at Harvard University as a Mason Fellow.</em>
</p>',
'credit_writer' => 'Live Mint, 20 May, 2013, http://www.livemint.com/Opinion/VCyAxbnkhyA47bXE9Z9wfM/A-report-card-for-Indias-states.html',
'article_img' => '',
'article_img_thumb' => '',
'status' => (int) 1,
'show_on_home' => (int) 1,
'lang' => 'EN',
'category_id' => (int) 16,
'tag_keyword' => '',
'seo_url' => 'a-report-card-for-indias-states-pranjul-bhandari-21220',
'meta_title' => null,
'meta_keywords' => null,
'meta_description' => null,
'noindex' => (int) 0,
'publish_date' => object(Cake\I18n\FrozenDate) {},
'most_visit_section_id' => null,
'article_big_img' => null,
'liveid' => (int) 21220,
'created' => object(Cake\I18n\FrozenTime) {},
'modified' => object(Cake\I18n\FrozenTime) {},
'edate' => '',
'tags' => [
(int) 0 => object(Cake\ORM\Entity) {},
(int) 1 => object(Cake\ORM\Entity) {},
(int) 2 => object(Cake\ORM\Entity) {},
(int) 3 => object(Cake\ORM\Entity) {},
(int) 4 => object(Cake\ORM\Entity) {}
],
'category' => object(App\Model\Entity\Category) {},
'[new]' => false,
'[accessible]' => [
'*' => true,
'id' => false
],
'[dirty]' => [],
'[original]' => [],
'[virtual]' => [],
'[hasErrors]' => false,
'[errors]' => [],
'[invalid]' => [],
'[repository]' => 'Articles'
}
$articleid = (int) 21075
$metaTitle = 'LATEST NEWS UPDATES | A report card for India’s states -Pranjul Bhandari'
$metaKeywords = 'Human Development,Health,education,economy,Growth'
$metaDesc = '
-Live Mint
Cherry-picked indicators of progress cannot convey the complexities of development in India's diverse states
Which Indian states have fared better than their peers and which ones have done relatively worse is a perennial question for discussion. There is more...'
$disp = '<div align="justify">-Live Mint</div><p align="justify"><img src="https://im4change.in/siteadmin/tinymce/uploaded/Growth_1.bmp" alt="Growth" /><br /><em>Cherry-picked indicators of progress cannot convey the complexities of development in India's diverse states </em></p><p align="justify">Which Indian states have fared better than their peers and which ones have done relatively worse is a perennial question for discussion. There is more at stake than mere grading of states here. Investment flows, central government funds and praises for being a good state are all linked to this seemingly straightforward question.</p><p align="justify">It seems to have become fashionable for chief ministers to competitively boast about their performance. Most have a few favourite indicators that they brandish for this purpose. While some highlight the improvement in an indicator over the five odd years of their tenure as proof of good governance, others take a further step and stress how these indicators are better than another state's or even the national average.</p><p align="justify">A few stray indicators and anecdotes, however, cannot form a fair report card. That requires a more comprehensive assessment. It is not very telling for a much prosperous state (for example, Gujarat) to be compared with a less prosperous state (say, Bihar), which may have been disadvantaged for a variety of historical reasons. If states have to be compared in a constructive way, the yardstick for comparison needs to be levelled first. </p><p align="justify">How do we establish a fair and comprehensive basis for comparing the performance of states? How do we judge the authenticity of lofty claims? Here's a different way of looking at it: focus on health, education and infrastructure, which are the biggest development tasks at hand. Rather than depending on a single indicator, several indicators can be bunched together, forming an index for each of the three. For health, both input (for example, immunization) and output (infant mortality rate) variables are used. For education, indicators that reflect both quantity (net enrolment rate), as well as quality (reading level for enrolled children), are used. For infrastructure, indicators across electricity, communication, banking and transportation are bunched up. To keep the comparison impartial, the principal component, a tool for combining the indicators, is employed. The data is ordered such that a higher index value means a better performing state.</p><p align="justify">What do the results show? We find that across health, education and infrastructure, Kerala, Goa and Himachal Pradesh are among the best performers and the so-called BIMARU states-Bihar, Madhya Pradesh (MP), Rajasthan and Uttar Pradesh (UP)-are laggards. This is hardly surprising. After all, the wonders of Kerala are well documented by Amartya Sen and several others and the demographer Ashish Bose coined the term BIMARU way back in the 1980s to highlight their lower levels of development.</p><p align="justify">How does one get to a more telling and appropriate comparison of states that controls for their inherent differences? How do we put the states on a level playing field? This can be done by controlling for consumption per person. We evaluate how well a state is doing on health, education and infrastructure, given its level of per capita consumption. This allows us to ask more sophisticated questions: is Gujarat doing as good a job with the resources it has at its disposal in contrast to, say, Bihar or Maharashtra? Although per capita gross domestic product (GDP) and consumption broadly measure the same thing and are tightly correlated, consumption has the benefit of reflecting actual purchasing power by including income generated from outside the state (inter-state remittances) and excluding income which gets diverted away from a state (especially for mining states).</p><p align="justify">This levelling exercise yields some interesting insights, (summarized in the accompanying chart that ranks states on performance from left to right, with the height of the bar indicating how much better a state is from the all-India benchmark). There is a clear differentiation among the BIMARU states. The rankings of Orissa, Bihar and Chhattisgarh rise sharply across all the three sectors. Orissa and Bihar, in particular, seem to be doing well by all India standards given their low level of income. MP and UP are below average, especially in health. Jharkhand and Rajasthan seem to be doing pretty poorly on all three fronts.</p><p align="justify">Coastal Kerala and West Bengal are good performers in health and education, though Kerala is, of course, in a higher league. Notably, both the states with their common history of Left rule are performing just about average on infrastructure. Among the hill states, there is a clear divide between the high-ranging Himachal Pradesh as the best in India and a flailing Uttarakhand far behind.</p><p align="justify">While Punjab fares decently on infrastructure, it slips from being a top-tier state in health and education to a medium-ranging one. This is surprising, given the common perception of healthy Punjabis being uncompromising with their food habits. In contrast, the more subdued Tamils seem to be a healthier lot.</p><p align="justify">While the much discussed Gujarat comes out as slightly better than the all-India average on infrastructure, it does not fare too well on education and does poorly on health. Finally, while Maharashtra does well on education, it is quite average on health and quite poor on infrastructure for the wealth it enjoys.</p><p align="justify">We also find a significantly positive relationship between consumption and our three constructed indices, suggesting that in the long run, better development outcomes are indeed associated with high consumption and GDP. However, all of these observations are limited to simple associations rather than causal relationships, which can be more complex to establish.</p><p align="justify"><em>Pranjul Bhandari is an economist headed to the John F. Kennedy School of Government at Harvard University as a Mason Fellow.</em></p>'
$lang = 'English'
$SITE_URL = 'https://im4change.in/'
$site_title = 'im4change'
$adminprix = 'admin'</pre><pre class="stack-trace">include - APP/Template/Layout/printlayout.ctp, line 8
Cake\View\View::_evaluate() - CORE/src/View/View.php, line 1413
Cake\View\View::_render() - CORE/src/View/View.php, line 1374
Cake\View\View::renderLayout() - CORE/src/View/View.php, line 927
Cake\View\View::render() - CORE/src/View/View.php, line 885
Cake\Controller\Controller::render() - CORE/src/Controller/Controller.php, line 791
Cake\Http\ActionDispatcher::_invoke() - CORE/src/Http/ActionDispatcher.php, line 126
Cake\Http\ActionDispatcher::dispatch() - CORE/src/Http/ActionDispatcher.php, line 94
Cake\Http\BaseApplication::__invoke() - CORE/src/Http/BaseApplication.php, line 235
Cake\Http\Runner::__invoke() - CORE/src/Http/Runner.php, line 65
Cake\Routing\Middleware\RoutingMiddleware::__invoke() - CORE/src/Routing/Middleware/RoutingMiddleware.php, line 162
Cake\Http\Runner::__invoke() - CORE/src/Http/Runner.php, line 65
Cake\Routing\Middleware\AssetMiddleware::__invoke() - CORE/src/Routing/Middleware/AssetMiddleware.php, line 88
Cake\Http\Runner::__invoke() - CORE/src/Http/Runner.php, line 65
Cake\Error\Middleware\ErrorHandlerMiddleware::__invoke() - CORE/src/Error/Middleware/ErrorHandlerMiddleware.php, line 96
Cake\Http\Runner::__invoke() - CORE/src/Http/Runner.php, line 65
Cake\Http\Runner::run() - CORE/src/Http/Runner.php, line 51</pre></div></pre>latest-news-updates/a-report-card-for-indias-states-pranjul-bhandari-21220.html"/>
<meta http-equiv="Content-Type" content="text/html; charset=utf-8"/>
<link href="https://im4change.in/css/control.css" rel="stylesheet" type="text/css"
media="all"/>
<title>LATEST NEWS UPDATES | A report card for India’s states -Pranjul Bhandari | Im4change.org</title>
<meta name="description" content="
-Live Mint
Cherry-picked indicators of progress cannot convey the complexities of development in India's diverse states
Which Indian states have fared better than their peers and which ones have done relatively worse is a perennial question for discussion. There is more..."/>
<script src="https://im4change.in/js/jquery-1.10.2.js"></script>
<script type="text/javascript" src="https://im4change.in/js/jquery-migrate.min.js"></script>
<script language="javascript" type="text/javascript">
$(document).ready(function () {
var img = $("img")[0]; // Get my img elem
var pic_real_width, pic_real_height;
$("<img/>") // Make in memory copy of image to avoid css issues
.attr("src", $(img).attr("src"))
.load(function () {
pic_real_width = this.width; // Note: $(this).width() will not
pic_real_height = this.height; // work for in memory images.
});
});
</script>
<style type="text/css">
@media screen {
div.divFooter {
display: block;
}
}
@media print {
.printbutton {
display: none !important;
}
}
</style>
</head>
<body>
<table cellpadding="0" cellspacing="0" border="0" width="98%" align="center">
<tr>
<td class="top_bg">
<div class="divFooter">
<img src="https://im4change.in/images/logo1.jpg" height="59" border="0"
alt="Resource centre on India's rural distress" style="padding-top:14px;"/>
</div>
</td>
</tr>
<tr>
<td id="topspace"> </td>
</tr>
<tr id="topspace">
<td> </td>
</tr>
<tr>
<td height="50" style="border-bottom:1px solid #000; padding-top:10px;" class="printbutton">
<form><input type="button" value=" Print this page "
onclick="window.print();return false;"/></form>
</td>
</tr>
<tr>
<td width="100%">
<h1 class="news_headlines" style="font-style:normal">
<strong>A report card for India’s states -Pranjul Bhandari</strong></h1>
</td>
</tr>
<tr>
<td width="100%" style="font-family:Arial, 'Segoe Script', 'Segoe UI', sans-serif, serif"><font size="3">
<div align="justify">-Live Mint</div><p align="justify"><img src="https://im4change.in/siteadmin/tinymce/uploaded/Growth_1.bmp" alt="Growth" /><br /><em>Cherry-picked indicators of progress cannot convey the complexities of development in India's diverse states </em></p><p align="justify">Which Indian states have fared better than their peers and which ones have done relatively worse is a perennial question for discussion. There is more at stake than mere grading of states here. Investment flows, central government funds and praises for being a good state are all linked to this seemingly straightforward question.</p><p align="justify">It seems to have become fashionable for chief ministers to competitively boast about their performance. Most have a few favourite indicators that they brandish for this purpose. While some highlight the improvement in an indicator over the five odd years of their tenure as proof of good governance, others take a further step and stress how these indicators are better than another state's or even the national average.</p><p align="justify">A few stray indicators and anecdotes, however, cannot form a fair report card. That requires a more comprehensive assessment. It is not very telling for a much prosperous state (for example, Gujarat) to be compared with a less prosperous state (say, Bihar), which may have been disadvantaged for a variety of historical reasons. If states have to be compared in a constructive way, the yardstick for comparison needs to be levelled first. </p><p align="justify">How do we establish a fair and comprehensive basis for comparing the performance of states? How do we judge the authenticity of lofty claims? Here's a different way of looking at it: focus on health, education and infrastructure, which are the biggest development tasks at hand. Rather than depending on a single indicator, several indicators can be bunched together, forming an index for each of the three. For health, both input (for example, immunization) and output (infant mortality rate) variables are used. For education, indicators that reflect both quantity (net enrolment rate), as well as quality (reading level for enrolled children), are used. For infrastructure, indicators across electricity, communication, banking and transportation are bunched up. To keep the comparison impartial, the principal component, a tool for combining the indicators, is employed. The data is ordered such that a higher index value means a better performing state.</p><p align="justify">What do the results show? We find that across health, education and infrastructure, Kerala, Goa and Himachal Pradesh are among the best performers and the so-called BIMARU states-Bihar, Madhya Pradesh (MP), Rajasthan and Uttar Pradesh (UP)-are laggards. This is hardly surprising. After all, the wonders of Kerala are well documented by Amartya Sen and several others and the demographer Ashish Bose coined the term BIMARU way back in the 1980s to highlight their lower levels of development.</p><p align="justify">How does one get to a more telling and appropriate comparison of states that controls for their inherent differences? How do we put the states on a level playing field? This can be done by controlling for consumption per person. We evaluate how well a state is doing on health, education and infrastructure, given its level of per capita consumption. This allows us to ask more sophisticated questions: is Gujarat doing as good a job with the resources it has at its disposal in contrast to, say, Bihar or Maharashtra? Although per capita gross domestic product (GDP) and consumption broadly measure the same thing and are tightly correlated, consumption has the benefit of reflecting actual purchasing power by including income generated from outside the state (inter-state remittances) and excluding income which gets diverted away from a state (especially for mining states).</p><p align="justify">This levelling exercise yields some interesting insights, (summarized in the accompanying chart that ranks states on performance from left to right, with the height of the bar indicating how much better a state is from the all-India benchmark). There is a clear differentiation among the BIMARU states. The rankings of Orissa, Bihar and Chhattisgarh rise sharply across all the three sectors. Orissa and Bihar, in particular, seem to be doing well by all India standards given their low level of income. MP and UP are below average, especially in health. Jharkhand and Rajasthan seem to be doing pretty poorly on all three fronts.</p><p align="justify">Coastal Kerala and West Bengal are good performers in health and education, though Kerala is, of course, in a higher league. Notably, both the states with their common history of Left rule are performing just about average on infrastructure. Among the hill states, there is a clear divide between the high-ranging Himachal Pradesh as the best in India and a flailing Uttarakhand far behind.</p><p align="justify">While Punjab fares decently on infrastructure, it slips from being a top-tier state in health and education to a medium-ranging one. This is surprising, given the common perception of healthy Punjabis being uncompromising with their food habits. In contrast, the more subdued Tamils seem to be a healthier lot.</p><p align="justify">While the much discussed Gujarat comes out as slightly better than the all-India average on infrastructure, it does not fare too well on education and does poorly on health. Finally, while Maharashtra does well on education, it is quite average on health and quite poor on infrastructure for the wealth it enjoys.</p><p align="justify">We also find a significantly positive relationship between consumption and our three constructed indices, suggesting that in the long run, better development outcomes are indeed associated with high consumption and GDP. However, all of these observations are limited to simple associations rather than causal relationships, which can be more complex to establish.</p><p align="justify"><em>Pranjul Bhandari is an economist headed to the John F. Kennedy School of Government at Harvard University as a Mason Fellow.</em></p> </font>
</td>
</tr>
<tr>
<td> </td>
</tr>
<tr>
<td height="50" style="border-top:1px solid #000; border-bottom:1px solid #000;padding-top:10px;">
<form><input type="button" value=" Print this page "
onclick="window.print();return false;"/></form>
</td>
</tr>
</table></body>
</html>'
}
$maxBufferLength = (int) 8192
$file = '/home/brlfuser/public_html/vendor/cakephp/cakephp/src/Error/Debugger.php'
$line = (int) 853
$message = 'Unable to emit headers. Headers sent in file=/home/brlfuser/public_html/vendor/cakephp/cakephp/src/Error/Debugger.php line=853'
Cake\Http\ResponseEmitter::emit() - CORE/src/Http/ResponseEmitter.php, line 48
Cake\Http\Server::emit() - CORE/src/Http/Server.php, line 141
[main] - ROOT/webroot/index.php, line 39
Warning (2): Cannot modify header information - headers already sent by (output started at /home/brlfuser/public_html/vendor/cakephp/cakephp/src/Error/Debugger.php:853) [CORE/src/Http/ResponseEmitter.php, line 148]
$response = object(Cake\Http\Response) {
'status' => (int) 200,
'contentType' => 'text/html',
'headers' => [
'Content-Type' => [
[maximum depth reached]
]
],
'file' => null,
'fileRange' => [],
'cookies' => object(Cake\Http\Cookie\CookieCollection) {},
'cacheDirectives' => [],
'body' => '<!DOCTYPE html PUBLIC "-//W3C//DTD XHTML 1.0 Transitional//EN"
"http://www.w3.org/TR/xhtml1/DTD/xhtml1-transitional.dtd">
<html xmlns="http://www.w3.org/1999/xhtml">
<head>
<link rel="canonical" href="https://im4change.in/<pre class="cake-error"><a href="javascript:void(0);" onclick="document.getElementById('cakeErr67feb98dae9a9-trace').style.display = (document.getElementById('cakeErr67feb98dae9a9-trace').style.display == 'none' ? '' : 'none');"><b>Notice</b> (8)</a>: Undefined variable: urlPrefix [<b>APP/Template/Layout/printlayout.ctp</b>, line <b>8</b>]<div id="cakeErr67feb98dae9a9-trace" class="cake-stack-trace" style="display: none;"><a href="javascript:void(0);" onclick="document.getElementById('cakeErr67feb98dae9a9-code').style.display = (document.getElementById('cakeErr67feb98dae9a9-code').style.display == 'none' ? '' : 'none')">Code</a> <a href="javascript:void(0);" onclick="document.getElementById('cakeErr67feb98dae9a9-context').style.display = (document.getElementById('cakeErr67feb98dae9a9-context').style.display == 'none' ? '' : 'none')">Context</a><pre id="cakeErr67feb98dae9a9-code" class="cake-code-dump" style="display: none;"><code><span style="color: #000000"><span style="color: #0000BB"></span><span style="color: #007700"><</span><span style="color: #0000BB">head</span><span style="color: #007700">>
</span></span></code>
<span class="code-highlight"><code><span style="color: #000000"> <link rel="canonical" href="<span style="color: #0000BB"><?php </span><span style="color: #007700">echo </span><span style="color: #0000BB">Configure</span><span style="color: #007700">::</span><span style="color: #0000BB">read</span><span style="color: #007700">(</span><span style="color: #DD0000">'SITE_URL'</span><span style="color: #007700">); </span><span style="color: #0000BB">?><?php </span><span style="color: #007700">echo </span><span style="color: #0000BB">$urlPrefix</span><span style="color: #007700">;</span><span style="color: #0000BB">?><?php </span><span style="color: #007700">echo </span><span style="color: #0000BB">$article_current</span><span style="color: #007700">-></span><span style="color: #0000BB">category</span><span style="color: #007700">-></span><span style="color: #0000BB">slug</span><span style="color: #007700">; </span><span style="color: #0000BB">?></span>/<span style="color: #0000BB"><?php </span><span style="color: #007700">echo </span><span style="color: #0000BB">$article_current</span><span style="color: #007700">-></span><span style="color: #0000BB">seo_url</span><span style="color: #007700">; </span><span style="color: #0000BB">?></span>.html"/>
</span></code></span>
<code><span style="color: #000000"><span style="color: #0000BB"> </span><span style="color: #007700"><</span><span style="color: #0000BB">meta http</span><span style="color: #007700">-</span><span style="color: #0000BB">equiv</span><span style="color: #007700">=</span><span style="color: #DD0000">"Content-Type" </span><span style="color: #0000BB">content</span><span style="color: #007700">=</span><span style="color: #DD0000">"text/html; charset=utf-8"</span><span style="color: #007700">/>
</span></span></code></pre><pre id="cakeErr67feb98dae9a9-context" class="cake-context" style="display: none;">$viewFile = '/home/brlfuser/public_html/src/Template/Layout/printlayout.ctp'
$dataForView = [
'article_current' => object(App\Model\Entity\Article) {
'id' => (int) 21075,
'title' => 'A report card for India’s states -Pranjul Bhandari',
'subheading' => '',
'description' => '<div align="justify">
-Live Mint
</div>
<p align="justify">
<img src="tinymce/uploaded/Growth_1.bmp" alt="Growth" /><br />
<em>Cherry-picked indicators of progress cannot convey the complexities of development in India's diverse states </em>
</p>
<p align="justify">
Which Indian states have fared better than their peers and which ones have done relatively worse is a perennial question for discussion. There is more at stake than mere grading of states here. Investment flows, central government funds and praises for being a good state are all linked to this seemingly straightforward question.
</p>
<p align="justify">
It seems to have become fashionable for chief ministers to competitively boast about their performance. Most have a few favourite indicators that they brandish for this purpose. While some highlight the improvement in an indicator over the five odd years of their tenure as proof of good governance, others take a further step and stress how these indicators are better than another state's or even the national average.
</p>
<p align="justify">
A few stray indicators and anecdotes, however, cannot form a fair report card. That requires a more comprehensive assessment. It is not very telling for a much prosperous state (for example, Gujarat) to be compared with a less prosperous state (say, Bihar), which may have been disadvantaged for a variety of historical reasons. If states have to be compared in a constructive way, the yardstick for comparison needs to be levelled first.
</p>
<p align="justify">
How do we establish a fair and comprehensive basis for comparing the performance of states? How do we judge the authenticity of lofty claims? Here's a different way of looking at it: focus on health, education and infrastructure, which are the biggest development tasks at hand. Rather than depending on a single indicator, several indicators can be bunched together, forming an index for each of the three. For health, both input (for example, immunization) and output (infant mortality rate) variables are used. For education, indicators that reflect both quantity (net enrolment rate), as well as quality (reading level for enrolled children), are used. For infrastructure, indicators across electricity, communication, banking and transportation are bunched up. To keep the comparison impartial, the principal component, a tool for combining the indicators, is employed. The data is ordered such that a higher index value means a better performing state.
</p>
<p align="justify">
What do the results show? We find that across health, education and infrastructure, Kerala, Goa and Himachal Pradesh are among the best performers and the so-called BIMARU states-Bihar, Madhya Pradesh (MP), Rajasthan and Uttar Pradesh (UP)-are laggards. This is hardly surprising. After all, the wonders of Kerala are well documented by Amartya Sen and several others and the demographer Ashish Bose coined the term BIMARU way back in the 1980s to highlight their lower levels of development.
</p>
<p align="justify">
How does one get to a more telling and appropriate comparison of states that controls for their inherent differences? How do we put the states on a level playing field? This can be done by controlling for consumption per person. We evaluate how well a state is doing on health, education and infrastructure, given its level of per capita consumption. This allows us to ask more sophisticated questions: is Gujarat doing as good a job with the resources it has at its disposal in contrast to, say, Bihar or Maharashtra? Although per capita gross domestic product (GDP) and consumption broadly measure the same thing and are tightly correlated, consumption has the benefit of reflecting actual purchasing power by including income generated from outside the state (inter-state remittances) and excluding income which gets diverted away from a state (especially for mining states).
</p>
<p align="justify">
This levelling exercise yields some interesting insights, (summarized in the accompanying chart that ranks states on performance from left to right, with the height of the bar indicating how much better a state is from the all-India benchmark). There is a clear differentiation among the BIMARU states. The rankings of Orissa, Bihar and Chhattisgarh rise sharply across all the three sectors. Orissa and Bihar, in particular, seem to be doing well by all India standards given their low level of income. MP and UP are below average, especially in health. Jharkhand and Rajasthan seem to be doing pretty poorly on all three fronts.
</p>
<p align="justify">
Coastal Kerala and West Bengal are good performers in health and education, though Kerala is, of course, in a higher league. Notably, both the states with their common history of Left rule are performing just about average on infrastructure. Among the hill states, there is a clear divide between the high-ranging Himachal Pradesh as the best in India and a flailing Uttarakhand far behind.
</p>
<p align="justify">
While Punjab fares decently on infrastructure, it slips from being a top-tier state in health and education to a medium-ranging one. This is surprising, given the common perception of healthy Punjabis being uncompromising with their food habits. In contrast, the more subdued Tamils seem to be a healthier lot.
</p>
<p align="justify">
While the much discussed Gujarat comes out as slightly better than the all-India average on infrastructure, it does not fare too well on education and does poorly on health. Finally, while Maharashtra does well on education, it is quite average on health and quite poor on infrastructure for the wealth it enjoys.
</p>
<p align="justify">
We also find a significantly positive relationship between consumption and our three constructed indices, suggesting that in the long run, better development outcomes are indeed associated with high consumption and GDP. However, all of these observations are limited to simple associations rather than causal relationships, which can be more complex to establish.
</p>
<p align="justify">
<em>Pranjul Bhandari is an economist headed to the John F. Kennedy School of Government at Harvard University as a Mason Fellow.</em>
</p>',
'credit_writer' => 'Live Mint, 20 May, 2013, http://www.livemint.com/Opinion/VCyAxbnkhyA47bXE9Z9wfM/A-report-card-for-Indias-states.html',
'article_img' => '',
'article_img_thumb' => '',
'status' => (int) 1,
'show_on_home' => (int) 1,
'lang' => 'EN',
'category_id' => (int) 16,
'tag_keyword' => '',
'seo_url' => 'a-report-card-for-indias-states-pranjul-bhandari-21220',
'meta_title' => null,
'meta_keywords' => null,
'meta_description' => null,
'noindex' => (int) 0,
'publish_date' => object(Cake\I18n\FrozenDate) {},
'most_visit_section_id' => null,
'article_big_img' => null,
'liveid' => (int) 21220,
'created' => object(Cake\I18n\FrozenTime) {},
'modified' => object(Cake\I18n\FrozenTime) {},
'edate' => '',
'tags' => [
[maximum depth reached]
],
'category' => object(App\Model\Entity\Category) {},
'[new]' => false,
'[accessible]' => [
[maximum depth reached]
],
'[dirty]' => [[maximum depth reached]],
'[original]' => [[maximum depth reached]],
'[virtual]' => [[maximum depth reached]],
'[hasErrors]' => false,
'[errors]' => [[maximum depth reached]],
'[invalid]' => [[maximum depth reached]],
'[repository]' => 'Articles'
},
'articleid' => (int) 21075,
'metaTitle' => 'LATEST NEWS UPDATES | A report card for India’s states -Pranjul Bhandari',
'metaKeywords' => 'Human Development,Health,education,economy,Growth',
'metaDesc' => '
-Live Mint
Cherry-picked indicators of progress cannot convey the complexities of development in India's diverse states
Which Indian states have fared better than their peers and which ones have done relatively worse is a perennial question for discussion. There is more...',
'disp' => '<div align="justify">-Live Mint</div><p align="justify"><img src="https://im4change.in/siteadmin/tinymce/uploaded/Growth_1.bmp" alt="Growth" /><br /><em>Cherry-picked indicators of progress cannot convey the complexities of development in India's diverse states </em></p><p align="justify">Which Indian states have fared better than their peers and which ones have done relatively worse is a perennial question for discussion. There is more at stake than mere grading of states here. Investment flows, central government funds and praises for being a good state are all linked to this seemingly straightforward question.</p><p align="justify">It seems to have become fashionable for chief ministers to competitively boast about their performance. Most have a few favourite indicators that they brandish for this purpose. While some highlight the improvement in an indicator over the five odd years of their tenure as proof of good governance, others take a further step and stress how these indicators are better than another state's or even the national average.</p><p align="justify">A few stray indicators and anecdotes, however, cannot form a fair report card. That requires a more comprehensive assessment. It is not very telling for a much prosperous state (for example, Gujarat) to be compared with a less prosperous state (say, Bihar), which may have been disadvantaged for a variety of historical reasons. If states have to be compared in a constructive way, the yardstick for comparison needs to be levelled first. </p><p align="justify">How do we establish a fair and comprehensive basis for comparing the performance of states? How do we judge the authenticity of lofty claims? Here's a different way of looking at it: focus on health, education and infrastructure, which are the biggest development tasks at hand. Rather than depending on a single indicator, several indicators can be bunched together, forming an index for each of the three. For health, both input (for example, immunization) and output (infant mortality rate) variables are used. For education, indicators that reflect both quantity (net enrolment rate), as well as quality (reading level for enrolled children), are used. For infrastructure, indicators across electricity, communication, banking and transportation are bunched up. To keep the comparison impartial, the principal component, a tool for combining the indicators, is employed. The data is ordered such that a higher index value means a better performing state.</p><p align="justify">What do the results show? We find that across health, education and infrastructure, Kerala, Goa and Himachal Pradesh are among the best performers and the so-called BIMARU states-Bihar, Madhya Pradesh (MP), Rajasthan and Uttar Pradesh (UP)-are laggards. This is hardly surprising. After all, the wonders of Kerala are well documented by Amartya Sen and several others and the demographer Ashish Bose coined the term BIMARU way back in the 1980s to highlight their lower levels of development.</p><p align="justify">How does one get to a more telling and appropriate comparison of states that controls for their inherent differences? How do we put the states on a level playing field? This can be done by controlling for consumption per person. We evaluate how well a state is doing on health, education and infrastructure, given its level of per capita consumption. This allows us to ask more sophisticated questions: is Gujarat doing as good a job with the resources it has at its disposal in contrast to, say, Bihar or Maharashtra? Although per capita gross domestic product (GDP) and consumption broadly measure the same thing and are tightly correlated, consumption has the benefit of reflecting actual purchasing power by including income generated from outside the state (inter-state remittances) and excluding income which gets diverted away from a state (especially for mining states).</p><p align="justify">This levelling exercise yields some interesting insights, (summarized in the accompanying chart that ranks states on performance from left to right, with the height of the bar indicating how much better a state is from the all-India benchmark). There is a clear differentiation among the BIMARU states. The rankings of Orissa, Bihar and Chhattisgarh rise sharply across all the three sectors. Orissa and Bihar, in particular, seem to be doing well by all India standards given their low level of income. MP and UP are below average, especially in health. Jharkhand and Rajasthan seem to be doing pretty poorly on all three fronts.</p><p align="justify">Coastal Kerala and West Bengal are good performers in health and education, though Kerala is, of course, in a higher league. Notably, both the states with their common history of Left rule are performing just about average on infrastructure. Among the hill states, there is a clear divide between the high-ranging Himachal Pradesh as the best in India and a flailing Uttarakhand far behind.</p><p align="justify">While Punjab fares decently on infrastructure, it slips from being a top-tier state in health and education to a medium-ranging one. This is surprising, given the common perception of healthy Punjabis being uncompromising with their food habits. In contrast, the more subdued Tamils seem to be a healthier lot.</p><p align="justify">While the much discussed Gujarat comes out as slightly better than the all-India average on infrastructure, it does not fare too well on education and does poorly on health. Finally, while Maharashtra does well on education, it is quite average on health and quite poor on infrastructure for the wealth it enjoys.</p><p align="justify">We also find a significantly positive relationship between consumption and our three constructed indices, suggesting that in the long run, better development outcomes are indeed associated with high consumption and GDP. However, all of these observations are limited to simple associations rather than causal relationships, which can be more complex to establish.</p><p align="justify"><em>Pranjul Bhandari is an economist headed to the John F. Kennedy School of Government at Harvard University as a Mason Fellow.</em></p>',
'lang' => 'English',
'SITE_URL' => 'https://im4change.in/',
'site_title' => 'im4change',
'adminprix' => 'admin'
]
$article_current = object(App\Model\Entity\Article) {
'id' => (int) 21075,
'title' => 'A report card for India’s states -Pranjul Bhandari',
'subheading' => '',
'description' => '<div align="justify">
-Live Mint
</div>
<p align="justify">
<img src="tinymce/uploaded/Growth_1.bmp" alt="Growth" /><br />
<em>Cherry-picked indicators of progress cannot convey the complexities of development in India's diverse states </em>
</p>
<p align="justify">
Which Indian states have fared better than their peers and which ones have done relatively worse is a perennial question for discussion. There is more at stake than mere grading of states here. Investment flows, central government funds and praises for being a good state are all linked to this seemingly straightforward question.
</p>
<p align="justify">
It seems to have become fashionable for chief ministers to competitively boast about their performance. Most have a few favourite indicators that they brandish for this purpose. While some highlight the improvement in an indicator over the five odd years of their tenure as proof of good governance, others take a further step and stress how these indicators are better than another state's or even the national average.
</p>
<p align="justify">
A few stray indicators and anecdotes, however, cannot form a fair report card. That requires a more comprehensive assessment. It is not very telling for a much prosperous state (for example, Gujarat) to be compared with a less prosperous state (say, Bihar), which may have been disadvantaged for a variety of historical reasons. If states have to be compared in a constructive way, the yardstick for comparison needs to be levelled first.
</p>
<p align="justify">
How do we establish a fair and comprehensive basis for comparing the performance of states? How do we judge the authenticity of lofty claims? Here's a different way of looking at it: focus on health, education and infrastructure, which are the biggest development tasks at hand. Rather than depending on a single indicator, several indicators can be bunched together, forming an index for each of the three. For health, both input (for example, immunization) and output (infant mortality rate) variables are used. For education, indicators that reflect both quantity (net enrolment rate), as well as quality (reading level for enrolled children), are used. For infrastructure, indicators across electricity, communication, banking and transportation are bunched up. To keep the comparison impartial, the principal component, a tool for combining the indicators, is employed. The data is ordered such that a higher index value means a better performing state.
</p>
<p align="justify">
What do the results show? We find that across health, education and infrastructure, Kerala, Goa and Himachal Pradesh are among the best performers and the so-called BIMARU states-Bihar, Madhya Pradesh (MP), Rajasthan and Uttar Pradesh (UP)-are laggards. This is hardly surprising. After all, the wonders of Kerala are well documented by Amartya Sen and several others and the demographer Ashish Bose coined the term BIMARU way back in the 1980s to highlight their lower levels of development.
</p>
<p align="justify">
How does one get to a more telling and appropriate comparison of states that controls for their inherent differences? How do we put the states on a level playing field? This can be done by controlling for consumption per person. We evaluate how well a state is doing on health, education and infrastructure, given its level of per capita consumption. This allows us to ask more sophisticated questions: is Gujarat doing as good a job with the resources it has at its disposal in contrast to, say, Bihar or Maharashtra? Although per capita gross domestic product (GDP) and consumption broadly measure the same thing and are tightly correlated, consumption has the benefit of reflecting actual purchasing power by including income generated from outside the state (inter-state remittances) and excluding income which gets diverted away from a state (especially for mining states).
</p>
<p align="justify">
This levelling exercise yields some interesting insights, (summarized in the accompanying chart that ranks states on performance from left to right, with the height of the bar indicating how much better a state is from the all-India benchmark). There is a clear differentiation among the BIMARU states. The rankings of Orissa, Bihar and Chhattisgarh rise sharply across all the three sectors. Orissa and Bihar, in particular, seem to be doing well by all India standards given their low level of income. MP and UP are below average, especially in health. Jharkhand and Rajasthan seem to be doing pretty poorly on all three fronts.
</p>
<p align="justify">
Coastal Kerala and West Bengal are good performers in health and education, though Kerala is, of course, in a higher league. Notably, both the states with their common history of Left rule are performing just about average on infrastructure. Among the hill states, there is a clear divide between the high-ranging Himachal Pradesh as the best in India and a flailing Uttarakhand far behind.
</p>
<p align="justify">
While Punjab fares decently on infrastructure, it slips from being a top-tier state in health and education to a medium-ranging one. This is surprising, given the common perception of healthy Punjabis being uncompromising with their food habits. In contrast, the more subdued Tamils seem to be a healthier lot.
</p>
<p align="justify">
While the much discussed Gujarat comes out as slightly better than the all-India average on infrastructure, it does not fare too well on education and does poorly on health. Finally, while Maharashtra does well on education, it is quite average on health and quite poor on infrastructure for the wealth it enjoys.
</p>
<p align="justify">
We also find a significantly positive relationship between consumption and our three constructed indices, suggesting that in the long run, better development outcomes are indeed associated with high consumption and GDP. However, all of these observations are limited to simple associations rather than causal relationships, which can be more complex to establish.
</p>
<p align="justify">
<em>Pranjul Bhandari is an economist headed to the John F. Kennedy School of Government at Harvard University as a Mason Fellow.</em>
</p>',
'credit_writer' => 'Live Mint, 20 May, 2013, http://www.livemint.com/Opinion/VCyAxbnkhyA47bXE9Z9wfM/A-report-card-for-Indias-states.html',
'article_img' => '',
'article_img_thumb' => '',
'status' => (int) 1,
'show_on_home' => (int) 1,
'lang' => 'EN',
'category_id' => (int) 16,
'tag_keyword' => '',
'seo_url' => 'a-report-card-for-indias-states-pranjul-bhandari-21220',
'meta_title' => null,
'meta_keywords' => null,
'meta_description' => null,
'noindex' => (int) 0,
'publish_date' => object(Cake\I18n\FrozenDate) {},
'most_visit_section_id' => null,
'article_big_img' => null,
'liveid' => (int) 21220,
'created' => object(Cake\I18n\FrozenTime) {},
'modified' => object(Cake\I18n\FrozenTime) {},
'edate' => '',
'tags' => [
(int) 0 => object(Cake\ORM\Entity) {},
(int) 1 => object(Cake\ORM\Entity) {},
(int) 2 => object(Cake\ORM\Entity) {},
(int) 3 => object(Cake\ORM\Entity) {},
(int) 4 => object(Cake\ORM\Entity) {}
],
'category' => object(App\Model\Entity\Category) {},
'[new]' => false,
'[accessible]' => [
'*' => true,
'id' => false
],
'[dirty]' => [],
'[original]' => [],
'[virtual]' => [],
'[hasErrors]' => false,
'[errors]' => [],
'[invalid]' => [],
'[repository]' => 'Articles'
}
$articleid = (int) 21075
$metaTitle = 'LATEST NEWS UPDATES | A report card for India’s states -Pranjul Bhandari'
$metaKeywords = 'Human Development,Health,education,economy,Growth'
$metaDesc = '
-Live Mint
Cherry-picked indicators of progress cannot convey the complexities of development in India's diverse states
Which Indian states have fared better than their peers and which ones have done relatively worse is a perennial question for discussion. There is more...'
$disp = '<div align="justify">-Live Mint</div><p align="justify"><img src="https://im4change.in/siteadmin/tinymce/uploaded/Growth_1.bmp" alt="Growth" /><br /><em>Cherry-picked indicators of progress cannot convey the complexities of development in India's diverse states </em></p><p align="justify">Which Indian states have fared better than their peers and which ones have done relatively worse is a perennial question for discussion. There is more at stake than mere grading of states here. Investment flows, central government funds and praises for being a good state are all linked to this seemingly straightforward question.</p><p align="justify">It seems to have become fashionable for chief ministers to competitively boast about their performance. Most have a few favourite indicators that they brandish for this purpose. While some highlight the improvement in an indicator over the five odd years of their tenure as proof of good governance, others take a further step and stress how these indicators are better than another state's or even the national average.</p><p align="justify">A few stray indicators and anecdotes, however, cannot form a fair report card. That requires a more comprehensive assessment. It is not very telling for a much prosperous state (for example, Gujarat) to be compared with a less prosperous state (say, Bihar), which may have been disadvantaged for a variety of historical reasons. If states have to be compared in a constructive way, the yardstick for comparison needs to be levelled first. </p><p align="justify">How do we establish a fair and comprehensive basis for comparing the performance of states? How do we judge the authenticity of lofty claims? Here's a different way of looking at it: focus on health, education and infrastructure, which are the biggest development tasks at hand. Rather than depending on a single indicator, several indicators can be bunched together, forming an index for each of the three. For health, both input (for example, immunization) and output (infant mortality rate) variables are used. For education, indicators that reflect both quantity (net enrolment rate), as well as quality (reading level for enrolled children), are used. For infrastructure, indicators across electricity, communication, banking and transportation are bunched up. To keep the comparison impartial, the principal component, a tool for combining the indicators, is employed. The data is ordered such that a higher index value means a better performing state.</p><p align="justify">What do the results show? We find that across health, education and infrastructure, Kerala, Goa and Himachal Pradesh are among the best performers and the so-called BIMARU states-Bihar, Madhya Pradesh (MP), Rajasthan and Uttar Pradesh (UP)-are laggards. This is hardly surprising. After all, the wonders of Kerala are well documented by Amartya Sen and several others and the demographer Ashish Bose coined the term BIMARU way back in the 1980s to highlight their lower levels of development.</p><p align="justify">How does one get to a more telling and appropriate comparison of states that controls for their inherent differences? How do we put the states on a level playing field? This can be done by controlling for consumption per person. We evaluate how well a state is doing on health, education and infrastructure, given its level of per capita consumption. This allows us to ask more sophisticated questions: is Gujarat doing as good a job with the resources it has at its disposal in contrast to, say, Bihar or Maharashtra? Although per capita gross domestic product (GDP) and consumption broadly measure the same thing and are tightly correlated, consumption has the benefit of reflecting actual purchasing power by including income generated from outside the state (inter-state remittances) and excluding income which gets diverted away from a state (especially for mining states).</p><p align="justify">This levelling exercise yields some interesting insights, (summarized in the accompanying chart that ranks states on performance from left to right, with the height of the bar indicating how much better a state is from the all-India benchmark). There is a clear differentiation among the BIMARU states. The rankings of Orissa, Bihar and Chhattisgarh rise sharply across all the three sectors. Orissa and Bihar, in particular, seem to be doing well by all India standards given their low level of income. MP and UP are below average, especially in health. Jharkhand and Rajasthan seem to be doing pretty poorly on all three fronts.</p><p align="justify">Coastal Kerala and West Bengal are good performers in health and education, though Kerala is, of course, in a higher league. Notably, both the states with their common history of Left rule are performing just about average on infrastructure. Among the hill states, there is a clear divide between the high-ranging Himachal Pradesh as the best in India and a flailing Uttarakhand far behind.</p><p align="justify">While Punjab fares decently on infrastructure, it slips from being a top-tier state in health and education to a medium-ranging one. This is surprising, given the common perception of healthy Punjabis being uncompromising with their food habits. In contrast, the more subdued Tamils seem to be a healthier lot.</p><p align="justify">While the much discussed Gujarat comes out as slightly better than the all-India average on infrastructure, it does not fare too well on education and does poorly on health. Finally, while Maharashtra does well on education, it is quite average on health and quite poor on infrastructure for the wealth it enjoys.</p><p align="justify">We also find a significantly positive relationship between consumption and our three constructed indices, suggesting that in the long run, better development outcomes are indeed associated with high consumption and GDP. However, all of these observations are limited to simple associations rather than causal relationships, which can be more complex to establish.</p><p align="justify"><em>Pranjul Bhandari is an economist headed to the John F. Kennedy School of Government at Harvard University as a Mason Fellow.</em></p>'
$lang = 'English'
$SITE_URL = 'https://im4change.in/'
$site_title = 'im4change'
$adminprix = 'admin'</pre><pre class="stack-trace">include - APP/Template/Layout/printlayout.ctp, line 8
Cake\View\View::_evaluate() - CORE/src/View/View.php, line 1413
Cake\View\View::_render() - CORE/src/View/View.php, line 1374
Cake\View\View::renderLayout() - CORE/src/View/View.php, line 927
Cake\View\View::render() - CORE/src/View/View.php, line 885
Cake\Controller\Controller::render() - CORE/src/Controller/Controller.php, line 791
Cake\Http\ActionDispatcher::_invoke() - CORE/src/Http/ActionDispatcher.php, line 126
Cake\Http\ActionDispatcher::dispatch() - CORE/src/Http/ActionDispatcher.php, line 94
Cake\Http\BaseApplication::__invoke() - CORE/src/Http/BaseApplication.php, line 235
Cake\Http\Runner::__invoke() - CORE/src/Http/Runner.php, line 65
Cake\Routing\Middleware\RoutingMiddleware::__invoke() - CORE/src/Routing/Middleware/RoutingMiddleware.php, line 162
Cake\Http\Runner::__invoke() - CORE/src/Http/Runner.php, line 65
Cake\Routing\Middleware\AssetMiddleware::__invoke() - CORE/src/Routing/Middleware/AssetMiddleware.php, line 88
Cake\Http\Runner::__invoke() - CORE/src/Http/Runner.php, line 65
Cake\Error\Middleware\ErrorHandlerMiddleware::__invoke() - CORE/src/Error/Middleware/ErrorHandlerMiddleware.php, line 96
Cake\Http\Runner::__invoke() - CORE/src/Http/Runner.php, line 65
Cake\Http\Runner::run() - CORE/src/Http/Runner.php, line 51</pre></div></pre>latest-news-updates/a-report-card-for-indias-states-pranjul-bhandari-21220.html"/>
<meta http-equiv="Content-Type" content="text/html; charset=utf-8"/>
<link href="https://im4change.in/css/control.css" rel="stylesheet" type="text/css"
media="all"/>
<title>LATEST NEWS UPDATES | A report card for India’s states -Pranjul Bhandari | Im4change.org</title>
<meta name="description" content="
-Live Mint
Cherry-picked indicators of progress cannot convey the complexities of development in India's diverse states
Which Indian states have fared better than their peers and which ones have done relatively worse is a perennial question for discussion. There is more..."/>
<script src="https://im4change.in/js/jquery-1.10.2.js"></script>
<script type="text/javascript" src="https://im4change.in/js/jquery-migrate.min.js"></script>
<script language="javascript" type="text/javascript">
$(document).ready(function () {
var img = $("img")[0]; // Get my img elem
var pic_real_width, pic_real_height;
$("<img/>") // Make in memory copy of image to avoid css issues
.attr("src", $(img).attr("src"))
.load(function () {
pic_real_width = this.width; // Note: $(this).width() will not
pic_real_height = this.height; // work for in memory images.
});
});
</script>
<style type="text/css">
@media screen {
div.divFooter {
display: block;
}
}
@media print {
.printbutton {
display: none !important;
}
}
</style>
</head>
<body>
<table cellpadding="0" cellspacing="0" border="0" width="98%" align="center">
<tr>
<td class="top_bg">
<div class="divFooter">
<img src="https://im4change.in/images/logo1.jpg" height="59" border="0"
alt="Resource centre on India's rural distress" style="padding-top:14px;"/>
</div>
</td>
</tr>
<tr>
<td id="topspace"> </td>
</tr>
<tr id="topspace">
<td> </td>
</tr>
<tr>
<td height="50" style="border-bottom:1px solid #000; padding-top:10px;" class="printbutton">
<form><input type="button" value=" Print this page "
onclick="window.print();return false;"/></form>
</td>
</tr>
<tr>
<td width="100%">
<h1 class="news_headlines" style="font-style:normal">
<strong>A report card for India’s states -Pranjul Bhandari</strong></h1>
</td>
</tr>
<tr>
<td width="100%" style="font-family:Arial, 'Segoe Script', 'Segoe UI', sans-serif, serif"><font size="3">
<div align="justify">-Live Mint</div><p align="justify"><img src="https://im4change.in/siteadmin/tinymce/uploaded/Growth_1.bmp" alt="Growth" /><br /><em>Cherry-picked indicators of progress cannot convey the complexities of development in India's diverse states </em></p><p align="justify">Which Indian states have fared better than their peers and which ones have done relatively worse is a perennial question for discussion. There is more at stake than mere grading of states here. Investment flows, central government funds and praises for being a good state are all linked to this seemingly straightforward question.</p><p align="justify">It seems to have become fashionable for chief ministers to competitively boast about their performance. Most have a few favourite indicators that they brandish for this purpose. While some highlight the improvement in an indicator over the five odd years of their tenure as proof of good governance, others take a further step and stress how these indicators are better than another state's or even the national average.</p><p align="justify">A few stray indicators and anecdotes, however, cannot form a fair report card. That requires a more comprehensive assessment. It is not very telling for a much prosperous state (for example, Gujarat) to be compared with a less prosperous state (say, Bihar), which may have been disadvantaged for a variety of historical reasons. If states have to be compared in a constructive way, the yardstick for comparison needs to be levelled first. </p><p align="justify">How do we establish a fair and comprehensive basis for comparing the performance of states? How do we judge the authenticity of lofty claims? Here's a different way of looking at it: focus on health, education and infrastructure, which are the biggest development tasks at hand. Rather than depending on a single indicator, several indicators can be bunched together, forming an index for each of the three. For health, both input (for example, immunization) and output (infant mortality rate) variables are used. For education, indicators that reflect both quantity (net enrolment rate), as well as quality (reading level for enrolled children), are used. For infrastructure, indicators across electricity, communication, banking and transportation are bunched up. To keep the comparison impartial, the principal component, a tool for combining the indicators, is employed. The data is ordered such that a higher index value means a better performing state.</p><p align="justify">What do the results show? We find that across health, education and infrastructure, Kerala, Goa and Himachal Pradesh are among the best performers and the so-called BIMARU states-Bihar, Madhya Pradesh (MP), Rajasthan and Uttar Pradesh (UP)-are laggards. This is hardly surprising. After all, the wonders of Kerala are well documented by Amartya Sen and several others and the demographer Ashish Bose coined the term BIMARU way back in the 1980s to highlight their lower levels of development.</p><p align="justify">How does one get to a more telling and appropriate comparison of states that controls for their inherent differences? How do we put the states on a level playing field? This can be done by controlling for consumption per person. We evaluate how well a state is doing on health, education and infrastructure, given its level of per capita consumption. This allows us to ask more sophisticated questions: is Gujarat doing as good a job with the resources it has at its disposal in contrast to, say, Bihar or Maharashtra? Although per capita gross domestic product (GDP) and consumption broadly measure the same thing and are tightly correlated, consumption has the benefit of reflecting actual purchasing power by including income generated from outside the state (inter-state remittances) and excluding income which gets diverted away from a state (especially for mining states).</p><p align="justify">This levelling exercise yields some interesting insights, (summarized in the accompanying chart that ranks states on performance from left to right, with the height of the bar indicating how much better a state is from the all-India benchmark). There is a clear differentiation among the BIMARU states. The rankings of Orissa, Bihar and Chhattisgarh rise sharply across all the three sectors. Orissa and Bihar, in particular, seem to be doing well by all India standards given their low level of income. MP and UP are below average, especially in health. Jharkhand and Rajasthan seem to be doing pretty poorly on all three fronts.</p><p align="justify">Coastal Kerala and West Bengal are good performers in health and education, though Kerala is, of course, in a higher league. Notably, both the states with their common history of Left rule are performing just about average on infrastructure. Among the hill states, there is a clear divide between the high-ranging Himachal Pradesh as the best in India and a flailing Uttarakhand far behind.</p><p align="justify">While Punjab fares decently on infrastructure, it slips from being a top-tier state in health and education to a medium-ranging one. This is surprising, given the common perception of healthy Punjabis being uncompromising with their food habits. In contrast, the more subdued Tamils seem to be a healthier lot.</p><p align="justify">While the much discussed Gujarat comes out as slightly better than the all-India average on infrastructure, it does not fare too well on education and does poorly on health. Finally, while Maharashtra does well on education, it is quite average on health and quite poor on infrastructure for the wealth it enjoys.</p><p align="justify">We also find a significantly positive relationship between consumption and our three constructed indices, suggesting that in the long run, better development outcomes are indeed associated with high consumption and GDP. However, all of these observations are limited to simple associations rather than causal relationships, which can be more complex to establish.</p><p align="justify"><em>Pranjul Bhandari is an economist headed to the John F. Kennedy School of Government at Harvard University as a Mason Fellow.</em></p> </font>
</td>
</tr>
<tr>
<td> </td>
</tr>
<tr>
<td height="50" style="border-top:1px solid #000; border-bottom:1px solid #000;padding-top:10px;">
<form><input type="button" value=" Print this page "
onclick="window.print();return false;"/></form>
</td>
</tr>
</table></body>
</html>'
}
$reasonPhrase = 'OK'
header - [internal], line ??
Cake\Http\ResponseEmitter::emitStatusLine() - CORE/src/Http/ResponseEmitter.php, line 148
Cake\Http\ResponseEmitter::emit() - CORE/src/Http/ResponseEmitter.php, line 54
Cake\Http\Server::emit() - CORE/src/Http/Server.php, line 141
[main] - ROOT/webroot/index.php, line 39
Warning (2): Cannot modify header information - headers already sent by (output started at /home/brlfuser/public_html/vendor/cakephp/cakephp/src/Error/Debugger.php:853) [CORE/src/Http/ResponseEmitter.php, line 181]
$response = object(Cake\Http\Response) {
'status' => (int) 200,
'contentType' => 'text/html',
'headers' => [
'Content-Type' => [
[maximum depth reached]
]
],
'file' => null,
'fileRange' => [],
'cookies' => object(Cake\Http\Cookie\CookieCollection) {},
'cacheDirectives' => [],
'body' => '<!DOCTYPE html PUBLIC "-//W3C//DTD XHTML 1.0 Transitional//EN"
"http://www.w3.org/TR/xhtml1/DTD/xhtml1-transitional.dtd">
<html xmlns="http://www.w3.org/1999/xhtml">
<head>
<link rel="canonical" href="https://im4change.in/<pre class="cake-error"><a href="javascript:void(0);" onclick="document.getElementById('cakeErr67feb98dae9a9-trace').style.display = (document.getElementById('cakeErr67feb98dae9a9-trace').style.display == 'none' ? '' : 'none');"><b>Notice</b> (8)</a>: Undefined variable: urlPrefix [<b>APP/Template/Layout/printlayout.ctp</b>, line <b>8</b>]<div id="cakeErr67feb98dae9a9-trace" class="cake-stack-trace" style="display: none;"><a href="javascript:void(0);" onclick="document.getElementById('cakeErr67feb98dae9a9-code').style.display = (document.getElementById('cakeErr67feb98dae9a9-code').style.display == 'none' ? '' : 'none')">Code</a> <a href="javascript:void(0);" onclick="document.getElementById('cakeErr67feb98dae9a9-context').style.display = (document.getElementById('cakeErr67feb98dae9a9-context').style.display == 'none' ? '' : 'none')">Context</a><pre id="cakeErr67feb98dae9a9-code" class="cake-code-dump" style="display: none;"><code><span style="color: #000000"><span style="color: #0000BB"></span><span style="color: #007700"><</span><span style="color: #0000BB">head</span><span style="color: #007700">>
</span></span></code>
<span class="code-highlight"><code><span style="color: #000000"> <link rel="canonical" href="<span style="color: #0000BB"><?php </span><span style="color: #007700">echo </span><span style="color: #0000BB">Configure</span><span style="color: #007700">::</span><span style="color: #0000BB">read</span><span style="color: #007700">(</span><span style="color: #DD0000">'SITE_URL'</span><span style="color: #007700">); </span><span style="color: #0000BB">?><?php </span><span style="color: #007700">echo </span><span style="color: #0000BB">$urlPrefix</span><span style="color: #007700">;</span><span style="color: #0000BB">?><?php </span><span style="color: #007700">echo </span><span style="color: #0000BB">$article_current</span><span style="color: #007700">-></span><span style="color: #0000BB">category</span><span style="color: #007700">-></span><span style="color: #0000BB">slug</span><span style="color: #007700">; </span><span style="color: #0000BB">?></span>/<span style="color: #0000BB"><?php </span><span style="color: #007700">echo </span><span style="color: #0000BB">$article_current</span><span style="color: #007700">-></span><span style="color: #0000BB">seo_url</span><span style="color: #007700">; </span><span style="color: #0000BB">?></span>.html"/>
</span></code></span>
<code><span style="color: #000000"><span style="color: #0000BB"> </span><span style="color: #007700"><</span><span style="color: #0000BB">meta http</span><span style="color: #007700">-</span><span style="color: #0000BB">equiv</span><span style="color: #007700">=</span><span style="color: #DD0000">"Content-Type" </span><span style="color: #0000BB">content</span><span style="color: #007700">=</span><span style="color: #DD0000">"text/html; charset=utf-8"</span><span style="color: #007700">/>
</span></span></code></pre><pre id="cakeErr67feb98dae9a9-context" class="cake-context" style="display: none;">$viewFile = '/home/brlfuser/public_html/src/Template/Layout/printlayout.ctp'
$dataForView = [
'article_current' => object(App\Model\Entity\Article) {
'id' => (int) 21075,
'title' => 'A report card for India’s states -Pranjul Bhandari',
'subheading' => '',
'description' => '<div align="justify">
-Live Mint
</div>
<p align="justify">
<img src="tinymce/uploaded/Growth_1.bmp" alt="Growth" /><br />
<em>Cherry-picked indicators of progress cannot convey the complexities of development in India's diverse states </em>
</p>
<p align="justify">
Which Indian states have fared better than their peers and which ones have done relatively worse is a perennial question for discussion. There is more at stake than mere grading of states here. Investment flows, central government funds and praises for being a good state are all linked to this seemingly straightforward question.
</p>
<p align="justify">
It seems to have become fashionable for chief ministers to competitively boast about their performance. Most have a few favourite indicators that they brandish for this purpose. While some highlight the improvement in an indicator over the five odd years of their tenure as proof of good governance, others take a further step and stress how these indicators are better than another state's or even the national average.
</p>
<p align="justify">
A few stray indicators and anecdotes, however, cannot form a fair report card. That requires a more comprehensive assessment. It is not very telling for a much prosperous state (for example, Gujarat) to be compared with a less prosperous state (say, Bihar), which may have been disadvantaged for a variety of historical reasons. If states have to be compared in a constructive way, the yardstick for comparison needs to be levelled first.
</p>
<p align="justify">
How do we establish a fair and comprehensive basis for comparing the performance of states? How do we judge the authenticity of lofty claims? Here's a different way of looking at it: focus on health, education and infrastructure, which are the biggest development tasks at hand. Rather than depending on a single indicator, several indicators can be bunched together, forming an index for each of the three. For health, both input (for example, immunization) and output (infant mortality rate) variables are used. For education, indicators that reflect both quantity (net enrolment rate), as well as quality (reading level for enrolled children), are used. For infrastructure, indicators across electricity, communication, banking and transportation are bunched up. To keep the comparison impartial, the principal component, a tool for combining the indicators, is employed. The data is ordered such that a higher index value means a better performing state.
</p>
<p align="justify">
What do the results show? We find that across health, education and infrastructure, Kerala, Goa and Himachal Pradesh are among the best performers and the so-called BIMARU states-Bihar, Madhya Pradesh (MP), Rajasthan and Uttar Pradesh (UP)-are laggards. This is hardly surprising. After all, the wonders of Kerala are well documented by Amartya Sen and several others and the demographer Ashish Bose coined the term BIMARU way back in the 1980s to highlight their lower levels of development.
</p>
<p align="justify">
How does one get to a more telling and appropriate comparison of states that controls for their inherent differences? How do we put the states on a level playing field? This can be done by controlling for consumption per person. We evaluate how well a state is doing on health, education and infrastructure, given its level of per capita consumption. This allows us to ask more sophisticated questions: is Gujarat doing as good a job with the resources it has at its disposal in contrast to, say, Bihar or Maharashtra? Although per capita gross domestic product (GDP) and consumption broadly measure the same thing and are tightly correlated, consumption has the benefit of reflecting actual purchasing power by including income generated from outside the state (inter-state remittances) and excluding income which gets diverted away from a state (especially for mining states).
</p>
<p align="justify">
This levelling exercise yields some interesting insights, (summarized in the accompanying chart that ranks states on performance from left to right, with the height of the bar indicating how much better a state is from the all-India benchmark). There is a clear differentiation among the BIMARU states. The rankings of Orissa, Bihar and Chhattisgarh rise sharply across all the three sectors. Orissa and Bihar, in particular, seem to be doing well by all India standards given their low level of income. MP and UP are below average, especially in health. Jharkhand and Rajasthan seem to be doing pretty poorly on all three fronts.
</p>
<p align="justify">
Coastal Kerala and West Bengal are good performers in health and education, though Kerala is, of course, in a higher league. Notably, both the states with their common history of Left rule are performing just about average on infrastructure. Among the hill states, there is a clear divide between the high-ranging Himachal Pradesh as the best in India and a flailing Uttarakhand far behind.
</p>
<p align="justify">
While Punjab fares decently on infrastructure, it slips from being a top-tier state in health and education to a medium-ranging one. This is surprising, given the common perception of healthy Punjabis being uncompromising with their food habits. In contrast, the more subdued Tamils seem to be a healthier lot.
</p>
<p align="justify">
While the much discussed Gujarat comes out as slightly better than the all-India average on infrastructure, it does not fare too well on education and does poorly on health. Finally, while Maharashtra does well on education, it is quite average on health and quite poor on infrastructure for the wealth it enjoys.
</p>
<p align="justify">
We also find a significantly positive relationship between consumption and our three constructed indices, suggesting that in the long run, better development outcomes are indeed associated with high consumption and GDP. However, all of these observations are limited to simple associations rather than causal relationships, which can be more complex to establish.
</p>
<p align="justify">
<em>Pranjul Bhandari is an economist headed to the John F. Kennedy School of Government at Harvard University as a Mason Fellow.</em>
</p>',
'credit_writer' => 'Live Mint, 20 May, 2013, http://www.livemint.com/Opinion/VCyAxbnkhyA47bXE9Z9wfM/A-report-card-for-Indias-states.html',
'article_img' => '',
'article_img_thumb' => '',
'status' => (int) 1,
'show_on_home' => (int) 1,
'lang' => 'EN',
'category_id' => (int) 16,
'tag_keyword' => '',
'seo_url' => 'a-report-card-for-indias-states-pranjul-bhandari-21220',
'meta_title' => null,
'meta_keywords' => null,
'meta_description' => null,
'noindex' => (int) 0,
'publish_date' => object(Cake\I18n\FrozenDate) {},
'most_visit_section_id' => null,
'article_big_img' => null,
'liveid' => (int) 21220,
'created' => object(Cake\I18n\FrozenTime) {},
'modified' => object(Cake\I18n\FrozenTime) {},
'edate' => '',
'tags' => [
[maximum depth reached]
],
'category' => object(App\Model\Entity\Category) {},
'[new]' => false,
'[accessible]' => [
[maximum depth reached]
],
'[dirty]' => [[maximum depth reached]],
'[original]' => [[maximum depth reached]],
'[virtual]' => [[maximum depth reached]],
'[hasErrors]' => false,
'[errors]' => [[maximum depth reached]],
'[invalid]' => [[maximum depth reached]],
'[repository]' => 'Articles'
},
'articleid' => (int) 21075,
'metaTitle' => 'LATEST NEWS UPDATES | A report card for India’s states -Pranjul Bhandari',
'metaKeywords' => 'Human Development,Health,education,economy,Growth',
'metaDesc' => '
-Live Mint
Cherry-picked indicators of progress cannot convey the complexities of development in India's diverse states
Which Indian states have fared better than their peers and which ones have done relatively worse is a perennial question for discussion. There is more...',
'disp' => '<div align="justify">-Live Mint</div><p align="justify"><img src="https://im4change.in/siteadmin/tinymce/uploaded/Growth_1.bmp" alt="Growth" /><br /><em>Cherry-picked indicators of progress cannot convey the complexities of development in India's diverse states </em></p><p align="justify">Which Indian states have fared better than their peers and which ones have done relatively worse is a perennial question for discussion. There is more at stake than mere grading of states here. Investment flows, central government funds and praises for being a good state are all linked to this seemingly straightforward question.</p><p align="justify">It seems to have become fashionable for chief ministers to competitively boast about their performance. Most have a few favourite indicators that they brandish for this purpose. While some highlight the improvement in an indicator over the five odd years of their tenure as proof of good governance, others take a further step and stress how these indicators are better than another state's or even the national average.</p><p align="justify">A few stray indicators and anecdotes, however, cannot form a fair report card. That requires a more comprehensive assessment. It is not very telling for a much prosperous state (for example, Gujarat) to be compared with a less prosperous state (say, Bihar), which may have been disadvantaged for a variety of historical reasons. If states have to be compared in a constructive way, the yardstick for comparison needs to be levelled first. </p><p align="justify">How do we establish a fair and comprehensive basis for comparing the performance of states? How do we judge the authenticity of lofty claims? Here's a different way of looking at it: focus on health, education and infrastructure, which are the biggest development tasks at hand. Rather than depending on a single indicator, several indicators can be bunched together, forming an index for each of the three. For health, both input (for example, immunization) and output (infant mortality rate) variables are used. For education, indicators that reflect both quantity (net enrolment rate), as well as quality (reading level for enrolled children), are used. For infrastructure, indicators across electricity, communication, banking and transportation are bunched up. To keep the comparison impartial, the principal component, a tool for combining the indicators, is employed. The data is ordered such that a higher index value means a better performing state.</p><p align="justify">What do the results show? We find that across health, education and infrastructure, Kerala, Goa and Himachal Pradesh are among the best performers and the so-called BIMARU states-Bihar, Madhya Pradesh (MP), Rajasthan and Uttar Pradesh (UP)-are laggards. This is hardly surprising. After all, the wonders of Kerala are well documented by Amartya Sen and several others and the demographer Ashish Bose coined the term BIMARU way back in the 1980s to highlight their lower levels of development.</p><p align="justify">How does one get to a more telling and appropriate comparison of states that controls for their inherent differences? How do we put the states on a level playing field? This can be done by controlling for consumption per person. We evaluate how well a state is doing on health, education and infrastructure, given its level of per capita consumption. This allows us to ask more sophisticated questions: is Gujarat doing as good a job with the resources it has at its disposal in contrast to, say, Bihar or Maharashtra? Although per capita gross domestic product (GDP) and consumption broadly measure the same thing and are tightly correlated, consumption has the benefit of reflecting actual purchasing power by including income generated from outside the state (inter-state remittances) and excluding income which gets diverted away from a state (especially for mining states).</p><p align="justify">This levelling exercise yields some interesting insights, (summarized in the accompanying chart that ranks states on performance from left to right, with the height of the bar indicating how much better a state is from the all-India benchmark). There is a clear differentiation among the BIMARU states. The rankings of Orissa, Bihar and Chhattisgarh rise sharply across all the three sectors. Orissa and Bihar, in particular, seem to be doing well by all India standards given their low level of income. MP and UP are below average, especially in health. Jharkhand and Rajasthan seem to be doing pretty poorly on all three fronts.</p><p align="justify">Coastal Kerala and West Bengal are good performers in health and education, though Kerala is, of course, in a higher league. Notably, both the states with their common history of Left rule are performing just about average on infrastructure. Among the hill states, there is a clear divide between the high-ranging Himachal Pradesh as the best in India and a flailing Uttarakhand far behind.</p><p align="justify">While Punjab fares decently on infrastructure, it slips from being a top-tier state in health and education to a medium-ranging one. This is surprising, given the common perception of healthy Punjabis being uncompromising with their food habits. In contrast, the more subdued Tamils seem to be a healthier lot.</p><p align="justify">While the much discussed Gujarat comes out as slightly better than the all-India average on infrastructure, it does not fare too well on education and does poorly on health. Finally, while Maharashtra does well on education, it is quite average on health and quite poor on infrastructure for the wealth it enjoys.</p><p align="justify">We also find a significantly positive relationship between consumption and our three constructed indices, suggesting that in the long run, better development outcomes are indeed associated with high consumption and GDP. However, all of these observations are limited to simple associations rather than causal relationships, which can be more complex to establish.</p><p align="justify"><em>Pranjul Bhandari is an economist headed to the John F. Kennedy School of Government at Harvard University as a Mason Fellow.</em></p>',
'lang' => 'English',
'SITE_URL' => 'https://im4change.in/',
'site_title' => 'im4change',
'adminprix' => 'admin'
]
$article_current = object(App\Model\Entity\Article) {
'id' => (int) 21075,
'title' => 'A report card for India’s states -Pranjul Bhandari',
'subheading' => '',
'description' => '<div align="justify">
-Live Mint
</div>
<p align="justify">
<img src="tinymce/uploaded/Growth_1.bmp" alt="Growth" /><br />
<em>Cherry-picked indicators of progress cannot convey the complexities of development in India's diverse states </em>
</p>
<p align="justify">
Which Indian states have fared better than their peers and which ones have done relatively worse is a perennial question for discussion. There is more at stake than mere grading of states here. Investment flows, central government funds and praises for being a good state are all linked to this seemingly straightforward question.
</p>
<p align="justify">
It seems to have become fashionable for chief ministers to competitively boast about their performance. Most have a few favourite indicators that they brandish for this purpose. While some highlight the improvement in an indicator over the five odd years of their tenure as proof of good governance, others take a further step and stress how these indicators are better than another state's or even the national average.
</p>
<p align="justify">
A few stray indicators and anecdotes, however, cannot form a fair report card. That requires a more comprehensive assessment. It is not very telling for a much prosperous state (for example, Gujarat) to be compared with a less prosperous state (say, Bihar), which may have been disadvantaged for a variety of historical reasons. If states have to be compared in a constructive way, the yardstick for comparison needs to be levelled first.
</p>
<p align="justify">
How do we establish a fair and comprehensive basis for comparing the performance of states? How do we judge the authenticity of lofty claims? Here's a different way of looking at it: focus on health, education and infrastructure, which are the biggest development tasks at hand. Rather than depending on a single indicator, several indicators can be bunched together, forming an index for each of the three. For health, both input (for example, immunization) and output (infant mortality rate) variables are used. For education, indicators that reflect both quantity (net enrolment rate), as well as quality (reading level for enrolled children), are used. For infrastructure, indicators across electricity, communication, banking and transportation are bunched up. To keep the comparison impartial, the principal component, a tool for combining the indicators, is employed. The data is ordered such that a higher index value means a better performing state.
</p>
<p align="justify">
What do the results show? We find that across health, education and infrastructure, Kerala, Goa and Himachal Pradesh are among the best performers and the so-called BIMARU states-Bihar, Madhya Pradesh (MP), Rajasthan and Uttar Pradesh (UP)-are laggards. This is hardly surprising. After all, the wonders of Kerala are well documented by Amartya Sen and several others and the demographer Ashish Bose coined the term BIMARU way back in the 1980s to highlight their lower levels of development.
</p>
<p align="justify">
How does one get to a more telling and appropriate comparison of states that controls for their inherent differences? How do we put the states on a level playing field? This can be done by controlling for consumption per person. We evaluate how well a state is doing on health, education and infrastructure, given its level of per capita consumption. This allows us to ask more sophisticated questions: is Gujarat doing as good a job with the resources it has at its disposal in contrast to, say, Bihar or Maharashtra? Although per capita gross domestic product (GDP) and consumption broadly measure the same thing and are tightly correlated, consumption has the benefit of reflecting actual purchasing power by including income generated from outside the state (inter-state remittances) and excluding income which gets diverted away from a state (especially for mining states).
</p>
<p align="justify">
This levelling exercise yields some interesting insights, (summarized in the accompanying chart that ranks states on performance from left to right, with the height of the bar indicating how much better a state is from the all-India benchmark). There is a clear differentiation among the BIMARU states. The rankings of Orissa, Bihar and Chhattisgarh rise sharply across all the three sectors. Orissa and Bihar, in particular, seem to be doing well by all India standards given their low level of income. MP and UP are below average, especially in health. Jharkhand and Rajasthan seem to be doing pretty poorly on all three fronts.
</p>
<p align="justify">
Coastal Kerala and West Bengal are good performers in health and education, though Kerala is, of course, in a higher league. Notably, both the states with their common history of Left rule are performing just about average on infrastructure. Among the hill states, there is a clear divide between the high-ranging Himachal Pradesh as the best in India and a flailing Uttarakhand far behind.
</p>
<p align="justify">
While Punjab fares decently on infrastructure, it slips from being a top-tier state in health and education to a medium-ranging one. This is surprising, given the common perception of healthy Punjabis being uncompromising with their food habits. In contrast, the more subdued Tamils seem to be a healthier lot.
</p>
<p align="justify">
While the much discussed Gujarat comes out as slightly better than the all-India average on infrastructure, it does not fare too well on education and does poorly on health. Finally, while Maharashtra does well on education, it is quite average on health and quite poor on infrastructure for the wealth it enjoys.
</p>
<p align="justify">
We also find a significantly positive relationship between consumption and our three constructed indices, suggesting that in the long run, better development outcomes are indeed associated with high consumption and GDP. However, all of these observations are limited to simple associations rather than causal relationships, which can be more complex to establish.
</p>
<p align="justify">
<em>Pranjul Bhandari is an economist headed to the John F. Kennedy School of Government at Harvard University as a Mason Fellow.</em>
</p>',
'credit_writer' => 'Live Mint, 20 May, 2013, http://www.livemint.com/Opinion/VCyAxbnkhyA47bXE9Z9wfM/A-report-card-for-Indias-states.html',
'article_img' => '',
'article_img_thumb' => '',
'status' => (int) 1,
'show_on_home' => (int) 1,
'lang' => 'EN',
'category_id' => (int) 16,
'tag_keyword' => '',
'seo_url' => 'a-report-card-for-indias-states-pranjul-bhandari-21220',
'meta_title' => null,
'meta_keywords' => null,
'meta_description' => null,
'noindex' => (int) 0,
'publish_date' => object(Cake\I18n\FrozenDate) {},
'most_visit_section_id' => null,
'article_big_img' => null,
'liveid' => (int) 21220,
'created' => object(Cake\I18n\FrozenTime) {},
'modified' => object(Cake\I18n\FrozenTime) {},
'edate' => '',
'tags' => [
(int) 0 => object(Cake\ORM\Entity) {},
(int) 1 => object(Cake\ORM\Entity) {},
(int) 2 => object(Cake\ORM\Entity) {},
(int) 3 => object(Cake\ORM\Entity) {},
(int) 4 => object(Cake\ORM\Entity) {}
],
'category' => object(App\Model\Entity\Category) {},
'[new]' => false,
'[accessible]' => [
'*' => true,
'id' => false
],
'[dirty]' => [],
'[original]' => [],
'[virtual]' => [],
'[hasErrors]' => false,
'[errors]' => [],
'[invalid]' => [],
'[repository]' => 'Articles'
}
$articleid = (int) 21075
$metaTitle = 'LATEST NEWS UPDATES | A report card for India’s states -Pranjul Bhandari'
$metaKeywords = 'Human Development,Health,education,economy,Growth'
$metaDesc = '
-Live Mint
Cherry-picked indicators of progress cannot convey the complexities of development in India's diverse states
Which Indian states have fared better than their peers and which ones have done relatively worse is a perennial question for discussion. There is more...'
$disp = '<div align="justify">-Live Mint</div><p align="justify"><img src="https://im4change.in/siteadmin/tinymce/uploaded/Growth_1.bmp" alt="Growth" /><br /><em>Cherry-picked indicators of progress cannot convey the complexities of development in India's diverse states </em></p><p align="justify">Which Indian states have fared better than their peers and which ones have done relatively worse is a perennial question for discussion. There is more at stake than mere grading of states here. Investment flows, central government funds and praises for being a good state are all linked to this seemingly straightforward question.</p><p align="justify">It seems to have become fashionable for chief ministers to competitively boast about their performance. Most have a few favourite indicators that they brandish for this purpose. While some highlight the improvement in an indicator over the five odd years of their tenure as proof of good governance, others take a further step and stress how these indicators are better than another state's or even the national average.</p><p align="justify">A few stray indicators and anecdotes, however, cannot form a fair report card. That requires a more comprehensive assessment. It is not very telling for a much prosperous state (for example, Gujarat) to be compared with a less prosperous state (say, Bihar), which may have been disadvantaged for a variety of historical reasons. If states have to be compared in a constructive way, the yardstick for comparison needs to be levelled first. </p><p align="justify">How do we establish a fair and comprehensive basis for comparing the performance of states? How do we judge the authenticity of lofty claims? Here's a different way of looking at it: focus on health, education and infrastructure, which are the biggest development tasks at hand. Rather than depending on a single indicator, several indicators can be bunched together, forming an index for each of the three. For health, both input (for example, immunization) and output (infant mortality rate) variables are used. For education, indicators that reflect both quantity (net enrolment rate), as well as quality (reading level for enrolled children), are used. For infrastructure, indicators across electricity, communication, banking and transportation are bunched up. To keep the comparison impartial, the principal component, a tool for combining the indicators, is employed. The data is ordered such that a higher index value means a better performing state.</p><p align="justify">What do the results show? We find that across health, education and infrastructure, Kerala, Goa and Himachal Pradesh are among the best performers and the so-called BIMARU states-Bihar, Madhya Pradesh (MP), Rajasthan and Uttar Pradesh (UP)-are laggards. This is hardly surprising. After all, the wonders of Kerala are well documented by Amartya Sen and several others and the demographer Ashish Bose coined the term BIMARU way back in the 1980s to highlight their lower levels of development.</p><p align="justify">How does one get to a more telling and appropriate comparison of states that controls for their inherent differences? How do we put the states on a level playing field? This can be done by controlling for consumption per person. We evaluate how well a state is doing on health, education and infrastructure, given its level of per capita consumption. This allows us to ask more sophisticated questions: is Gujarat doing as good a job with the resources it has at its disposal in contrast to, say, Bihar or Maharashtra? Although per capita gross domestic product (GDP) and consumption broadly measure the same thing and are tightly correlated, consumption has the benefit of reflecting actual purchasing power by including income generated from outside the state (inter-state remittances) and excluding income which gets diverted away from a state (especially for mining states).</p><p align="justify">This levelling exercise yields some interesting insights, (summarized in the accompanying chart that ranks states on performance from left to right, with the height of the bar indicating how much better a state is from the all-India benchmark). There is a clear differentiation among the BIMARU states. The rankings of Orissa, Bihar and Chhattisgarh rise sharply across all the three sectors. Orissa and Bihar, in particular, seem to be doing well by all India standards given their low level of income. MP and UP are below average, especially in health. Jharkhand and Rajasthan seem to be doing pretty poorly on all three fronts.</p><p align="justify">Coastal Kerala and West Bengal are good performers in health and education, though Kerala is, of course, in a higher league. Notably, both the states with their common history of Left rule are performing just about average on infrastructure. Among the hill states, there is a clear divide between the high-ranging Himachal Pradesh as the best in India and a flailing Uttarakhand far behind.</p><p align="justify">While Punjab fares decently on infrastructure, it slips from being a top-tier state in health and education to a medium-ranging one. This is surprising, given the common perception of healthy Punjabis being uncompromising with their food habits. In contrast, the more subdued Tamils seem to be a healthier lot.</p><p align="justify">While the much discussed Gujarat comes out as slightly better than the all-India average on infrastructure, it does not fare too well on education and does poorly on health. Finally, while Maharashtra does well on education, it is quite average on health and quite poor on infrastructure for the wealth it enjoys.</p><p align="justify">We also find a significantly positive relationship between consumption and our three constructed indices, suggesting that in the long run, better development outcomes are indeed associated with high consumption and GDP. However, all of these observations are limited to simple associations rather than causal relationships, which can be more complex to establish.</p><p align="justify"><em>Pranjul Bhandari is an economist headed to the John F. Kennedy School of Government at Harvard University as a Mason Fellow.</em></p>'
$lang = 'English'
$SITE_URL = 'https://im4change.in/'
$site_title = 'im4change'
$adminprix = 'admin'</pre><pre class="stack-trace">include - APP/Template/Layout/printlayout.ctp, line 8
Cake\View\View::_evaluate() - CORE/src/View/View.php, line 1413
Cake\View\View::_render() - CORE/src/View/View.php, line 1374
Cake\View\View::renderLayout() - CORE/src/View/View.php, line 927
Cake\View\View::render() - CORE/src/View/View.php, line 885
Cake\Controller\Controller::render() - CORE/src/Controller/Controller.php, line 791
Cake\Http\ActionDispatcher::_invoke() - CORE/src/Http/ActionDispatcher.php, line 126
Cake\Http\ActionDispatcher::dispatch() - CORE/src/Http/ActionDispatcher.php, line 94
Cake\Http\BaseApplication::__invoke() - CORE/src/Http/BaseApplication.php, line 235
Cake\Http\Runner::__invoke() - CORE/src/Http/Runner.php, line 65
Cake\Routing\Middleware\RoutingMiddleware::__invoke() - CORE/src/Routing/Middleware/RoutingMiddleware.php, line 162
Cake\Http\Runner::__invoke() - CORE/src/Http/Runner.php, line 65
Cake\Routing\Middleware\AssetMiddleware::__invoke() - CORE/src/Routing/Middleware/AssetMiddleware.php, line 88
Cake\Http\Runner::__invoke() - CORE/src/Http/Runner.php, line 65
Cake\Error\Middleware\ErrorHandlerMiddleware::__invoke() - CORE/src/Error/Middleware/ErrorHandlerMiddleware.php, line 96
Cake\Http\Runner::__invoke() - CORE/src/Http/Runner.php, line 65
Cake\Http\Runner::run() - CORE/src/Http/Runner.php, line 51</pre></div></pre>latest-news-updates/a-report-card-for-indias-states-pranjul-bhandari-21220.html"/>
<meta http-equiv="Content-Type" content="text/html; charset=utf-8"/>
<link href="https://im4change.in/css/control.css" rel="stylesheet" type="text/css"
media="all"/>
<title>LATEST NEWS UPDATES | A report card for India’s states -Pranjul Bhandari | Im4change.org</title>
<meta name="description" content="
-Live Mint
Cherry-picked indicators of progress cannot convey the complexities of development in India's diverse states
Which Indian states have fared better than their peers and which ones have done relatively worse is a perennial question for discussion. There is more..."/>
<script src="https://im4change.in/js/jquery-1.10.2.js"></script>
<script type="text/javascript" src="https://im4change.in/js/jquery-migrate.min.js"></script>
<script language="javascript" type="text/javascript">
$(document).ready(function () {
var img = $("img")[0]; // Get my img elem
var pic_real_width, pic_real_height;
$("<img/>") // Make in memory copy of image to avoid css issues
.attr("src", $(img).attr("src"))
.load(function () {
pic_real_width = this.width; // Note: $(this).width() will not
pic_real_height = this.height; // work for in memory images.
});
});
</script>
<style type="text/css">
@media screen {
div.divFooter {
display: block;
}
}
@media print {
.printbutton {
display: none !important;
}
}
</style>
</head>
<body>
<table cellpadding="0" cellspacing="0" border="0" width="98%" align="center">
<tr>
<td class="top_bg">
<div class="divFooter">
<img src="https://im4change.in/images/logo1.jpg" height="59" border="0"
alt="Resource centre on India's rural distress" style="padding-top:14px;"/>
</div>
</td>
</tr>
<tr>
<td id="topspace"> </td>
</tr>
<tr id="topspace">
<td> </td>
</tr>
<tr>
<td height="50" style="border-bottom:1px solid #000; padding-top:10px;" class="printbutton">
<form><input type="button" value=" Print this page "
onclick="window.print();return false;"/></form>
</td>
</tr>
<tr>
<td width="100%">
<h1 class="news_headlines" style="font-style:normal">
<strong>A report card for India’s states -Pranjul Bhandari</strong></h1>
</td>
</tr>
<tr>
<td width="100%" style="font-family:Arial, 'Segoe Script', 'Segoe UI', sans-serif, serif"><font size="3">
<div align="justify">-Live Mint</div><p align="justify"><img src="https://im4change.in/siteadmin/tinymce/uploaded/Growth_1.bmp" alt="Growth" /><br /><em>Cherry-picked indicators of progress cannot convey the complexities of development in India's diverse states </em></p><p align="justify">Which Indian states have fared better than their peers and which ones have done relatively worse is a perennial question for discussion. There is more at stake than mere grading of states here. Investment flows, central government funds and praises for being a good state are all linked to this seemingly straightforward question.</p><p align="justify">It seems to have become fashionable for chief ministers to competitively boast about their performance. Most have a few favourite indicators that they brandish for this purpose. While some highlight the improvement in an indicator over the five odd years of their tenure as proof of good governance, others take a further step and stress how these indicators are better than another state's or even the national average.</p><p align="justify">A few stray indicators and anecdotes, however, cannot form a fair report card. That requires a more comprehensive assessment. It is not very telling for a much prosperous state (for example, Gujarat) to be compared with a less prosperous state (say, Bihar), which may have been disadvantaged for a variety of historical reasons. If states have to be compared in a constructive way, the yardstick for comparison needs to be levelled first. </p><p align="justify">How do we establish a fair and comprehensive basis for comparing the performance of states? How do we judge the authenticity of lofty claims? Here's a different way of looking at it: focus on health, education and infrastructure, which are the biggest development tasks at hand. Rather than depending on a single indicator, several indicators can be bunched together, forming an index for each of the three. For health, both input (for example, immunization) and output (infant mortality rate) variables are used. For education, indicators that reflect both quantity (net enrolment rate), as well as quality (reading level for enrolled children), are used. For infrastructure, indicators across electricity, communication, banking and transportation are bunched up. To keep the comparison impartial, the principal component, a tool for combining the indicators, is employed. The data is ordered such that a higher index value means a better performing state.</p><p align="justify">What do the results show? We find that across health, education and infrastructure, Kerala, Goa and Himachal Pradesh are among the best performers and the so-called BIMARU states-Bihar, Madhya Pradesh (MP), Rajasthan and Uttar Pradesh (UP)-are laggards. This is hardly surprising. After all, the wonders of Kerala are well documented by Amartya Sen and several others and the demographer Ashish Bose coined the term BIMARU way back in the 1980s to highlight their lower levels of development.</p><p align="justify">How does one get to a more telling and appropriate comparison of states that controls for their inherent differences? How do we put the states on a level playing field? This can be done by controlling for consumption per person. We evaluate how well a state is doing on health, education and infrastructure, given its level of per capita consumption. This allows us to ask more sophisticated questions: is Gujarat doing as good a job with the resources it has at its disposal in contrast to, say, Bihar or Maharashtra? Although per capita gross domestic product (GDP) and consumption broadly measure the same thing and are tightly correlated, consumption has the benefit of reflecting actual purchasing power by including income generated from outside the state (inter-state remittances) and excluding income which gets diverted away from a state (especially for mining states).</p><p align="justify">This levelling exercise yields some interesting insights, (summarized in the accompanying chart that ranks states on performance from left to right, with the height of the bar indicating how much better a state is from the all-India benchmark). There is a clear differentiation among the BIMARU states. The rankings of Orissa, Bihar and Chhattisgarh rise sharply across all the three sectors. Orissa and Bihar, in particular, seem to be doing well by all India standards given their low level of income. MP and UP are below average, especially in health. Jharkhand and Rajasthan seem to be doing pretty poorly on all three fronts.</p><p align="justify">Coastal Kerala and West Bengal are good performers in health and education, though Kerala is, of course, in a higher league. Notably, both the states with their common history of Left rule are performing just about average on infrastructure. Among the hill states, there is a clear divide between the high-ranging Himachal Pradesh as the best in India and a flailing Uttarakhand far behind.</p><p align="justify">While Punjab fares decently on infrastructure, it slips from being a top-tier state in health and education to a medium-ranging one. This is surprising, given the common perception of healthy Punjabis being uncompromising with their food habits. In contrast, the more subdued Tamils seem to be a healthier lot.</p><p align="justify">While the much discussed Gujarat comes out as slightly better than the all-India average on infrastructure, it does not fare too well on education and does poorly on health. Finally, while Maharashtra does well on education, it is quite average on health and quite poor on infrastructure for the wealth it enjoys.</p><p align="justify">We also find a significantly positive relationship between consumption and our three constructed indices, suggesting that in the long run, better development outcomes are indeed associated with high consumption and GDP. However, all of these observations are limited to simple associations rather than causal relationships, which can be more complex to establish.</p><p align="justify"><em>Pranjul Bhandari is an economist headed to the John F. Kennedy School of Government at Harvard University as a Mason Fellow.</em></p> </font>
</td>
</tr>
<tr>
<td> </td>
</tr>
<tr>
<td height="50" style="border-top:1px solid #000; border-bottom:1px solid #000;padding-top:10px;">
<form><input type="button" value=" Print this page "
onclick="window.print();return false;"/></form>
</td>
</tr>
</table></body>
</html>'
}
$cookies = []
$values = [
(int) 0 => 'text/html; charset=UTF-8'
]
$name = 'Content-Type'
$first = true
$value = 'text/html; charset=UTF-8'
header - [internal], line ??
Cake\Http\ResponseEmitter::emitHeaders() - CORE/src/Http/ResponseEmitter.php, line 181
Cake\Http\ResponseEmitter::emit() - CORE/src/Http/ResponseEmitter.php, line 55
Cake\Http\Server::emit() - CORE/src/Http/Server.php, line 141
[main] - ROOT/webroot/index.php, line 39
Notice (8): Undefined variable: urlPrefix [APP/Template/Layout/printlayout.ctp, line 8]
$viewFile = '/home/brlfuser/public_html/src/Template/Layout/printlayout.ctp'
$dataForView = [
	'article_current' => object(App\Model\Entity\Article) {

		'id' => (int) 21075,
		'title' => 'A report card for India’s states -Pranjul Bhandari',
		'subheading' => '',
		'description' => '<div align="justify">
-Live Mint
</div>
<p align="justify">
<img src="tinymce/uploaded/Growth_1.bmp" alt="Growth" /><br />
<em>Cherry-picked indicators of progress cannot convey the complexities of development in India's diverse states </em>
</p>
<p align="justify">
Which Indian states have fared better than their peers and which ones have done relatively worse is a perennial question for discussion. There is more at stake than mere grading of states here. Investment flows, central government funds and praises for being a good state are all linked to this seemingly straightforward question.
</p>
<p align="justify">
It seems to have become fashionable for chief ministers to competitively boast about their performance. Most have a few favourite indicators that they brandish for this purpose. While some highlight the improvement in an indicator over the five odd years of their tenure as proof of good governance, others take a further step and stress how these indicators are better than another state's or even the national average.
</p>
<p align="justify">
A few stray indicators and anecdotes, however, cannot form a fair report card. That requires a more comprehensive assessment. It is not very telling for a much prosperous state (for example, Gujarat) to be compared with a less prosperous state (say, Bihar), which may have been disadvantaged for a variety of historical reasons. If states have to be compared in a constructive way, the yardstick for comparison needs to be levelled first.
</p>
<p align="justify">
How do we establish a fair and comprehensive basis for comparing the performance of states? How do we judge the authenticity of lofty claims? Here's a different way of looking at it: focus on health, education and infrastructure, which are the biggest development tasks at hand. Rather than depending on a single indicator, several indicators can be bunched together, forming an index for each of the three. For health, both input (for example, immunization) and output (infant mortality rate) variables are used. For education, indicators that reflect both quantity (net enrolment rate), as well as quality (reading level for enrolled children), are used. For infrastructure, indicators across electricity, communication, banking and transportation are bunched up. To keep the comparison impartial, the principal component, a tool for combining the indicators, is employed. The data is ordered such that a higher index value means a better performing state.
</p>
<p align="justify">
What do the results show? We find that across health, education and infrastructure, Kerala, Goa and Himachal Pradesh are among the best performers and the so-called BIMARU states-Bihar, Madhya Pradesh (MP), Rajasthan and Uttar Pradesh (UP)-are laggards. This is hardly surprising. After all, the wonders of Kerala are well documented by Amartya Sen and several others and the demographer Ashish Bose coined the term BIMARU way back in the 1980s to highlight their lower levels of development.
</p>
<p align="justify">
How does one get to a more telling and appropriate comparison of states that controls for their inherent differences? How do we put the states on a level playing field? This can be done by controlling for consumption per person. We evaluate how well a state is doing on health, education and infrastructure, given its level of per capita consumption. This allows us to ask more sophisticated questions: is Gujarat doing as good a job with the resources it has at its disposal in contrast to, say, Bihar or Maharashtra? Although per capita gross domestic product (GDP) and consumption broadly measure the same thing and are tightly correlated, consumption has the benefit of reflecting actual purchasing power by including income generated from outside the state (inter-state remittances) and excluding income which gets diverted away from a state (especially for mining states).
</p>
<p align="justify">
This levelling exercise yields some interesting insights, (summarized in the accompanying chart that ranks states on performance from left to right, with the height of the bar indicating how much better a state is from the all-India benchmark). There is a clear differentiation among the BIMARU states. The rankings of Orissa, Bihar and Chhattisgarh rise sharply across all the three sectors. Orissa and Bihar, in particular, seem to be doing well by all India standards given their low level of income. MP and UP are below average, especially in health. Jharkhand and Rajasthan seem to be doing pretty poorly on all three fronts.
</p>
<p align="justify">
Coastal Kerala and West Bengal are good performers in health and education, though Kerala is, of course, in a higher league. Notably, both the states with their common history of Left rule are performing just about average on infrastructure. Among the hill states, there is a clear divide between the high-ranging Himachal Pradesh as the best in India and a flailing Uttarakhand far behind.
</p>
<p align="justify">
While Punjab fares decently on infrastructure, it slips from being a top-tier state in health and education to a medium-ranging one. This is surprising, given the common perception of healthy Punjabis being uncompromising with their food habits. In contrast, the more subdued Tamils seem to be a healthier lot.
</p>
<p align="justify">
While the much discussed Gujarat comes out as slightly better than the all-India average on infrastructure, it does not fare too well on education and does poorly on health. Finally, while Maharashtra does well on education, it is quite average on health and quite poor on infrastructure for the wealth it enjoys.
</p>
<p align="justify">
We also find a significantly positive relationship between consumption and our three constructed indices, suggesting that in the long run, better development outcomes are indeed associated with high consumption and GDP. However, all of these observations are limited to simple associations rather than causal relationships, which can be more complex to establish.
</p>
<p align="justify">
<em>Pranjul Bhandari is an economist headed to the John F. Kennedy School of Government at Harvard University as a Mason Fellow.</em>
</p>',
		'credit_writer' => 'Live Mint, 20 May, 2013, http://www.livemint.com/Opinion/VCyAxbnkhyA47bXE9Z9wfM/A-report-card-for-Indias-states.html',
		'article_img' => '',
		'article_img_thumb' => '',
		'status' => (int) 1,
		'show_on_home' => (int) 1,
		'lang' => 'EN',
		'category_id' => (int) 16,
		'tag_keyword' => '',
		'seo_url' => 'a-report-card-for-indias-states-pranjul-bhandari-21220',
		'meta_title' => null,
		'meta_keywords' => null,
		'meta_description' => null,
		'noindex' => (int) 0,
		'publish_date' => object(Cake\I18n\FrozenDate) {},
		'most_visit_section_id' => null,
		'article_big_img' => null,
		'liveid' => (int) 21220,
		'created' => object(Cake\I18n\FrozenTime) {},
		'modified' => object(Cake\I18n\FrozenTime) {},
		'edate' => '',
		'tags' => [
			[maximum depth reached]
		],
		'category' => object(App\Model\Entity\Category) {},
		'[new]' => false,
		'[accessible]' => [
			[maximum depth reached]
		],
		'[dirty]' => [[maximum depth reached]],
		'[original]' => [[maximum depth reached]],
		'[virtual]' => [[maximum depth reached]],
		'[hasErrors]' => false,
		'[errors]' => [[maximum depth reached]],
		'[invalid]' => [[maximum depth reached]],
		'[repository]' => 'Articles'

	},
	'articleid' => (int) 21075,
	'metaTitle' => 'LATEST NEWS UPDATES | A report card for India’s states -Pranjul Bhandari',
	'metaKeywords' => 'Human Development,Health,education,economy,Growth',
	'metaDesc' => '
-Live Mint


Cherry-picked indicators of progress cannot convey the complexities of development in India's diverse states


Which Indian states have fared better than their peers and which ones have done relatively worse is a perennial question for discussion. There is more...',
	'disp' => '<div align="justify">-Live Mint</div><p align="justify"><img src="https://im4change.in/siteadmin/tinymce/uploaded/Growth_1.bmp" alt="Growth" /><br /><em>Cherry-picked indicators of progress cannot convey the complexities of development in India's diverse states </em></p><p align="justify">Which Indian states have fared better than their peers and which ones have done relatively worse is a perennial question for discussion. There is more at stake than mere grading of states here. Investment flows, central government funds and praises for being a good state are all linked to this seemingly straightforward question.</p><p align="justify">It seems to have become fashionable for chief ministers to competitively boast about their performance. Most have a few favourite indicators that they brandish for this purpose. While some highlight the improvement in an indicator over the five odd years of their tenure as proof of good governance, others take a further step and stress how these indicators are better than another state's or even the national average.</p><p align="justify">A few stray indicators and anecdotes, however, cannot form a fair report card. That requires a more comprehensive assessment. It is not very telling for a much prosperous state (for example, Gujarat) to be compared with a less prosperous state (say, Bihar), which may have been disadvantaged for a variety of historical reasons. If states have to be compared in a constructive way, the yardstick for comparison needs to be levelled first. </p><p align="justify">How do we establish a fair and comprehensive basis for comparing the performance of states? How do we judge the authenticity of lofty claims? Here's a different way of looking at it: focus on health, education and infrastructure, which are the biggest development tasks at hand. Rather than depending on a single indicator, several indicators can be bunched together, forming an index for each of the three. For health, both input (for example, immunization) and output (infant mortality rate) variables are used. For education, indicators that reflect both quantity (net enrolment rate), as well as quality (reading level for enrolled children), are used. For infrastructure, indicators across electricity, communication, banking and transportation are bunched up. To keep the comparison impartial, the principal component, a tool for combining the indicators, is employed. The data is ordered such that a higher index value means a better performing state.</p><p align="justify">What do the results show? We find that across health, education and infrastructure, Kerala, Goa and Himachal Pradesh are among the best performers and the so-called BIMARU states-Bihar, Madhya Pradesh (MP), Rajasthan and Uttar Pradesh (UP)-are laggards. This is hardly surprising. After all, the wonders of Kerala are well documented by Amartya Sen and several others and the demographer Ashish Bose coined the term BIMARU way back in the 1980s to highlight their lower levels of development.</p><p align="justify">How does one get to a more telling and appropriate comparison of states that controls for their inherent differences? How do we put the states on a level playing field? This can be done by controlling for consumption per person. We evaluate how well a state is doing on health, education and infrastructure, given its level of per capita consumption. This allows us to ask more sophisticated questions: is Gujarat doing as good a job with the resources it has at its disposal in contrast to, say, Bihar or Maharashtra? Although per capita gross domestic product (GDP) and consumption broadly measure the same thing and are tightly correlated, consumption has the benefit of reflecting actual purchasing power by including income generated from outside the state (inter-state remittances) and excluding income which gets diverted away from a state (especially for mining states).</p><p align="justify">This levelling exercise yields some interesting insights, (summarized in the accompanying chart that ranks states on performance from left to right, with the height of the bar indicating how much better a state is from the all-India benchmark). There is a clear differentiation among the BIMARU states. The rankings of Orissa, Bihar and Chhattisgarh rise sharply across all the three sectors. Orissa and Bihar, in particular, seem to be doing well by all India standards given their low level of income. MP and UP are below average, especially in health. Jharkhand and Rajasthan seem to be doing pretty poorly on all three fronts.</p><p align="justify">Coastal Kerala and West Bengal are good performers in health and education, though Kerala is, of course, in a higher league. Notably, both the states with their common history of Left rule are performing just about average on infrastructure. Among the hill states, there is a clear divide between the high-ranging Himachal Pradesh as the best in India and a flailing Uttarakhand far behind.</p><p align="justify">While Punjab fares decently on infrastructure, it slips from being a top-tier state in health and education to a medium-ranging one. This is surprising, given the common perception of healthy Punjabis being uncompromising with their food habits. In contrast, the more subdued Tamils seem to be a healthier lot.</p><p align="justify">While the much discussed Gujarat comes out as slightly better than the all-India average on infrastructure, it does not fare too well on education and does poorly on health. Finally, while Maharashtra does well on education, it is quite average on health and quite poor on infrastructure for the wealth it enjoys.</p><p align="justify">We also find a significantly positive relationship between consumption and our three constructed indices, suggesting that in the long run, better development outcomes are indeed associated with high consumption and GDP. However, all of these observations are limited to simple associations rather than causal relationships, which can be more complex to establish.</p><p align="justify"><em>Pranjul Bhandari is an economist headed to the John F. Kennedy School of Government at Harvard University as a Mason Fellow.</em></p>',
	'lang' => 'English',
	'SITE_URL' => 'https://im4change.in/',
	'site_title' => 'im4change',
	'adminprix' => 'admin'
]
$article_current = object(App\Model\Entity\Article) {

	'id' => (int) 21075,
	'title' => 'A report card for India’s states -Pranjul Bhandari',
	'subheading' => '',
	'description' => '<div align="justify">
-Live Mint
</div>
<p align="justify">
<img src="tinymce/uploaded/Growth_1.bmp" alt="Growth" /><br />
<em>Cherry-picked indicators of progress cannot convey the complexities of development in India's diverse states </em>
</p>
<p align="justify">
Which Indian states have fared better than their peers and which ones have done relatively worse is a perennial question for discussion. There is more at stake than mere grading of states here. Investment flows, central government funds and praises for being a good state are all linked to this seemingly straightforward question.
</p>
<p align="justify">
It seems to have become fashionable for chief ministers to competitively boast about their performance. Most have a few favourite indicators that they brandish for this purpose. While some highlight the improvement in an indicator over the five odd years of their tenure as proof of good governance, others take a further step and stress how these indicators are better than another state's or even the national average.
</p>
<p align="justify">
A few stray indicators and anecdotes, however, cannot form a fair report card. That requires a more comprehensive assessment. It is not very telling for a much prosperous state (for example, Gujarat) to be compared with a less prosperous state (say, Bihar), which may have been disadvantaged for a variety of historical reasons. If states have to be compared in a constructive way, the yardstick for comparison needs to be levelled first.
</p>
<p align="justify">
How do we establish a fair and comprehensive basis for comparing the performance of states? How do we judge the authenticity of lofty claims? Here's a different way of looking at it: focus on health, education and infrastructure, which are the biggest development tasks at hand. Rather than depending on a single indicator, several indicators can be bunched together, forming an index for each of the three. For health, both input (for example, immunization) and output (infant mortality rate) variables are used. For education, indicators that reflect both quantity (net enrolment rate), as well as quality (reading level for enrolled children), are used. For infrastructure, indicators across electricity, communication, banking and transportation are bunched up. To keep the comparison impartial, the principal component, a tool for combining the indicators, is employed. The data is ordered such that a higher index value means a better performing state.
</p>
<p align="justify">
What do the results show? We find that across health, education and infrastructure, Kerala, Goa and Himachal Pradesh are among the best performers and the so-called BIMARU states-Bihar, Madhya Pradesh (MP), Rajasthan and Uttar Pradesh (UP)-are laggards. This is hardly surprising. After all, the wonders of Kerala are well documented by Amartya Sen and several others and the demographer Ashish Bose coined the term BIMARU way back in the 1980s to highlight their lower levels of development.
</p>
<p align="justify">
How does one get to a more telling and appropriate comparison of states that controls for their inherent differences? How do we put the states on a level playing field? This can be done by controlling for consumption per person. We evaluate how well a state is doing on health, education and infrastructure, given its level of per capita consumption. This allows us to ask more sophisticated questions: is Gujarat doing as good a job with the resources it has at its disposal in contrast to, say, Bihar or Maharashtra? Although per capita gross domestic product (GDP) and consumption broadly measure the same thing and are tightly correlated, consumption has the benefit of reflecting actual purchasing power by including income generated from outside the state (inter-state remittances) and excluding income which gets diverted away from a state (especially for mining states).
</p>
<p align="justify">
This levelling exercise yields some interesting insights, (summarized in the accompanying chart that ranks states on performance from left to right, with the height of the bar indicating how much better a state is from the all-India benchmark). There is a clear differentiation among the BIMARU states. The rankings of Orissa, Bihar and Chhattisgarh rise sharply across all the three sectors. Orissa and Bihar, in particular, seem to be doing well by all India standards given their low level of income. MP and UP are below average, especially in health. Jharkhand and Rajasthan seem to be doing pretty poorly on all three fronts.
</p>
<p align="justify">
Coastal Kerala and West Bengal are good performers in health and education, though Kerala is, of course, in a higher league. Notably, both the states with their common history of Left rule are performing just about average on infrastructure. Among the hill states, there is a clear divide between the high-ranging Himachal Pradesh as the best in India and a flailing Uttarakhand far behind.
</p>
<p align="justify">
While Punjab fares decently on infrastructure, it slips from being a top-tier state in health and education to a medium-ranging one. This is surprising, given the common perception of healthy Punjabis being uncompromising with their food habits. In contrast, the more subdued Tamils seem to be a healthier lot.
</p>
<p align="justify">
While the much discussed Gujarat comes out as slightly better than the all-India average on infrastructure, it does not fare too well on education and does poorly on health. Finally, while Maharashtra does well on education, it is quite average on health and quite poor on infrastructure for the wealth it enjoys.
</p>
<p align="justify">
We also find a significantly positive relationship between consumption and our three constructed indices, suggesting that in the long run, better development outcomes are indeed associated with high consumption and GDP. However, all of these observations are limited to simple associations rather than causal relationships, which can be more complex to establish.
</p>
<p align="justify">
<em>Pranjul Bhandari is an economist headed to the John F. Kennedy School of Government at Harvard University as a Mason Fellow.</em>
</p>',
	'credit_writer' => 'Live Mint, 20 May, 2013, http://www.livemint.com/Opinion/VCyAxbnkhyA47bXE9Z9wfM/A-report-card-for-Indias-states.html',
	'article_img' => '',
	'article_img_thumb' => '',
	'status' => (int) 1,
	'show_on_home' => (int) 1,
	'lang' => 'EN',
	'category_id' => (int) 16,
	'tag_keyword' => '',
	'seo_url' => 'a-report-card-for-indias-states-pranjul-bhandari-21220',
	'meta_title' => null,
	'meta_keywords' => null,
	'meta_description' => null,
	'noindex' => (int) 0,
	'publish_date' => object(Cake\I18n\FrozenDate) {},
	'most_visit_section_id' => null,
	'article_big_img' => null,
	'liveid' => (int) 21220,
	'created' => object(Cake\I18n\FrozenTime) {},
	'modified' => object(Cake\I18n\FrozenTime) {},
	'edate' => '',
	'tags' => [
		(int) 0 => object(Cake\ORM\Entity) {},
		(int) 1 => object(Cake\ORM\Entity) {},
		(int) 2 => object(Cake\ORM\Entity) {},
		(int) 3 => object(Cake\ORM\Entity) {},
		(int) 4 => object(Cake\ORM\Entity) {}
	],
	'category' => object(App\Model\Entity\Category) {},
	'[new]' => false,
	'[accessible]' => [
		'*' => true,
		'id' => false
	],
	'[dirty]' => [],
	'[original]' => [],
	'[virtual]' => [],
	'[hasErrors]' => false,
	'[errors]' => [],
	'[invalid]' => [],
	'[repository]' => 'Articles'

}
$articleid = (int) 21075
$metaTitle = 'LATEST NEWS UPDATES | A report card for India’s states -Pranjul Bhandari'
$metaKeywords = 'Human Development,Health,education,economy,Growth'
$metaDesc = '
-Live Mint


Cherry-picked indicators of progress cannot convey the complexities of development in India's diverse states


Which Indian states have fared better than their peers and which ones have done relatively worse is a perennial question for discussion. There is more...'
$disp = '<div align="justify">-Live Mint</div><p align="justify"><img src="https://im4change.in/siteadmin/tinymce/uploaded/Growth_1.bmp" alt="Growth" /><br /><em>Cherry-picked indicators of progress cannot convey the complexities of development in India's diverse states </em></p><p align="justify">Which Indian states have fared better than their peers and which ones have done relatively worse is a perennial question for discussion. There is more at stake than mere grading of states here. Investment flows, central government funds and praises for being a good state are all linked to this seemingly straightforward question.</p><p align="justify">It seems to have become fashionable for chief ministers to competitively boast about their performance. Most have a few favourite indicators that they brandish for this purpose. While some highlight the improvement in an indicator over the five odd years of their tenure as proof of good governance, others take a further step and stress how these indicators are better than another state's or even the national average.</p><p align="justify">A few stray indicators and anecdotes, however, cannot form a fair report card. That requires a more comprehensive assessment. It is not very telling for a much prosperous state (for example, Gujarat) to be compared with a less prosperous state (say, Bihar), which may have been disadvantaged for a variety of historical reasons. If states have to be compared in a constructive way, the yardstick for comparison needs to be levelled first. </p><p align="justify">How do we establish a fair and comprehensive basis for comparing the performance of states? How do we judge the authenticity of lofty claims? Here's a different way of looking at it: focus on health, education and infrastructure, which are the biggest development tasks at hand. Rather than depending on a single indicator, several indicators can be bunched together, forming an index for each of the three. For health, both input (for example, immunization) and output (infant mortality rate) variables are used. For education, indicators that reflect both quantity (net enrolment rate), as well as quality (reading level for enrolled children), are used. For infrastructure, indicators across electricity, communication, banking and transportation are bunched up. To keep the comparison impartial, the principal component, a tool for combining the indicators, is employed. The data is ordered such that a higher index value means a better performing state.</p><p align="justify">What do the results show? We find that across health, education and infrastructure, Kerala, Goa and Himachal Pradesh are among the best performers and the so-called BIMARU states-Bihar, Madhya Pradesh (MP), Rajasthan and Uttar Pradesh (UP)-are laggards. This is hardly surprising. After all, the wonders of Kerala are well documented by Amartya Sen and several others and the demographer Ashish Bose coined the term BIMARU way back in the 1980s to highlight their lower levels of development.</p><p align="justify">How does one get to a more telling and appropriate comparison of states that controls for their inherent differences? How do we put the states on a level playing field? This can be done by controlling for consumption per person. We evaluate how well a state is doing on health, education and infrastructure, given its level of per capita consumption. This allows us to ask more sophisticated questions: is Gujarat doing as good a job with the resources it has at its disposal in contrast to, say, Bihar or Maharashtra? Although per capita gross domestic product (GDP) and consumption broadly measure the same thing and are tightly correlated, consumption has the benefit of reflecting actual purchasing power by including income generated from outside the state (inter-state remittances) and excluding income which gets diverted away from a state (especially for mining states).</p><p align="justify">This levelling exercise yields some interesting insights, (summarized in the accompanying chart that ranks states on performance from left to right, with the height of the bar indicating how much better a state is from the all-India benchmark). There is a clear differentiation among the BIMARU states. The rankings of Orissa, Bihar and Chhattisgarh rise sharply across all the three sectors. Orissa and Bihar, in particular, seem to be doing well by all India standards given their low level of income. MP and UP are below average, especially in health. Jharkhand and Rajasthan seem to be doing pretty poorly on all three fronts.</p><p align="justify">Coastal Kerala and West Bengal are good performers in health and education, though Kerala is, of course, in a higher league. Notably, both the states with their common history of Left rule are performing just about average on infrastructure. Among the hill states, there is a clear divide between the high-ranging Himachal Pradesh as the best in India and a flailing Uttarakhand far behind.</p><p align="justify">While Punjab fares decently on infrastructure, it slips from being a top-tier state in health and education to a medium-ranging one. This is surprising, given the common perception of healthy Punjabis being uncompromising with their food habits. In contrast, the more subdued Tamils seem to be a healthier lot.</p><p align="justify">While the much discussed Gujarat comes out as slightly better than the all-India average on infrastructure, it does not fare too well on education and does poorly on health. Finally, while Maharashtra does well on education, it is quite average on health and quite poor on infrastructure for the wealth it enjoys.</p><p align="justify">We also find a significantly positive relationship between consumption and our three constructed indices, suggesting that in the long run, better development outcomes are indeed associated with high consumption and GDP. However, all of these observations are limited to simple associations rather than causal relationships, which can be more complex to establish.</p><p align="justify"><em>Pranjul Bhandari is an economist headed to the John F. Kennedy School of Government at Harvard University as a Mason Fellow.</em></p>'
$lang = 'English'
$SITE_URL = 'https://im4change.in/'
$site_title = 'im4change'
$adminprix = 'admin'
include - APP/Template/Layout/printlayout.ctp, line 8
Cake\View\View::_evaluate() - CORE/src/View/View.php, line 1413
Cake\View\View::_render() - CORE/src/View/View.php, line 1374
Cake\View\View::renderLayout() - CORE/src/View/View.php, line 927
Cake\View\View::render() - CORE/src/View/View.php, line 885
Cake\Controller\Controller::render() - CORE/src/Controller/Controller.php, line 791
Cake\Http\ActionDispatcher::_invoke() - CORE/src/Http/ActionDispatcher.php, line 126
Cake\Http\ActionDispatcher::dispatch() - CORE/src/Http/ActionDispatcher.php, line 94
Cake\Http\BaseApplication::__invoke() - CORE/src/Http/BaseApplication.php, line 235
Cake\Http\Runner::__invoke() - CORE/src/Http/Runner.php, line 65
Cake\Routing\Middleware\RoutingMiddleware::__invoke() - CORE/src/Routing/Middleware/RoutingMiddleware.php, line 162
Cake\Http\Runner::__invoke() - CORE/src/Http/Runner.php, line 65
Cake\Routing\Middleware\AssetMiddleware::__invoke() - CORE/src/Routing/Middleware/AssetMiddleware.php, line 88
Cake\Http\Runner::__invoke() - CORE/src/Http/Runner.php, line 65
Cake\Error\Middleware\ErrorHandlerMiddleware::__invoke() - CORE/src/Error/Middleware/ErrorHandlerMiddleware.php, line 96
Cake\Http\Runner::__invoke() - CORE/src/Http/Runner.php, line 65
Cake\Http\Runner::run() - CORE/src/Http/Runner.php, line 51
latest-news-updates/a-report-card-for-indias-states-pranjul-bhandari-21220.html"/>
LATEST NEWS UPDATES | A report card for India’s states -Pranjul Bhandari | Im4change.org
A report card for India’s states -Pranjul Bhandari
-Live Mint
Cherry-picked indicators of progress cannot convey the complexities of development in India's diverse states
Which Indian states have fared better than their peers and which ones have done relatively worse is a perennial question for discussion. There is more at stake than mere grading of states here. Investment flows, central government funds and praises for being a good state are all linked to this seemingly straightforward question.
It seems to have become fashionable for chief ministers to competitively boast about their performance. Most have a few favourite indicators that they brandish for this purpose. While some highlight the improvement in an indicator over the five odd years of their tenure as proof of good governance, others take a further step and stress how these indicators are better than another state's or even the national average.
A few stray indicators and anecdotes, however, cannot form a fair report card. That requires a more comprehensive assessment. It is not very telling for a much prosperous state (for example, Gujarat) to be compared with a less prosperous state (say, Bihar), which may have been disadvantaged for a variety of historical reasons. If states have to be compared in a constructive way, the yardstick for comparison needs to be levelled first.
How do we establish a fair and comprehensive basis for comparing the performance of states? How do we judge the authenticity of lofty claims? Here's a different way of looking at it: focus on health, education and infrastructure, which are the biggest development tasks at hand. Rather than depending on a single indicator, several indicators can be bunched together, forming an index for each of the three. For health, both input (for example, immunization) and output (infant mortality rate) variables are used. For education, indicators that reflect both quantity (net enrolment rate), as well as quality (reading level for enrolled children), are used. For infrastructure, indicators across electricity, communication, banking and transportation are bunched up. To keep the comparison impartial, the principal component, a tool for combining the indicators, is employed. The data is ordered such that a higher index value means a better performing state.
What do the results show? We find that across health, education and infrastructure, Kerala, Goa and Himachal Pradesh are among the best performers and the so-called BIMARU states-Bihar, Madhya Pradesh (MP), Rajasthan and Uttar Pradesh (UP)-are laggards. This is hardly surprising. After all, the wonders of Kerala are well documented by Amartya Sen and several others and the demographer Ashish Bose coined the term BIMARU way back in the 1980s to highlight their lower levels of development.
How does one get to a more telling and appropriate comparison of states that controls for their inherent differences? How do we put the states on a level playing field? This can be done by controlling for consumption per person. We evaluate how well a state is doing on health, education and infrastructure, given its level of per capita consumption. This allows us to ask more sophisticated questions: is Gujarat doing as good a job with the resources it has at its disposal in contrast to, say, Bihar or Maharashtra? Although per capita gross domestic product (GDP) and consumption broadly measure the same thing and are tightly correlated, consumption has the benefit of reflecting actual purchasing power by including income generated from outside the state (inter-state remittances) and excluding income which gets diverted away from a state (especially for mining states).
This levelling exercise yields some interesting insights, (summarized in the accompanying chart that ranks states on performance from left to right, with the height of the bar indicating how much better a state is from the all-India benchmark). There is a clear differentiation among the BIMARU states. The rankings of Orissa, Bihar and Chhattisgarh rise sharply across all the three sectors. Orissa and Bihar, in particular, seem to be doing well by all India standards given their low level of income. MP and UP are below average, especially in health. Jharkhand and Rajasthan seem to be doing pretty poorly on all three fronts.
Coastal Kerala and West Bengal are good performers in health and education, though Kerala is, of course, in a higher league. Notably, both the states with their common history of Left rule are performing just about average on infrastructure. Among the hill states, there is a clear divide between the high-ranging Himachal Pradesh as the best in India and a flailing Uttarakhand far behind.
While Punjab fares decently on infrastructure, it slips from being a top-tier state in health and education to a medium-ranging one. This is surprising, given the common perception of healthy Punjabis being uncompromising with their food habits. In contrast, the more subdued Tamils seem to be a healthier lot.
While the much discussed Gujarat comes out as slightly better than the all-India average on infrastructure, it does not fare too well on education and does poorly on health. Finally, while Maharashtra does well on education, it is quite average on health and quite poor on infrastructure for the wealth it enjoys.
We also find a significantly positive relationship between consumption and our three constructed indices, suggesting that in the long run, better development outcomes are indeed associated with high consumption and GDP. However, all of these observations are limited to simple associations rather than causal relationships, which can be more complex to establish.
Pranjul Bhandari is an economist headed to the John F. Kennedy School of Government at Harvard University as a Mason Fellow.