Deprecated (16384): The ArrayAccess methods will be removed in 4.0.0.Use getParam(), getData() and getQuery() instead. - /home/brlfuser/public_html/src/Controller/ArtileDetailController.php, line: 73
You can disable deprecation warnings by setting `Error.errorLevel` to `E_ALL & ~E_USER_DEPRECATED` in your config/app.php. [CORE/src/Core/functions.php, line 311]
deprecationWarning - CORE/src/Core/functions.php, line 311
Cake\Http\ServerRequest::offsetGet() - CORE/src/Http/ServerRequest.php, line 2421
App\Controller\ArtileDetailController::printArticle() - APP/Controller/ArtileDetailController.php, line 73
Cake\Controller\Controller::invokeAction() - CORE/src/Controller/Controller.php, line 610
Cake\Http\ActionDispatcher::_invoke() - CORE/src/Http/ActionDispatcher.php, line 120
Cake\Http\ActionDispatcher::dispatch() - CORE/src/Http/ActionDispatcher.php, line 94
Cake\Http\BaseApplication::__invoke() - CORE/src/Http/BaseApplication.php, line 235
Cake\Http\Runner::__invoke() - CORE/src/Http/Runner.php, line 65
Cake\Routing\Middleware\RoutingMiddleware::__invoke() - CORE/src/Routing/Middleware/RoutingMiddleware.php, line 162
Cake\Http\Runner::__invoke() - CORE/src/Http/Runner.php, line 65
Cake\Routing\Middleware\AssetMiddleware::__invoke() - CORE/src/Routing/Middleware/AssetMiddleware.php, line 88
Cake\Http\Runner::__invoke() - CORE/src/Http/Runner.php, line 65
Cake\Error\Middleware\ErrorHandlerMiddleware::__invoke() - CORE/src/Error/Middleware/ErrorHandlerMiddleware.php, line 96
Cake\Http\Runner::__invoke() - CORE/src/Http/Runner.php, line 65
Cake\Http\Runner::run() - CORE/src/Http/Runner.php, line 51
Cake\Http\Server::run() - CORE/src/Http/Server.php, line 98
Deprecated (16384): The ArrayAccess methods will be removed in 4.0.0.Use getParam(), getData() and getQuery() instead. - /home/brlfuser/public_html/src/Controller/ArtileDetailController.php, line: 74
You can disable deprecation warnings by setting `Error.errorLevel` to `E_ALL & ~E_USER_DEPRECATED` in your config/app.php. [CORE/src/Core/functions.php, line 311]
deprecationWarning - CORE/src/Core/functions.php, line 311
Cake\Http\ServerRequest::offsetGet() - CORE/src/Http/ServerRequest.php, line 2421
App\Controller\ArtileDetailController::printArticle() - APP/Controller/ArtileDetailController.php, line 74
Cake\Controller\Controller::invokeAction() - CORE/src/Controller/Controller.php, line 610
Cake\Http\ActionDispatcher::_invoke() - CORE/src/Http/ActionDispatcher.php, line 120
Cake\Http\ActionDispatcher::dispatch() - CORE/src/Http/ActionDispatcher.php, line 94
Cake\Http\BaseApplication::__invoke() - CORE/src/Http/BaseApplication.php, line 235
Cake\Http\Runner::__invoke() - CORE/src/Http/Runner.php, line 65
Cake\Routing\Middleware\RoutingMiddleware::__invoke() - CORE/src/Routing/Middleware/RoutingMiddleware.php, line 162
Cake\Http\Runner::__invoke() - CORE/src/Http/Runner.php, line 65
Cake\Routing\Middleware\AssetMiddleware::__invoke() - CORE/src/Routing/Middleware/AssetMiddleware.php, line 88
Cake\Http\Runner::__invoke() - CORE/src/Http/Runner.php, line 65
Cake\Error\Middleware\ErrorHandlerMiddleware::__invoke() - CORE/src/Error/Middleware/ErrorHandlerMiddleware.php, line 96
Cake\Http\Runner::__invoke() - CORE/src/Http/Runner.php, line 65
Cake\Http\Runner::run() - CORE/src/Http/Runner.php, line 51
Cake\Http\Server::run() - CORE/src/Http/Server.php, line 98
Warning (512): Unable to emit headers. Headers sent in file=/home/brlfuser/public_html/vendor/cakephp/cakephp/src/Error/Debugger.php line=853 [CORE/src/Http/ResponseEmitter.php, line 48]
if (Configure::read('debug')) {
trigger_error($message, E_USER_WARNING);
} else {
$response = object(Cake\Http\Response) {
'status' => (int) 200,
'contentType' => 'text/html',
'headers' => [
'Content-Type' => [
[maximum depth reached]
]
],
'file' => null,
'fileRange' => [],
'cookies' => object(Cake\Http\Cookie\CookieCollection) {},
'cacheDirectives' => [],
'body' => '<!DOCTYPE html PUBLIC "-//W3C//DTD XHTML 1.0 Transitional//EN"
"http://www.w3.org/TR/xhtml1/DTD/xhtml1-transitional.dtd">
<html xmlns="http://www.w3.org/1999/xhtml">
<head>
<link rel="canonical" href="https://im4change.in/<pre class="cake-error"><a href="javascript:void(0);" onclick="document.getElementById('cakeErr67f6a6089de6a-trace').style.display = (document.getElementById('cakeErr67f6a6089de6a-trace').style.display == 'none' ? '' : 'none');"><b>Notice</b> (8)</a>: Undefined variable: urlPrefix [<b>APP/Template/Layout/printlayout.ctp</b>, line <b>8</b>]<div id="cakeErr67f6a6089de6a-trace" class="cake-stack-trace" style="display: none;"><a href="javascript:void(0);" onclick="document.getElementById('cakeErr67f6a6089de6a-code').style.display = (document.getElementById('cakeErr67f6a6089de6a-code').style.display == 'none' ? '' : 'none')">Code</a> <a href="javascript:void(0);" onclick="document.getElementById('cakeErr67f6a6089de6a-context').style.display = (document.getElementById('cakeErr67f6a6089de6a-context').style.display == 'none' ? '' : 'none')">Context</a><pre id="cakeErr67f6a6089de6a-code" class="cake-code-dump" style="display: none;"><code><span style="color: #000000"><span style="color: #0000BB"></span><span style="color: #007700"><</span><span style="color: #0000BB">head</span><span style="color: #007700">>
</span></span></code>
<span class="code-highlight"><code><span style="color: #000000"> <link rel="canonical" href="<span style="color: #0000BB"><?php </span><span style="color: #007700">echo </span><span style="color: #0000BB">Configure</span><span style="color: #007700">::</span><span style="color: #0000BB">read</span><span style="color: #007700">(</span><span style="color: #DD0000">'SITE_URL'</span><span style="color: #007700">); </span><span style="color: #0000BB">?><?php </span><span style="color: #007700">echo </span><span style="color: #0000BB">$urlPrefix</span><span style="color: #007700">;</span><span style="color: #0000BB">?><?php </span><span style="color: #007700">echo </span><span style="color: #0000BB">$article_current</span><span style="color: #007700">-></span><span style="color: #0000BB">category</span><span style="color: #007700">-></span><span style="color: #0000BB">slug</span><span style="color: #007700">; </span><span style="color: #0000BB">?></span>/<span style="color: #0000BB"><?php </span><span style="color: #007700">echo </span><span style="color: #0000BB">$article_current</span><span style="color: #007700">-></span><span style="color: #0000BB">seo_url</span><span style="color: #007700">; </span><span style="color: #0000BB">?></span>.html"/>
</span></code></span>
<code><span style="color: #000000"><span style="color: #0000BB"> </span><span style="color: #007700"><</span><span style="color: #0000BB">meta http</span><span style="color: #007700">-</span><span style="color: #0000BB">equiv</span><span style="color: #007700">=</span><span style="color: #DD0000">"Content-Type" </span><span style="color: #0000BB">content</span><span style="color: #007700">=</span><span style="color: #DD0000">"text/html; charset=utf-8"</span><span style="color: #007700">/>
</span></span></code></pre><pre id="cakeErr67f6a6089de6a-context" class="cake-context" style="display: none;">$viewFile = '/home/brlfuser/public_html/src/Template/Layout/printlayout.ctp'
$dataForView = [
'article_current' => object(App\Model\Entity\Article) {
'id' => (int) 30010,
'title' => 'How deep is India’s poverty? -C Rangarajan and S Mahendra Dev',
'subheading' => '',
'description' => '<div align="justify">
-The Indian Express<br />
</div>
<div align="justify">
&nbsp;
</div>
<div align="justify">
<em>India&rsquo;s poor are closely bunched up near the poverty line. This could make poverty alleviation more manageable.&nbsp; </em>
</div>
<div align="justify">
&nbsp;
</div>
<div align="justify">
A recent World Bank (WB) report brought out poverty ratios across countries. According to these estimates, poverty in India in 2011-12 could be as low as 12.4 per cent if we use &ldquo;modified mixed reference period&rdquo; (MMRP), in which there are three recall periods depending on the nature of items. This contrasts with the Rangarajan committee estimates of 29.5 per cent. The poverty line (PL) used by the Rangarajan committee for India was around Rs 1,105 per capita per month. That translates to $2.44 per capita per day, in terms of purchasing power parity. As such, the WB&rsquo;s PL of $1.90 per capita per day is only about 78 per cent of the PL used by the Rangarajan committee. The lower PL is the reason for the lower poverty ratio estimated by the WB.<br />
<br />
However, the WB report also talks about the depth of poverty in terms of person-equivalent headcounts. According to the report, the depth elasticity at the global level between 1990 and 2012 was 1.18. In other words, the reductions in traditional head count ratios were accompanied by even larger reductions in person-equivalent poverty ratios. This is true in the regions where the bulk of the poor reside, such as South Asia.<br />
<br />
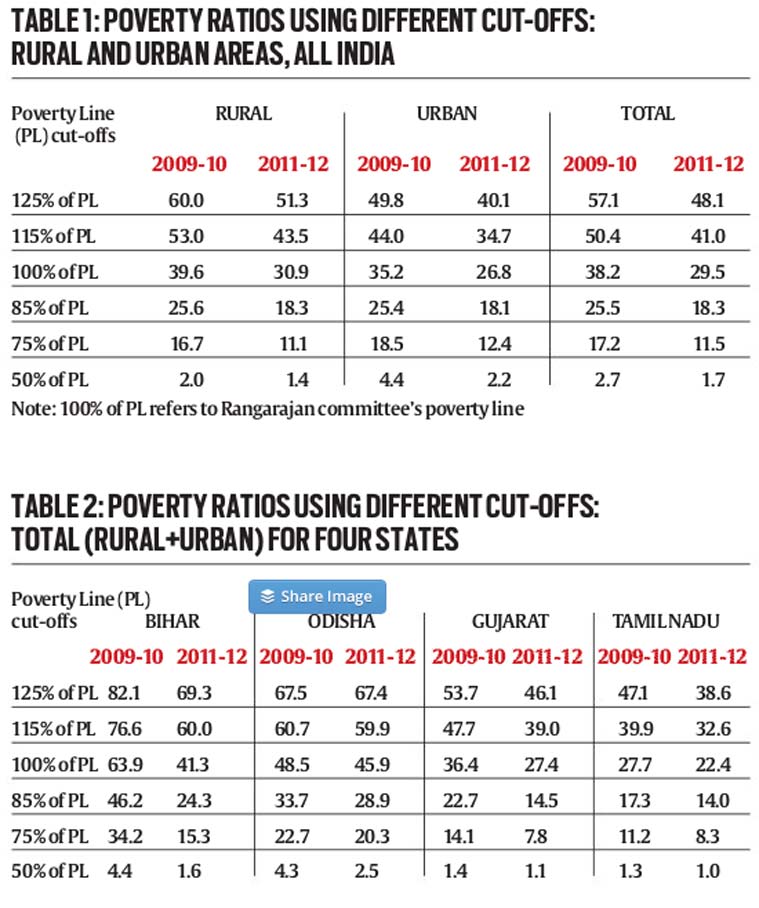
Here, we examine the depth of poverty in India in a different way &mdash; by looking at the poverty ratios using different cut-offs of the PL. The first issue is whether the poverty ratios with lowered PL cut-offs are declining as fast as those with raised PL cut-offs. The second issue is the location of the poor, that is, whether the poor are located much below the PL or around the PL.<br />
<br />
One conclusion is that even if we raise the PL to 125 per cent of what it is, the reduction in the poverty ratio was 9 percentage points between 2009-10 and 2011-12 (Table 1). This is also true for the poverty ratio based on 115 per cent of the PL. In the case of 85 per cent and 75 per cent of the PL, the percentage point decline was lower than those with the raised PL. But if we adjust for base poverty ratio, its decline was faster for 85 per cent of the PL and 75 per cent of the PL as compared to those between the PL and 125 per cent of the PL.<br />
</div>
<div align="justify">
&nbsp;
</div>
<div align="justify">
<img src="tinymce/uploaded/Table Poverty.jpg" alt="Table Poverty" width="759" height="908" /> <br />
</div>
<div align="justify">
&nbsp;
</div>
<div align="justify">
Headcount ratio is often criticised on the ground that it does not measure the &ldquo;depth&rdquo; of poverty. It is seen, however, that more than 50 per cent of the poor lie between the PL and 75 per cent of the PL. This is true for both 2009-10 and 2011-12. In fact, 65 per cent of the rural poor and 61 per cent total poor lie between the PL and 75 per cent of the PL in 2011-12. It may also be noted that many of the non-poor also live just above the PL between 115 per cent of the PL and the PL or between 125 per cent of the PL and the PL.<br />
<br />
Another point is that there is a negligible population below 50 per cent of the PL &mdash; less than 2 per cent in 2011-12.<br />
<br />
We also looked at the poverty ratios with different cut-offs of PLs for two relatively poorer states &mdash; Bihar and Odisha &mdash; and two developed states &mdash;Tamil Nadu and Gujarat (Table 2). It provides interesting results. In Bihar and Odisha, the rate of decline in poverty is lower for the raised PL of 125 per cent and 115 per cent, as compared to the PL and the lower cut-offs of 85 of the PL and 75 per cent of the PL. The decline is even faster for these two states at lower cut-offs if we take into account the base poverty ratio. The raised PLs for Odisha reveal only a marginal decline for both 125 per cent of the PL and 115 per cent of the PL. In the case of Gujarat, the decline in percentage points is higher for the raised cut-offs compared to the lowered cut-offs. If we take into account the base effect, the rate of decline is higher for the lowered cut-offs. As far as Tamil Nadu is concerned, the decline in percentage points in poverty was higher for the raised PL compared to those of the lowered PLs. However, if we take the base effect, the rate of change is more or less similar.<br />
<br />
As far as a concentration of poverty is concerned, it is clear that in all the four states the bulk of the poor lie between the PL and 75 per cent of the PL. In the case of two advanced states, Gujarat and Tamil Nadu, the concentration is even higher. In 2011-12, in Gujarat, 71.5 per cent of the poor were within these limits. In Tamil Nadu, the percentage of the poor falling within these limits is 63 per cent. The proportions are, however, much lower in the case of Bihar and Odisha. In both Gujarat and Tamil Nadu, the percentage of the poor falling between these limits has increased between 2009-10 and 2011-12, indicating a faster decline in the depth of poverty.<br />
<br />
There are three conclusions from the all-India and state-wise analysis. First, the rate of decline in poverty ratios for the lowered cut-off is similar or more than those for the PL or the raised PL. Second, poverty is concentrated around the PL. Third, the percentage of population below 50 per cent of the PL is negligible at both all-India and state levels.<br />
<br />
The bunching of poverty around the poverty line in India renders the problem of reducing poverty more manageable. The pace and pattern of growth have a significant impact on reducing poverty ratios. But as we have repeatedly emphasised, policymakers must pursue a two-fold strategy of letting the economy grow fast and attacking poverty directly through poverty alleviation programmes.<br />
<br />
&nbsp;<br />
<em>Rangarajan is chairman, Madras School of Economics, Chennai and Dev is director, Indira Gandhi Institute of Development Research, Mumbai.<br />
</em><br />
</div>',
'credit_writer' => 'The Indian Express, 15 December, 2015, http://indianexpress.com/article/opinion/columns/how-deep-is-indias-poverty/',
'article_img' => '',
'article_img_thumb' => '',
'status' => (int) 1,
'show_on_home' => (int) 1,
'lang' => 'EN',
'category_id' => (int) 16,
'tag_keyword' => '',
'seo_url' => 'how-deep-is-indias-poverty-c-rangarajan-and-s-mahendra-dev-4678069',
'meta_title' => null,
'meta_keywords' => null,
'meta_description' => null,
'noindex' => (int) 0,
'publish_date' => object(Cake\I18n\FrozenDate) {},
'most_visit_section_id' => null,
'article_big_img' => null,
'liveid' => (int) 4678069,
'created' => object(Cake\I18n\FrozenTime) {},
'modified' => object(Cake\I18n\FrozenTime) {},
'edate' => '',
'tags' => [
[maximum depth reached]
],
'category' => object(App\Model\Entity\Category) {},
'[new]' => false,
'[accessible]' => [
[maximum depth reached]
],
'[dirty]' => [[maximum depth reached]],
'[original]' => [[maximum depth reached]],
'[virtual]' => [[maximum depth reached]],
'[hasErrors]' => false,
'[errors]' => [[maximum depth reached]],
'[invalid]' => [[maximum depth reached]],
'[repository]' => 'Articles'
},
'articleid' => (int) 30010,
'metaTitle' => 'LATEST NEWS UPDATES | How deep is India’s poverty? -C Rangarajan and S Mahendra Dev',
'metaKeywords' => 'poverty estimate,poverty estimates,poverty line,poverty measures',
'metaDesc' => '
-The Indian Express
&nbsp;
India&rsquo;s poor are closely bunched up near the poverty line. This could make poverty alleviation more manageable.&nbsp;
&nbsp;
A recent World Bank (WB) report brought out poverty ratios across countries. According to these estimates, poverty in India in 2011-12...',
'disp' => '<div align="justify">-The Indian Express<br /></div><div align="justify">&nbsp;</div><div align="justify"><em>India&rsquo;s poor are closely bunched up near the poverty line. This could make poverty alleviation more manageable.&nbsp; </em></div><div align="justify">&nbsp;</div><div align="justify">A recent World Bank (WB) report brought out poverty ratios across countries. According to these estimates, poverty in India in 2011-12 could be as low as 12.4 per cent if we use &ldquo;modified mixed reference period&rdquo; (MMRP), in which there are three recall periods depending on the nature of items. This contrasts with the Rangarajan committee estimates of 29.5 per cent. The poverty line (PL) used by the Rangarajan committee for India was around Rs 1,105 per capita per month. That translates to $2.44 per capita per day, in terms of purchasing power parity. As such, the WB&rsquo;s PL of $1.90 per capita per day is only about 78 per cent of the PL used by the Rangarajan committee. The lower PL is the reason for the lower poverty ratio estimated by the WB.<br /><br />However, the WB report also talks about the depth of poverty in terms of person-equivalent headcounts. According to the report, the depth elasticity at the global level between 1990 and 2012 was 1.18. In other words, the reductions in traditional head count ratios were accompanied by even larger reductions in person-equivalent poverty ratios. This is true in the regions where the bulk of the poor reside, such as South Asia.<br /><br />Here, we examine the depth of poverty in India in a different way &mdash; by looking at the poverty ratios using different cut-offs of the PL. The first issue is whether the poverty ratios with lowered PL cut-offs are declining as fast as those with raised PL cut-offs. The second issue is the location of the poor, that is, whether the poor are located much below the PL or around the PL.<br /><br />One conclusion is that even if we raise the PL to 125 per cent of what it is, the reduction in the poverty ratio was 9 percentage points between 2009-10 and 2011-12 (Table 1). This is also true for the poverty ratio based on 115 per cent of the PL. In the case of 85 per cent and 75 per cent of the PL, the percentage point decline was lower than those with the raised PL. But if we adjust for base poverty ratio, its decline was faster for 85 per cent of the PL and 75 per cent of the PL as compared to those between the PL and 125 per cent of the PL.<br /></div><div align="justify">&nbsp;</div><div align="justify"><img src="https://im4change.in/siteadmin/tinymce/uploaded/Table Poverty.jpg" alt="Table Poverty" width="759" height="908" /> <br /></div><div align="justify">&nbsp;</div><div align="justify">Headcount ratio is often criticised on the ground that it does not measure the &ldquo;depth&rdquo; of poverty. It is seen, however, that more than 50 per cent of the poor lie between the PL and 75 per cent of the PL. This is true for both 2009-10 and 2011-12. In fact, 65 per cent of the rural poor and 61 per cent total poor lie between the PL and 75 per cent of the PL in 2011-12. It may also be noted that many of the non-poor also live just above the PL between 115 per cent of the PL and the PL or between 125 per cent of the PL and the PL.<br /><br />Another point is that there is a negligible population below 50 per cent of the PL &mdash; less than 2 per cent in 2011-12.<br /><br />We also looked at the poverty ratios with different cut-offs of PLs for two relatively poorer states &mdash; Bihar and Odisha &mdash; and two developed states &mdash;Tamil Nadu and Gujarat (Table 2). It provides interesting results. In Bihar and Odisha, the rate of decline in poverty is lower for the raised PL of 125 per cent and 115 per cent, as compared to the PL and the lower cut-offs of 85 of the PL and 75 per cent of the PL. The decline is even faster for these two states at lower cut-offs if we take into account the base poverty ratio. The raised PLs for Odisha reveal only a marginal decline for both 125 per cent of the PL and 115 per cent of the PL. In the case of Gujarat, the decline in percentage points is higher for the raised cut-offs compared to the lowered cut-offs. If we take into account the base effect, the rate of decline is higher for the lowered cut-offs. As far as Tamil Nadu is concerned, the decline in percentage points in poverty was higher for the raised PL compared to those of the lowered PLs. However, if we take the base effect, the rate of change is more or less similar.<br /><br />As far as a concentration of poverty is concerned, it is clear that in all the four states the bulk of the poor lie between the PL and 75 per cent of the PL. In the case of two advanced states, Gujarat and Tamil Nadu, the concentration is even higher. In 2011-12, in Gujarat, 71.5 per cent of the poor were within these limits. In Tamil Nadu, the percentage of the poor falling within these limits is 63 per cent. The proportions are, however, much lower in the case of Bihar and Odisha. In both Gujarat and Tamil Nadu, the percentage of the poor falling between these limits has increased between 2009-10 and 2011-12, indicating a faster decline in the depth of poverty.<br /><br />There are three conclusions from the all-India and state-wise analysis. First, the rate of decline in poverty ratios for the lowered cut-off is similar or more than those for the PL or the raised PL. Second, poverty is concentrated around the PL. Third, the percentage of population below 50 per cent of the PL is negligible at both all-India and state levels.<br /><br />The bunching of poverty around the poverty line in India renders the problem of reducing poverty more manageable. The pace and pattern of growth have a significant impact on reducing poverty ratios. But as we have repeatedly emphasised, policymakers must pursue a two-fold strategy of letting the economy grow fast and attacking poverty directly through poverty alleviation programmes.<br /><br />&nbsp;<br /><em>Rangarajan is chairman, Madras School of Economics, Chennai and Dev is director, Indira Gandhi Institute of Development Research, Mumbai.<br /></em><br /></div>',
'lang' => 'English',
'SITE_URL' => 'https://im4change.in/',
'site_title' => 'im4change',
'adminprix' => 'admin'
]
$article_current = object(App\Model\Entity\Article) {
'id' => (int) 30010,
'title' => 'How deep is India’s poverty? -C Rangarajan and S Mahendra Dev',
'subheading' => '',
'description' => '<div align="justify">
-The Indian Express<br />
</div>
<div align="justify">
&nbsp;
</div>
<div align="justify">
<em>India&rsquo;s poor are closely bunched up near the poverty line. This could make poverty alleviation more manageable.&nbsp; </em>
</div>
<div align="justify">
&nbsp;
</div>
<div align="justify">
A recent World Bank (WB) report brought out poverty ratios across countries. According to these estimates, poverty in India in 2011-12 could be as low as 12.4 per cent if we use &ldquo;modified mixed reference period&rdquo; (MMRP), in which there are three recall periods depending on the nature of items. This contrasts with the Rangarajan committee estimates of 29.5 per cent. The poverty line (PL) used by the Rangarajan committee for India was around Rs 1,105 per capita per month. That translates to $2.44 per capita per day, in terms of purchasing power parity. As such, the WB&rsquo;s PL of $1.90 per capita per day is only about 78 per cent of the PL used by the Rangarajan committee. The lower PL is the reason for the lower poverty ratio estimated by the WB.<br />
<br />
However, the WB report also talks about the depth of poverty in terms of person-equivalent headcounts. According to the report, the depth elasticity at the global level between 1990 and 2012 was 1.18. In other words, the reductions in traditional head count ratios were accompanied by even larger reductions in person-equivalent poverty ratios. This is true in the regions where the bulk of the poor reside, such as South Asia.<br />
<br />
Here, we examine the depth of poverty in India in a different way &mdash; by looking at the poverty ratios using different cut-offs of the PL. The first issue is whether the poverty ratios with lowered PL cut-offs are declining as fast as those with raised PL cut-offs. The second issue is the location of the poor, that is, whether the poor are located much below the PL or around the PL.<br />
<br />
One conclusion is that even if we raise the PL to 125 per cent of what it is, the reduction in the poverty ratio was 9 percentage points between 2009-10 and 2011-12 (Table 1). This is also true for the poverty ratio based on 115 per cent of the PL. In the case of 85 per cent and 75 per cent of the PL, the percentage point decline was lower than those with the raised PL. But if we adjust for base poverty ratio, its decline was faster for 85 per cent of the PL and 75 per cent of the PL as compared to those between the PL and 125 per cent of the PL.<br />
</div>
<div align="justify">
&nbsp;
</div>
<div align="justify">
<img src="tinymce/uploaded/Table Poverty.jpg" alt="Table Poverty" width="759" height="908" /> <br />
</div>
<div align="justify">
&nbsp;
</div>
<div align="justify">
Headcount ratio is often criticised on the ground that it does not measure the &ldquo;depth&rdquo; of poverty. It is seen, however, that more than 50 per cent of the poor lie between the PL and 75 per cent of the PL. This is true for both 2009-10 and 2011-12. In fact, 65 per cent of the rural poor and 61 per cent total poor lie between the PL and 75 per cent of the PL in 2011-12. It may also be noted that many of the non-poor also live just above the PL between 115 per cent of the PL and the PL or between 125 per cent of the PL and the PL.<br />
<br />
Another point is that there is a negligible population below 50 per cent of the PL &mdash; less than 2 per cent in 2011-12.<br />
<br />
We also looked at the poverty ratios with different cut-offs of PLs for two relatively poorer states &mdash; Bihar and Odisha &mdash; and two developed states &mdash;Tamil Nadu and Gujarat (Table 2). It provides interesting results. In Bihar and Odisha, the rate of decline in poverty is lower for the raised PL of 125 per cent and 115 per cent, as compared to the PL and the lower cut-offs of 85 of the PL and 75 per cent of the PL. The decline is even faster for these two states at lower cut-offs if we take into account the base poverty ratio. The raised PLs for Odisha reveal only a marginal decline for both 125 per cent of the PL and 115 per cent of the PL. In the case of Gujarat, the decline in percentage points is higher for the raised cut-offs compared to the lowered cut-offs. If we take into account the base effect, the rate of decline is higher for the lowered cut-offs. As far as Tamil Nadu is concerned, the decline in percentage points in poverty was higher for the raised PL compared to those of the lowered PLs. However, if we take the base effect, the rate of change is more or less similar.<br />
<br />
As far as a concentration of poverty is concerned, it is clear that in all the four states the bulk of the poor lie between the PL and 75 per cent of the PL. In the case of two advanced states, Gujarat and Tamil Nadu, the concentration is even higher. In 2011-12, in Gujarat, 71.5 per cent of the poor were within these limits. In Tamil Nadu, the percentage of the poor falling within these limits is 63 per cent. The proportions are, however, much lower in the case of Bihar and Odisha. In both Gujarat and Tamil Nadu, the percentage of the poor falling between these limits has increased between 2009-10 and 2011-12, indicating a faster decline in the depth of poverty.<br />
<br />
There are three conclusions from the all-India and state-wise analysis. First, the rate of decline in poverty ratios for the lowered cut-off is similar or more than those for the PL or the raised PL. Second, poverty is concentrated around the PL. Third, the percentage of population below 50 per cent of the PL is negligible at both all-India and state levels.<br />
<br />
The bunching of poverty around the poverty line in India renders the problem of reducing poverty more manageable. The pace and pattern of growth have a significant impact on reducing poverty ratios. But as we have repeatedly emphasised, policymakers must pursue a two-fold strategy of letting the economy grow fast and attacking poverty directly through poverty alleviation programmes.<br />
<br />
&nbsp;<br />
<em>Rangarajan is chairman, Madras School of Economics, Chennai and Dev is director, Indira Gandhi Institute of Development Research, Mumbai.<br />
</em><br />
</div>',
'credit_writer' => 'The Indian Express, 15 December, 2015, http://indianexpress.com/article/opinion/columns/how-deep-is-indias-poverty/',
'article_img' => '',
'article_img_thumb' => '',
'status' => (int) 1,
'show_on_home' => (int) 1,
'lang' => 'EN',
'category_id' => (int) 16,
'tag_keyword' => '',
'seo_url' => 'how-deep-is-indias-poverty-c-rangarajan-and-s-mahendra-dev-4678069',
'meta_title' => null,
'meta_keywords' => null,
'meta_description' => null,
'noindex' => (int) 0,
'publish_date' => object(Cake\I18n\FrozenDate) {},
'most_visit_section_id' => null,
'article_big_img' => null,
'liveid' => (int) 4678069,
'created' => object(Cake\I18n\FrozenTime) {},
'modified' => object(Cake\I18n\FrozenTime) {},
'edate' => '',
'tags' => [
(int) 0 => object(Cake\ORM\Entity) {},
(int) 1 => object(Cake\ORM\Entity) {},
(int) 2 => object(Cake\ORM\Entity) {},
(int) 3 => object(Cake\ORM\Entity) {}
],
'category' => object(App\Model\Entity\Category) {},
'[new]' => false,
'[accessible]' => [
'*' => true,
'id' => false
],
'[dirty]' => [],
'[original]' => [],
'[virtual]' => [],
'[hasErrors]' => false,
'[errors]' => [],
'[invalid]' => [],
'[repository]' => 'Articles'
}
$articleid = (int) 30010
$metaTitle = 'LATEST NEWS UPDATES | How deep is India’s poverty? -C Rangarajan and S Mahendra Dev'
$metaKeywords = 'poverty estimate,poverty estimates,poverty line,poverty measures'
$metaDesc = '
-The Indian Express
&nbsp;
India&rsquo;s poor are closely bunched up near the poverty line. This could make poverty alleviation more manageable.&nbsp;
&nbsp;
A recent World Bank (WB) report brought out poverty ratios across countries. According to these estimates, poverty in India in 2011-12...'
$disp = '<div align="justify">-The Indian Express<br /></div><div align="justify">&nbsp;</div><div align="justify"><em>India&rsquo;s poor are closely bunched up near the poverty line. This could make poverty alleviation more manageable.&nbsp; </em></div><div align="justify">&nbsp;</div><div align="justify">A recent World Bank (WB) report brought out poverty ratios across countries. According to these estimates, poverty in India in 2011-12 could be as low as 12.4 per cent if we use &ldquo;modified mixed reference period&rdquo; (MMRP), in which there are three recall periods depending on the nature of items. This contrasts with the Rangarajan committee estimates of 29.5 per cent. The poverty line (PL) used by the Rangarajan committee for India was around Rs 1,105 per capita per month. That translates to $2.44 per capita per day, in terms of purchasing power parity. As such, the WB&rsquo;s PL of $1.90 per capita per day is only about 78 per cent of the PL used by the Rangarajan committee. The lower PL is the reason for the lower poverty ratio estimated by the WB.<br /><br />However, the WB report also talks about the depth of poverty in terms of person-equivalent headcounts. According to the report, the depth elasticity at the global level between 1990 and 2012 was 1.18. In other words, the reductions in traditional head count ratios were accompanied by even larger reductions in person-equivalent poverty ratios. This is true in the regions where the bulk of the poor reside, such as South Asia.<br /><br />Here, we examine the depth of poverty in India in a different way &mdash; by looking at the poverty ratios using different cut-offs of the PL. The first issue is whether the poverty ratios with lowered PL cut-offs are declining as fast as those with raised PL cut-offs. The second issue is the location of the poor, that is, whether the poor are located much below the PL or around the PL.<br /><br />One conclusion is that even if we raise the PL to 125 per cent of what it is, the reduction in the poverty ratio was 9 percentage points between 2009-10 and 2011-12 (Table 1). This is also true for the poverty ratio based on 115 per cent of the PL. In the case of 85 per cent and 75 per cent of the PL, the percentage point decline was lower than those with the raised PL. But if we adjust for base poverty ratio, its decline was faster for 85 per cent of the PL and 75 per cent of the PL as compared to those between the PL and 125 per cent of the PL.<br /></div><div align="justify">&nbsp;</div><div align="justify"><img src="https://im4change.in/siteadmin/tinymce/uploaded/Table Poverty.jpg" alt="Table Poverty" width="759" height="908" /> <br /></div><div align="justify">&nbsp;</div><div align="justify">Headcount ratio is often criticised on the ground that it does not measure the &ldquo;depth&rdquo; of poverty. It is seen, however, that more than 50 per cent of the poor lie between the PL and 75 per cent of the PL. This is true for both 2009-10 and 2011-12. In fact, 65 per cent of the rural poor and 61 per cent total poor lie between the PL and 75 per cent of the PL in 2011-12. It may also be noted that many of the non-poor also live just above the PL between 115 per cent of the PL and the PL or between 125 per cent of the PL and the PL.<br /><br />Another point is that there is a negligible population below 50 per cent of the PL &mdash; less than 2 per cent in 2011-12.<br /><br />We also looked at the poverty ratios with different cut-offs of PLs for two relatively poorer states &mdash; Bihar and Odisha &mdash; and two developed states &mdash;Tamil Nadu and Gujarat (Table 2). It provides interesting results. In Bihar and Odisha, the rate of decline in poverty is lower for the raised PL of 125 per cent and 115 per cent, as compared to the PL and the lower cut-offs of 85 of the PL and 75 per cent of the PL. The decline is even faster for these two states at lower cut-offs if we take into account the base poverty ratio. The raised PLs for Odisha reveal only a marginal decline for both 125 per cent of the PL and 115 per cent of the PL. In the case of Gujarat, the decline in percentage points is higher for the raised cut-offs compared to the lowered cut-offs. If we take into account the base effect, the rate of decline is higher for the lowered cut-offs. As far as Tamil Nadu is concerned, the decline in percentage points in poverty was higher for the raised PL compared to those of the lowered PLs. However, if we take the base effect, the rate of change is more or less similar.<br /><br />As far as a concentration of poverty is concerned, it is clear that in all the four states the bulk of the poor lie between the PL and 75 per cent of the PL. In the case of two advanced states, Gujarat and Tamil Nadu, the concentration is even higher. In 2011-12, in Gujarat, 71.5 per cent of the poor were within these limits. In Tamil Nadu, the percentage of the poor falling within these limits is 63 per cent. The proportions are, however, much lower in the case of Bihar and Odisha. In both Gujarat and Tamil Nadu, the percentage of the poor falling between these limits has increased between 2009-10 and 2011-12, indicating a faster decline in the depth of poverty.<br /><br />There are three conclusions from the all-India and state-wise analysis. First, the rate of decline in poverty ratios for the lowered cut-off is similar or more than those for the PL or the raised PL. Second, poverty is concentrated around the PL. Third, the percentage of population below 50 per cent of the PL is negligible at both all-India and state levels.<br /><br />The bunching of poverty around the poverty line in India renders the problem of reducing poverty more manageable. The pace and pattern of growth have a significant impact on reducing poverty ratios. But as we have repeatedly emphasised, policymakers must pursue a two-fold strategy of letting the economy grow fast and attacking poverty directly through poverty alleviation programmes.<br /><br />&nbsp;<br /><em>Rangarajan is chairman, Madras School of Economics, Chennai and Dev is director, Indira Gandhi Institute of Development Research, Mumbai.<br /></em><br /></div>'
$lang = 'English'
$SITE_URL = 'https://im4change.in/'
$site_title = 'im4change'
$adminprix = 'admin'</pre><pre class="stack-trace">include - APP/Template/Layout/printlayout.ctp, line 8
Cake\View\View::_evaluate() - CORE/src/View/View.php, line 1413
Cake\View\View::_render() - CORE/src/View/View.php, line 1374
Cake\View\View::renderLayout() - CORE/src/View/View.php, line 927
Cake\View\View::render() - CORE/src/View/View.php, line 885
Cake\Controller\Controller::render() - CORE/src/Controller/Controller.php, line 791
Cake\Http\ActionDispatcher::_invoke() - CORE/src/Http/ActionDispatcher.php, line 126
Cake\Http\ActionDispatcher::dispatch() - CORE/src/Http/ActionDispatcher.php, line 94
Cake\Http\BaseApplication::__invoke() - CORE/src/Http/BaseApplication.php, line 235
Cake\Http\Runner::__invoke() - CORE/src/Http/Runner.php, line 65
Cake\Routing\Middleware\RoutingMiddleware::__invoke() - CORE/src/Routing/Middleware/RoutingMiddleware.php, line 162
Cake\Http\Runner::__invoke() - CORE/src/Http/Runner.php, line 65
Cake\Routing\Middleware\AssetMiddleware::__invoke() - CORE/src/Routing/Middleware/AssetMiddleware.php, line 88
Cake\Http\Runner::__invoke() - CORE/src/Http/Runner.php, line 65
Cake\Error\Middleware\ErrorHandlerMiddleware::__invoke() - CORE/src/Error/Middleware/ErrorHandlerMiddleware.php, line 96
Cake\Http\Runner::__invoke() - CORE/src/Http/Runner.php, line 65
Cake\Http\Runner::run() - CORE/src/Http/Runner.php, line 51</pre></div></pre>latest-news-updates/how-deep-is-indias-poverty-c-rangarajan-and-s-mahendra-dev-4678069.html"/>
<meta http-equiv="Content-Type" content="text/html; charset=utf-8"/>
<link href="https://im4change.in/css/control.css" rel="stylesheet" type="text/css"
media="all"/>
<title>LATEST NEWS UPDATES | How deep is India’s poverty? -C Rangarajan and S Mahendra Dev | Im4change.org</title>
<meta name="description" content="
-The Indian Express
India’s poor are closely bunched up near the poverty line. This could make poverty alleviation more manageable.
A recent World Bank (WB) report brought out poverty ratios across countries. According to these estimates, poverty in India in 2011-12..."/>
<script src="https://im4change.in/js/jquery-1.10.2.js"></script>
<script type="text/javascript" src="https://im4change.in/js/jquery-migrate.min.js"></script>
<script language="javascript" type="text/javascript">
$(document).ready(function () {
var img = $("img")[0]; // Get my img elem
var pic_real_width, pic_real_height;
$("<img/>") // Make in memory copy of image to avoid css issues
.attr("src", $(img).attr("src"))
.load(function () {
pic_real_width = this.width; // Note: $(this).width() will not
pic_real_height = this.height; // work for in memory images.
});
});
</script>
<style type="text/css">
@media screen {
div.divFooter {
display: block;
}
}
@media print {
.printbutton {
display: none !important;
}
}
</style>
</head>
<body>
<table cellpadding="0" cellspacing="0" border="0" width="98%" align="center">
<tr>
<td class="top_bg">
<div class="divFooter">
<img src="https://im4change.in/images/logo1.jpg" height="59" border="0"
alt="Resource centre on India's rural distress" style="padding-top:14px;"/>
</div>
</td>
</tr>
<tr>
<td id="topspace"> </td>
</tr>
<tr id="topspace">
<td> </td>
</tr>
<tr>
<td height="50" style="border-bottom:1px solid #000; padding-top:10px;" class="printbutton">
<form><input type="button" value=" Print this page "
onclick="window.print();return false;"/></form>
</td>
</tr>
<tr>
<td width="100%">
<h1 class="news_headlines" style="font-style:normal">
<strong>How deep is India’s poverty? -C Rangarajan and S Mahendra Dev</strong></h1>
</td>
</tr>
<tr>
<td width="100%" style="font-family:Arial, 'Segoe Script', 'Segoe UI', sans-serif, serif"><font size="3">
<div align="justify">-The Indian Express<br /></div><div align="justify"> </div><div align="justify"><em>India’s poor are closely bunched up near the poverty line. This could make poverty alleviation more manageable. </em></div><div align="justify"> </div><div align="justify">A recent World Bank (WB) report brought out poverty ratios across countries. According to these estimates, poverty in India in 2011-12 could be as low as 12.4 per cent if we use “modified mixed reference period” (MMRP), in which there are three recall periods depending on the nature of items. This contrasts with the Rangarajan committee estimates of 29.5 per cent. The poverty line (PL) used by the Rangarajan committee for India was around Rs 1,105 per capita per month. That translates to $2.44 per capita per day, in terms of purchasing power parity. As such, the WB’s PL of $1.90 per capita per day is only about 78 per cent of the PL used by the Rangarajan committee. The lower PL is the reason for the lower poverty ratio estimated by the WB.<br /><br />However, the WB report also talks about the depth of poverty in terms of person-equivalent headcounts. According to the report, the depth elasticity at the global level between 1990 and 2012 was 1.18. In other words, the reductions in traditional head count ratios were accompanied by even larger reductions in person-equivalent poverty ratios. This is true in the regions where the bulk of the poor reside, such as South Asia.<br /><br />Here, we examine the depth of poverty in India in a different way — by looking at the poverty ratios using different cut-offs of the PL. The first issue is whether the poverty ratios with lowered PL cut-offs are declining as fast as those with raised PL cut-offs. The second issue is the location of the poor, that is, whether the poor are located much below the PL or around the PL.<br /><br />One conclusion is that even if we raise the PL to 125 per cent of what it is, the reduction in the poverty ratio was 9 percentage points between 2009-10 and 2011-12 (Table 1). This is also true for the poverty ratio based on 115 per cent of the PL. In the case of 85 per cent and 75 per cent of the PL, the percentage point decline was lower than those with the raised PL. But if we adjust for base poverty ratio, its decline was faster for 85 per cent of the PL and 75 per cent of the PL as compared to those between the PL and 125 per cent of the PL.<br /></div><div align="justify"> </div><div align="justify"><img src="https://im4change.in/siteadmin/tinymce/uploaded/Table Poverty.jpg" alt="Table Poverty" width="759" height="908" /> <br /></div><div align="justify"> </div><div align="justify">Headcount ratio is often criticised on the ground that it does not measure the “depth” of poverty. It is seen, however, that more than 50 per cent of the poor lie between the PL and 75 per cent of the PL. This is true for both 2009-10 and 2011-12. In fact, 65 per cent of the rural poor and 61 per cent total poor lie between the PL and 75 per cent of the PL in 2011-12. It may also be noted that many of the non-poor also live just above the PL between 115 per cent of the PL and the PL or between 125 per cent of the PL and the PL.<br /><br />Another point is that there is a negligible population below 50 per cent of the PL — less than 2 per cent in 2011-12.<br /><br />We also looked at the poverty ratios with different cut-offs of PLs for two relatively poorer states — Bihar and Odisha — and two developed states —Tamil Nadu and Gujarat (Table 2). It provides interesting results. In Bihar and Odisha, the rate of decline in poverty is lower for the raised PL of 125 per cent and 115 per cent, as compared to the PL and the lower cut-offs of 85 of the PL and 75 per cent of the PL. The decline is even faster for these two states at lower cut-offs if we take into account the base poverty ratio. The raised PLs for Odisha reveal only a marginal decline for both 125 per cent of the PL and 115 per cent of the PL. In the case of Gujarat, the decline in percentage points is higher for the raised cut-offs compared to the lowered cut-offs. If we take into account the base effect, the rate of decline is higher for the lowered cut-offs. As far as Tamil Nadu is concerned, the decline in percentage points in poverty was higher for the raised PL compared to those of the lowered PLs. However, if we take the base effect, the rate of change is more or less similar.<br /><br />As far as a concentration of poverty is concerned, it is clear that in all the four states the bulk of the poor lie between the PL and 75 per cent of the PL. In the case of two advanced states, Gujarat and Tamil Nadu, the concentration is even higher. In 2011-12, in Gujarat, 71.5 per cent of the poor were within these limits. In Tamil Nadu, the percentage of the poor falling within these limits is 63 per cent. The proportions are, however, much lower in the case of Bihar and Odisha. In both Gujarat and Tamil Nadu, the percentage of the poor falling between these limits has increased between 2009-10 and 2011-12, indicating a faster decline in the depth of poverty.<br /><br />There are three conclusions from the all-India and state-wise analysis. First, the rate of decline in poverty ratios for the lowered cut-off is similar or more than those for the PL or the raised PL. Second, poverty is concentrated around the PL. Third, the percentage of population below 50 per cent of the PL is negligible at both all-India and state levels.<br /><br />The bunching of poverty around the poverty line in India renders the problem of reducing poverty more manageable. The pace and pattern of growth have a significant impact on reducing poverty ratios. But as we have repeatedly emphasised, policymakers must pursue a two-fold strategy of letting the economy grow fast and attacking poverty directly through poverty alleviation programmes.<br /><br /> <br /><em>Rangarajan is chairman, Madras School of Economics, Chennai and Dev is director, Indira Gandhi Institute of Development Research, Mumbai.<br /></em><br /></div> </font>
</td>
</tr>
<tr>
<td> </td>
</tr>
<tr>
<td height="50" style="border-top:1px solid #000; border-bottom:1px solid #000;padding-top:10px;">
<form><input type="button" value=" Print this page "
onclick="window.print();return false;"/></form>
</td>
</tr>
</table></body>
</html>'
}
$maxBufferLength = (int) 8192
$file = '/home/brlfuser/public_html/vendor/cakephp/cakephp/src/Error/Debugger.php'
$line = (int) 853
$message = 'Unable to emit headers. Headers sent in file=/home/brlfuser/public_html/vendor/cakephp/cakephp/src/Error/Debugger.php line=853'
Cake\Http\ResponseEmitter::emit() - CORE/src/Http/ResponseEmitter.php, line 48
Cake\Http\Server::emit() - CORE/src/Http/Server.php, line 141
[main] - ROOT/webroot/index.php, line 39
Warning (2): Cannot modify header information - headers already sent by (output started at /home/brlfuser/public_html/vendor/cakephp/cakephp/src/Error/Debugger.php:853) [CORE/src/Http/ResponseEmitter.php, line 148]
$response = object(Cake\Http\Response) {
'status' => (int) 200,
'contentType' => 'text/html',
'headers' => [
'Content-Type' => [
[maximum depth reached]
]
],
'file' => null,
'fileRange' => [],
'cookies' => object(Cake\Http\Cookie\CookieCollection) {},
'cacheDirectives' => [],
'body' => '<!DOCTYPE html PUBLIC "-//W3C//DTD XHTML 1.0 Transitional//EN"
"http://www.w3.org/TR/xhtml1/DTD/xhtml1-transitional.dtd">
<html xmlns="http://www.w3.org/1999/xhtml">
<head>
<link rel="canonical" href="https://im4change.in/<pre class="cake-error"><a href="javascript:void(0);" onclick="document.getElementById('cakeErr67f6a6089de6a-trace').style.display = (document.getElementById('cakeErr67f6a6089de6a-trace').style.display == 'none' ? '' : 'none');"><b>Notice</b> (8)</a>: Undefined variable: urlPrefix [<b>APP/Template/Layout/printlayout.ctp</b>, line <b>8</b>]<div id="cakeErr67f6a6089de6a-trace" class="cake-stack-trace" style="display: none;"><a href="javascript:void(0);" onclick="document.getElementById('cakeErr67f6a6089de6a-code').style.display = (document.getElementById('cakeErr67f6a6089de6a-code').style.display == 'none' ? '' : 'none')">Code</a> <a href="javascript:void(0);" onclick="document.getElementById('cakeErr67f6a6089de6a-context').style.display = (document.getElementById('cakeErr67f6a6089de6a-context').style.display == 'none' ? '' : 'none')">Context</a><pre id="cakeErr67f6a6089de6a-code" class="cake-code-dump" style="display: none;"><code><span style="color: #000000"><span style="color: #0000BB"></span><span style="color: #007700"><</span><span style="color: #0000BB">head</span><span style="color: #007700">>
</span></span></code>
<span class="code-highlight"><code><span style="color: #000000"> <link rel="canonical" href="<span style="color: #0000BB"><?php </span><span style="color: #007700">echo </span><span style="color: #0000BB">Configure</span><span style="color: #007700">::</span><span style="color: #0000BB">read</span><span style="color: #007700">(</span><span style="color: #DD0000">'SITE_URL'</span><span style="color: #007700">); </span><span style="color: #0000BB">?><?php </span><span style="color: #007700">echo </span><span style="color: #0000BB">$urlPrefix</span><span style="color: #007700">;</span><span style="color: #0000BB">?><?php </span><span style="color: #007700">echo </span><span style="color: #0000BB">$article_current</span><span style="color: #007700">-></span><span style="color: #0000BB">category</span><span style="color: #007700">-></span><span style="color: #0000BB">slug</span><span style="color: #007700">; </span><span style="color: #0000BB">?></span>/<span style="color: #0000BB"><?php </span><span style="color: #007700">echo </span><span style="color: #0000BB">$article_current</span><span style="color: #007700">-></span><span style="color: #0000BB">seo_url</span><span style="color: #007700">; </span><span style="color: #0000BB">?></span>.html"/>
</span></code></span>
<code><span style="color: #000000"><span style="color: #0000BB"> </span><span style="color: #007700"><</span><span style="color: #0000BB">meta http</span><span style="color: #007700">-</span><span style="color: #0000BB">equiv</span><span style="color: #007700">=</span><span style="color: #DD0000">"Content-Type" </span><span style="color: #0000BB">content</span><span style="color: #007700">=</span><span style="color: #DD0000">"text/html; charset=utf-8"</span><span style="color: #007700">/>
</span></span></code></pre><pre id="cakeErr67f6a6089de6a-context" class="cake-context" style="display: none;">$viewFile = '/home/brlfuser/public_html/src/Template/Layout/printlayout.ctp'
$dataForView = [
'article_current' => object(App\Model\Entity\Article) {
'id' => (int) 30010,
'title' => 'How deep is India’s poverty? -C Rangarajan and S Mahendra Dev',
'subheading' => '',
'description' => '<div align="justify">
-The Indian Express<br />
</div>
<div align="justify">
&nbsp;
</div>
<div align="justify">
<em>India&rsquo;s poor are closely bunched up near the poverty line. This could make poverty alleviation more manageable.&nbsp; </em>
</div>
<div align="justify">
&nbsp;
</div>
<div align="justify">
A recent World Bank (WB) report brought out poverty ratios across countries. According to these estimates, poverty in India in 2011-12 could be as low as 12.4 per cent if we use &ldquo;modified mixed reference period&rdquo; (MMRP), in which there are three recall periods depending on the nature of items. This contrasts with the Rangarajan committee estimates of 29.5 per cent. The poverty line (PL) used by the Rangarajan committee for India was around Rs 1,105 per capita per month. That translates to $2.44 per capita per day, in terms of purchasing power parity. As such, the WB&rsquo;s PL of $1.90 per capita per day is only about 78 per cent of the PL used by the Rangarajan committee. The lower PL is the reason for the lower poverty ratio estimated by the WB.<br />
<br />
However, the WB report also talks about the depth of poverty in terms of person-equivalent headcounts. According to the report, the depth elasticity at the global level between 1990 and 2012 was 1.18. In other words, the reductions in traditional head count ratios were accompanied by even larger reductions in person-equivalent poverty ratios. This is true in the regions where the bulk of the poor reside, such as South Asia.<br />
<br />
Here, we examine the depth of poverty in India in a different way &mdash; by looking at the poverty ratios using different cut-offs of the PL. The first issue is whether the poverty ratios with lowered PL cut-offs are declining as fast as those with raised PL cut-offs. The second issue is the location of the poor, that is, whether the poor are located much below the PL or around the PL.<br />
<br />
One conclusion is that even if we raise the PL to 125 per cent of what it is, the reduction in the poverty ratio was 9 percentage points between 2009-10 and 2011-12 (Table 1). This is also true for the poverty ratio based on 115 per cent of the PL. In the case of 85 per cent and 75 per cent of the PL, the percentage point decline was lower than those with the raised PL. But if we adjust for base poverty ratio, its decline was faster for 85 per cent of the PL and 75 per cent of the PL as compared to those between the PL and 125 per cent of the PL.<br />
</div>
<div align="justify">
&nbsp;
</div>
<div align="justify">
<img src="tinymce/uploaded/Table Poverty.jpg" alt="Table Poverty" width="759" height="908" /> <br />
</div>
<div align="justify">
&nbsp;
</div>
<div align="justify">
Headcount ratio is often criticised on the ground that it does not measure the &ldquo;depth&rdquo; of poverty. It is seen, however, that more than 50 per cent of the poor lie between the PL and 75 per cent of the PL. This is true for both 2009-10 and 2011-12. In fact, 65 per cent of the rural poor and 61 per cent total poor lie between the PL and 75 per cent of the PL in 2011-12. It may also be noted that many of the non-poor also live just above the PL between 115 per cent of the PL and the PL or between 125 per cent of the PL and the PL.<br />
<br />
Another point is that there is a negligible population below 50 per cent of the PL &mdash; less than 2 per cent in 2011-12.<br />
<br />
We also looked at the poverty ratios with different cut-offs of PLs for two relatively poorer states &mdash; Bihar and Odisha &mdash; and two developed states &mdash;Tamil Nadu and Gujarat (Table 2). It provides interesting results. In Bihar and Odisha, the rate of decline in poverty is lower for the raised PL of 125 per cent and 115 per cent, as compared to the PL and the lower cut-offs of 85 of the PL and 75 per cent of the PL. The decline is even faster for these two states at lower cut-offs if we take into account the base poverty ratio. The raised PLs for Odisha reveal only a marginal decline for both 125 per cent of the PL and 115 per cent of the PL. In the case of Gujarat, the decline in percentage points is higher for the raised cut-offs compared to the lowered cut-offs. If we take into account the base effect, the rate of decline is higher for the lowered cut-offs. As far as Tamil Nadu is concerned, the decline in percentage points in poverty was higher for the raised PL compared to those of the lowered PLs. However, if we take the base effect, the rate of change is more or less similar.<br />
<br />
As far as a concentration of poverty is concerned, it is clear that in all the four states the bulk of the poor lie between the PL and 75 per cent of the PL. In the case of two advanced states, Gujarat and Tamil Nadu, the concentration is even higher. In 2011-12, in Gujarat, 71.5 per cent of the poor were within these limits. In Tamil Nadu, the percentage of the poor falling within these limits is 63 per cent. The proportions are, however, much lower in the case of Bihar and Odisha. In both Gujarat and Tamil Nadu, the percentage of the poor falling between these limits has increased between 2009-10 and 2011-12, indicating a faster decline in the depth of poverty.<br />
<br />
There are three conclusions from the all-India and state-wise analysis. First, the rate of decline in poverty ratios for the lowered cut-off is similar or more than those for the PL or the raised PL. Second, poverty is concentrated around the PL. Third, the percentage of population below 50 per cent of the PL is negligible at both all-India and state levels.<br />
<br />
The bunching of poverty around the poverty line in India renders the problem of reducing poverty more manageable. The pace and pattern of growth have a significant impact on reducing poverty ratios. But as we have repeatedly emphasised, policymakers must pursue a two-fold strategy of letting the economy grow fast and attacking poverty directly through poverty alleviation programmes.<br />
<br />
&nbsp;<br />
<em>Rangarajan is chairman, Madras School of Economics, Chennai and Dev is director, Indira Gandhi Institute of Development Research, Mumbai.<br />
</em><br />
</div>',
'credit_writer' => 'The Indian Express, 15 December, 2015, http://indianexpress.com/article/opinion/columns/how-deep-is-indias-poverty/',
'article_img' => '',
'article_img_thumb' => '',
'status' => (int) 1,
'show_on_home' => (int) 1,
'lang' => 'EN',
'category_id' => (int) 16,
'tag_keyword' => '',
'seo_url' => 'how-deep-is-indias-poverty-c-rangarajan-and-s-mahendra-dev-4678069',
'meta_title' => null,
'meta_keywords' => null,
'meta_description' => null,
'noindex' => (int) 0,
'publish_date' => object(Cake\I18n\FrozenDate) {},
'most_visit_section_id' => null,
'article_big_img' => null,
'liveid' => (int) 4678069,
'created' => object(Cake\I18n\FrozenTime) {},
'modified' => object(Cake\I18n\FrozenTime) {},
'edate' => '',
'tags' => [
[maximum depth reached]
],
'category' => object(App\Model\Entity\Category) {},
'[new]' => false,
'[accessible]' => [
[maximum depth reached]
],
'[dirty]' => [[maximum depth reached]],
'[original]' => [[maximum depth reached]],
'[virtual]' => [[maximum depth reached]],
'[hasErrors]' => false,
'[errors]' => [[maximum depth reached]],
'[invalid]' => [[maximum depth reached]],
'[repository]' => 'Articles'
},
'articleid' => (int) 30010,
'metaTitle' => 'LATEST NEWS UPDATES | How deep is India’s poverty? -C Rangarajan and S Mahendra Dev',
'metaKeywords' => 'poverty estimate,poverty estimates,poverty line,poverty measures',
'metaDesc' => '
-The Indian Express
&nbsp;
India&rsquo;s poor are closely bunched up near the poverty line. This could make poverty alleviation more manageable.&nbsp;
&nbsp;
A recent World Bank (WB) report brought out poverty ratios across countries. According to these estimates, poverty in India in 2011-12...',
'disp' => '<div align="justify">-The Indian Express<br /></div><div align="justify">&nbsp;</div><div align="justify"><em>India&rsquo;s poor are closely bunched up near the poverty line. This could make poverty alleviation more manageable.&nbsp; </em></div><div align="justify">&nbsp;</div><div align="justify">A recent World Bank (WB) report brought out poverty ratios across countries. According to these estimates, poverty in India in 2011-12 could be as low as 12.4 per cent if we use &ldquo;modified mixed reference period&rdquo; (MMRP), in which there are three recall periods depending on the nature of items. This contrasts with the Rangarajan committee estimates of 29.5 per cent. The poverty line (PL) used by the Rangarajan committee for India was around Rs 1,105 per capita per month. That translates to $2.44 per capita per day, in terms of purchasing power parity. As such, the WB&rsquo;s PL of $1.90 per capita per day is only about 78 per cent of the PL used by the Rangarajan committee. The lower PL is the reason for the lower poverty ratio estimated by the WB.<br /><br />However, the WB report also talks about the depth of poverty in terms of person-equivalent headcounts. According to the report, the depth elasticity at the global level between 1990 and 2012 was 1.18. In other words, the reductions in traditional head count ratios were accompanied by even larger reductions in person-equivalent poverty ratios. This is true in the regions where the bulk of the poor reside, such as South Asia.<br /><br />Here, we examine the depth of poverty in India in a different way &mdash; by looking at the poverty ratios using different cut-offs of the PL. The first issue is whether the poverty ratios with lowered PL cut-offs are declining as fast as those with raised PL cut-offs. The second issue is the location of the poor, that is, whether the poor are located much below the PL or around the PL.<br /><br />One conclusion is that even if we raise the PL to 125 per cent of what it is, the reduction in the poverty ratio was 9 percentage points between 2009-10 and 2011-12 (Table 1). This is also true for the poverty ratio based on 115 per cent of the PL. In the case of 85 per cent and 75 per cent of the PL, the percentage point decline was lower than those with the raised PL. But if we adjust for base poverty ratio, its decline was faster for 85 per cent of the PL and 75 per cent of the PL as compared to those between the PL and 125 per cent of the PL.<br /></div><div align="justify">&nbsp;</div><div align="justify"><img src="https://im4change.in/siteadmin/tinymce/uploaded/Table Poverty.jpg" alt="Table Poverty" width="759" height="908" /> <br /></div><div align="justify">&nbsp;</div><div align="justify">Headcount ratio is often criticised on the ground that it does not measure the &ldquo;depth&rdquo; of poverty. It is seen, however, that more than 50 per cent of the poor lie between the PL and 75 per cent of the PL. This is true for both 2009-10 and 2011-12. In fact, 65 per cent of the rural poor and 61 per cent total poor lie between the PL and 75 per cent of the PL in 2011-12. It may also be noted that many of the non-poor also live just above the PL between 115 per cent of the PL and the PL or between 125 per cent of the PL and the PL.<br /><br />Another point is that there is a negligible population below 50 per cent of the PL &mdash; less than 2 per cent in 2011-12.<br /><br />We also looked at the poverty ratios with different cut-offs of PLs for two relatively poorer states &mdash; Bihar and Odisha &mdash; and two developed states &mdash;Tamil Nadu and Gujarat (Table 2). It provides interesting results. In Bihar and Odisha, the rate of decline in poverty is lower for the raised PL of 125 per cent and 115 per cent, as compared to the PL and the lower cut-offs of 85 of the PL and 75 per cent of the PL. The decline is even faster for these two states at lower cut-offs if we take into account the base poverty ratio. The raised PLs for Odisha reveal only a marginal decline for both 125 per cent of the PL and 115 per cent of the PL. In the case of Gujarat, the decline in percentage points is higher for the raised cut-offs compared to the lowered cut-offs. If we take into account the base effect, the rate of decline is higher for the lowered cut-offs. As far as Tamil Nadu is concerned, the decline in percentage points in poverty was higher for the raised PL compared to those of the lowered PLs. However, if we take the base effect, the rate of change is more or less similar.<br /><br />As far as a concentration of poverty is concerned, it is clear that in all the four states the bulk of the poor lie between the PL and 75 per cent of the PL. In the case of two advanced states, Gujarat and Tamil Nadu, the concentration is even higher. In 2011-12, in Gujarat, 71.5 per cent of the poor were within these limits. In Tamil Nadu, the percentage of the poor falling within these limits is 63 per cent. The proportions are, however, much lower in the case of Bihar and Odisha. In both Gujarat and Tamil Nadu, the percentage of the poor falling between these limits has increased between 2009-10 and 2011-12, indicating a faster decline in the depth of poverty.<br /><br />There are three conclusions from the all-India and state-wise analysis. First, the rate of decline in poverty ratios for the lowered cut-off is similar or more than those for the PL or the raised PL. Second, poverty is concentrated around the PL. Third, the percentage of population below 50 per cent of the PL is negligible at both all-India and state levels.<br /><br />The bunching of poverty around the poverty line in India renders the problem of reducing poverty more manageable. The pace and pattern of growth have a significant impact on reducing poverty ratios. But as we have repeatedly emphasised, policymakers must pursue a two-fold strategy of letting the economy grow fast and attacking poverty directly through poverty alleviation programmes.<br /><br />&nbsp;<br /><em>Rangarajan is chairman, Madras School of Economics, Chennai and Dev is director, Indira Gandhi Institute of Development Research, Mumbai.<br /></em><br /></div>',
'lang' => 'English',
'SITE_URL' => 'https://im4change.in/',
'site_title' => 'im4change',
'adminprix' => 'admin'
]
$article_current = object(App\Model\Entity\Article) {
'id' => (int) 30010,
'title' => 'How deep is India’s poverty? -C Rangarajan and S Mahendra Dev',
'subheading' => '',
'description' => '<div align="justify">
-The Indian Express<br />
</div>
<div align="justify">
&nbsp;
</div>
<div align="justify">
<em>India&rsquo;s poor are closely bunched up near the poverty line. This could make poverty alleviation more manageable.&nbsp; </em>
</div>
<div align="justify">
&nbsp;
</div>
<div align="justify">
A recent World Bank (WB) report brought out poverty ratios across countries. According to these estimates, poverty in India in 2011-12 could be as low as 12.4 per cent if we use &ldquo;modified mixed reference period&rdquo; (MMRP), in which there are three recall periods depending on the nature of items. This contrasts with the Rangarajan committee estimates of 29.5 per cent. The poverty line (PL) used by the Rangarajan committee for India was around Rs 1,105 per capita per month. That translates to $2.44 per capita per day, in terms of purchasing power parity. As such, the WB&rsquo;s PL of $1.90 per capita per day is only about 78 per cent of the PL used by the Rangarajan committee. The lower PL is the reason for the lower poverty ratio estimated by the WB.<br />
<br />
However, the WB report also talks about the depth of poverty in terms of person-equivalent headcounts. According to the report, the depth elasticity at the global level between 1990 and 2012 was 1.18. In other words, the reductions in traditional head count ratios were accompanied by even larger reductions in person-equivalent poverty ratios. This is true in the regions where the bulk of the poor reside, such as South Asia.<br />
<br />
Here, we examine the depth of poverty in India in a different way &mdash; by looking at the poverty ratios using different cut-offs of the PL. The first issue is whether the poverty ratios with lowered PL cut-offs are declining as fast as those with raised PL cut-offs. The second issue is the location of the poor, that is, whether the poor are located much below the PL or around the PL.<br />
<br />
One conclusion is that even if we raise the PL to 125 per cent of what it is, the reduction in the poverty ratio was 9 percentage points between 2009-10 and 2011-12 (Table 1). This is also true for the poverty ratio based on 115 per cent of the PL. In the case of 85 per cent and 75 per cent of the PL, the percentage point decline was lower than those with the raised PL. But if we adjust for base poverty ratio, its decline was faster for 85 per cent of the PL and 75 per cent of the PL as compared to those between the PL and 125 per cent of the PL.<br />
</div>
<div align="justify">
&nbsp;
</div>
<div align="justify">
<img src="tinymce/uploaded/Table Poverty.jpg" alt="Table Poverty" width="759" height="908" /> <br />
</div>
<div align="justify">
&nbsp;
</div>
<div align="justify">
Headcount ratio is often criticised on the ground that it does not measure the &ldquo;depth&rdquo; of poverty. It is seen, however, that more than 50 per cent of the poor lie between the PL and 75 per cent of the PL. This is true for both 2009-10 and 2011-12. In fact, 65 per cent of the rural poor and 61 per cent total poor lie between the PL and 75 per cent of the PL in 2011-12. It may also be noted that many of the non-poor also live just above the PL between 115 per cent of the PL and the PL or between 125 per cent of the PL and the PL.<br />
<br />
Another point is that there is a negligible population below 50 per cent of the PL &mdash; less than 2 per cent in 2011-12.<br />
<br />
We also looked at the poverty ratios with different cut-offs of PLs for two relatively poorer states &mdash; Bihar and Odisha &mdash; and two developed states &mdash;Tamil Nadu and Gujarat (Table 2). It provides interesting results. In Bihar and Odisha, the rate of decline in poverty is lower for the raised PL of 125 per cent and 115 per cent, as compared to the PL and the lower cut-offs of 85 of the PL and 75 per cent of the PL. The decline is even faster for these two states at lower cut-offs if we take into account the base poverty ratio. The raised PLs for Odisha reveal only a marginal decline for both 125 per cent of the PL and 115 per cent of the PL. In the case of Gujarat, the decline in percentage points is higher for the raised cut-offs compared to the lowered cut-offs. If we take into account the base effect, the rate of decline is higher for the lowered cut-offs. As far as Tamil Nadu is concerned, the decline in percentage points in poverty was higher for the raised PL compared to those of the lowered PLs. However, if we take the base effect, the rate of change is more or less similar.<br />
<br />
As far as a concentration of poverty is concerned, it is clear that in all the four states the bulk of the poor lie between the PL and 75 per cent of the PL. In the case of two advanced states, Gujarat and Tamil Nadu, the concentration is even higher. In 2011-12, in Gujarat, 71.5 per cent of the poor were within these limits. In Tamil Nadu, the percentage of the poor falling within these limits is 63 per cent. The proportions are, however, much lower in the case of Bihar and Odisha. In both Gujarat and Tamil Nadu, the percentage of the poor falling between these limits has increased between 2009-10 and 2011-12, indicating a faster decline in the depth of poverty.<br />
<br />
There are three conclusions from the all-India and state-wise analysis. First, the rate of decline in poverty ratios for the lowered cut-off is similar or more than those for the PL or the raised PL. Second, poverty is concentrated around the PL. Third, the percentage of population below 50 per cent of the PL is negligible at both all-India and state levels.<br />
<br />
The bunching of poverty around the poverty line in India renders the problem of reducing poverty more manageable. The pace and pattern of growth have a significant impact on reducing poverty ratios. But as we have repeatedly emphasised, policymakers must pursue a two-fold strategy of letting the economy grow fast and attacking poverty directly through poverty alleviation programmes.<br />
<br />
&nbsp;<br />
<em>Rangarajan is chairman, Madras School of Economics, Chennai and Dev is director, Indira Gandhi Institute of Development Research, Mumbai.<br />
</em><br />
</div>',
'credit_writer' => 'The Indian Express, 15 December, 2015, http://indianexpress.com/article/opinion/columns/how-deep-is-indias-poverty/',
'article_img' => '',
'article_img_thumb' => '',
'status' => (int) 1,
'show_on_home' => (int) 1,
'lang' => 'EN',
'category_id' => (int) 16,
'tag_keyword' => '',
'seo_url' => 'how-deep-is-indias-poverty-c-rangarajan-and-s-mahendra-dev-4678069',
'meta_title' => null,
'meta_keywords' => null,
'meta_description' => null,
'noindex' => (int) 0,
'publish_date' => object(Cake\I18n\FrozenDate) {},
'most_visit_section_id' => null,
'article_big_img' => null,
'liveid' => (int) 4678069,
'created' => object(Cake\I18n\FrozenTime) {},
'modified' => object(Cake\I18n\FrozenTime) {},
'edate' => '',
'tags' => [
(int) 0 => object(Cake\ORM\Entity) {},
(int) 1 => object(Cake\ORM\Entity) {},
(int) 2 => object(Cake\ORM\Entity) {},
(int) 3 => object(Cake\ORM\Entity) {}
],
'category' => object(App\Model\Entity\Category) {},
'[new]' => false,
'[accessible]' => [
'*' => true,
'id' => false
],
'[dirty]' => [],
'[original]' => [],
'[virtual]' => [],
'[hasErrors]' => false,
'[errors]' => [],
'[invalid]' => [],
'[repository]' => 'Articles'
}
$articleid = (int) 30010
$metaTitle = 'LATEST NEWS UPDATES | How deep is India’s poverty? -C Rangarajan and S Mahendra Dev'
$metaKeywords = 'poverty estimate,poverty estimates,poverty line,poverty measures'
$metaDesc = '
-The Indian Express
&nbsp;
India&rsquo;s poor are closely bunched up near the poverty line. This could make poverty alleviation more manageable.&nbsp;
&nbsp;
A recent World Bank (WB) report brought out poverty ratios across countries. According to these estimates, poverty in India in 2011-12...'
$disp = '<div align="justify">-The Indian Express<br /></div><div align="justify">&nbsp;</div><div align="justify"><em>India&rsquo;s poor are closely bunched up near the poverty line. This could make poverty alleviation more manageable.&nbsp; </em></div><div align="justify">&nbsp;</div><div align="justify">A recent World Bank (WB) report brought out poverty ratios across countries. According to these estimates, poverty in India in 2011-12 could be as low as 12.4 per cent if we use &ldquo;modified mixed reference period&rdquo; (MMRP), in which there are three recall periods depending on the nature of items. This contrasts with the Rangarajan committee estimates of 29.5 per cent. The poverty line (PL) used by the Rangarajan committee for India was around Rs 1,105 per capita per month. That translates to $2.44 per capita per day, in terms of purchasing power parity. As such, the WB&rsquo;s PL of $1.90 per capita per day is only about 78 per cent of the PL used by the Rangarajan committee. The lower PL is the reason for the lower poverty ratio estimated by the WB.<br /><br />However, the WB report also talks about the depth of poverty in terms of person-equivalent headcounts. According to the report, the depth elasticity at the global level between 1990 and 2012 was 1.18. In other words, the reductions in traditional head count ratios were accompanied by even larger reductions in person-equivalent poverty ratios. This is true in the regions where the bulk of the poor reside, such as South Asia.<br /><br />Here, we examine the depth of poverty in India in a different way &mdash; by looking at the poverty ratios using different cut-offs of the PL. The first issue is whether the poverty ratios with lowered PL cut-offs are declining as fast as those with raised PL cut-offs. The second issue is the location of the poor, that is, whether the poor are located much below the PL or around the PL.<br /><br />One conclusion is that even if we raise the PL to 125 per cent of what it is, the reduction in the poverty ratio was 9 percentage points between 2009-10 and 2011-12 (Table 1). This is also true for the poverty ratio based on 115 per cent of the PL. In the case of 85 per cent and 75 per cent of the PL, the percentage point decline was lower than those with the raised PL. But if we adjust for base poverty ratio, its decline was faster for 85 per cent of the PL and 75 per cent of the PL as compared to those between the PL and 125 per cent of the PL.<br /></div><div align="justify">&nbsp;</div><div align="justify"><img src="https://im4change.in/siteadmin/tinymce/uploaded/Table Poverty.jpg" alt="Table Poverty" width="759" height="908" /> <br /></div><div align="justify">&nbsp;</div><div align="justify">Headcount ratio is often criticised on the ground that it does not measure the &ldquo;depth&rdquo; of poverty. It is seen, however, that more than 50 per cent of the poor lie between the PL and 75 per cent of the PL. This is true for both 2009-10 and 2011-12. In fact, 65 per cent of the rural poor and 61 per cent total poor lie between the PL and 75 per cent of the PL in 2011-12. It may also be noted that many of the non-poor also live just above the PL between 115 per cent of the PL and the PL or between 125 per cent of the PL and the PL.<br /><br />Another point is that there is a negligible population below 50 per cent of the PL &mdash; less than 2 per cent in 2011-12.<br /><br />We also looked at the poverty ratios with different cut-offs of PLs for two relatively poorer states &mdash; Bihar and Odisha &mdash; and two developed states &mdash;Tamil Nadu and Gujarat (Table 2). It provides interesting results. In Bihar and Odisha, the rate of decline in poverty is lower for the raised PL of 125 per cent and 115 per cent, as compared to the PL and the lower cut-offs of 85 of the PL and 75 per cent of the PL. The decline is even faster for these two states at lower cut-offs if we take into account the base poverty ratio. The raised PLs for Odisha reveal only a marginal decline for both 125 per cent of the PL and 115 per cent of the PL. In the case of Gujarat, the decline in percentage points is higher for the raised cut-offs compared to the lowered cut-offs. If we take into account the base effect, the rate of decline is higher for the lowered cut-offs. As far as Tamil Nadu is concerned, the decline in percentage points in poverty was higher for the raised PL compared to those of the lowered PLs. However, if we take the base effect, the rate of change is more or less similar.<br /><br />As far as a concentration of poverty is concerned, it is clear that in all the four states the bulk of the poor lie between the PL and 75 per cent of the PL. In the case of two advanced states, Gujarat and Tamil Nadu, the concentration is even higher. In 2011-12, in Gujarat, 71.5 per cent of the poor were within these limits. In Tamil Nadu, the percentage of the poor falling within these limits is 63 per cent. The proportions are, however, much lower in the case of Bihar and Odisha. In both Gujarat and Tamil Nadu, the percentage of the poor falling between these limits has increased between 2009-10 and 2011-12, indicating a faster decline in the depth of poverty.<br /><br />There are three conclusions from the all-India and state-wise analysis. First, the rate of decline in poverty ratios for the lowered cut-off is similar or more than those for the PL or the raised PL. Second, poverty is concentrated around the PL. Third, the percentage of population below 50 per cent of the PL is negligible at both all-India and state levels.<br /><br />The bunching of poverty around the poverty line in India renders the problem of reducing poverty more manageable. The pace and pattern of growth have a significant impact on reducing poverty ratios. But as we have repeatedly emphasised, policymakers must pursue a two-fold strategy of letting the economy grow fast and attacking poverty directly through poverty alleviation programmes.<br /><br />&nbsp;<br /><em>Rangarajan is chairman, Madras School of Economics, Chennai and Dev is director, Indira Gandhi Institute of Development Research, Mumbai.<br /></em><br /></div>'
$lang = 'English'
$SITE_URL = 'https://im4change.in/'
$site_title = 'im4change'
$adminprix = 'admin'</pre><pre class="stack-trace">include - APP/Template/Layout/printlayout.ctp, line 8
Cake\View\View::_evaluate() - CORE/src/View/View.php, line 1413
Cake\View\View::_render() - CORE/src/View/View.php, line 1374
Cake\View\View::renderLayout() - CORE/src/View/View.php, line 927
Cake\View\View::render() - CORE/src/View/View.php, line 885
Cake\Controller\Controller::render() - CORE/src/Controller/Controller.php, line 791
Cake\Http\ActionDispatcher::_invoke() - CORE/src/Http/ActionDispatcher.php, line 126
Cake\Http\ActionDispatcher::dispatch() - CORE/src/Http/ActionDispatcher.php, line 94
Cake\Http\BaseApplication::__invoke() - CORE/src/Http/BaseApplication.php, line 235
Cake\Http\Runner::__invoke() - CORE/src/Http/Runner.php, line 65
Cake\Routing\Middleware\RoutingMiddleware::__invoke() - CORE/src/Routing/Middleware/RoutingMiddleware.php, line 162
Cake\Http\Runner::__invoke() - CORE/src/Http/Runner.php, line 65
Cake\Routing\Middleware\AssetMiddleware::__invoke() - CORE/src/Routing/Middleware/AssetMiddleware.php, line 88
Cake\Http\Runner::__invoke() - CORE/src/Http/Runner.php, line 65
Cake\Error\Middleware\ErrorHandlerMiddleware::__invoke() - CORE/src/Error/Middleware/ErrorHandlerMiddleware.php, line 96
Cake\Http\Runner::__invoke() - CORE/src/Http/Runner.php, line 65
Cake\Http\Runner::run() - CORE/src/Http/Runner.php, line 51</pre></div></pre>latest-news-updates/how-deep-is-indias-poverty-c-rangarajan-and-s-mahendra-dev-4678069.html"/>
<meta http-equiv="Content-Type" content="text/html; charset=utf-8"/>
<link href="https://im4change.in/css/control.css" rel="stylesheet" type="text/css"
media="all"/>
<title>LATEST NEWS UPDATES | How deep is India’s poverty? -C Rangarajan and S Mahendra Dev | Im4change.org</title>
<meta name="description" content="
-The Indian Express
India’s poor are closely bunched up near the poverty line. This could make poverty alleviation more manageable.
A recent World Bank (WB) report brought out poverty ratios across countries. According to these estimates, poverty in India in 2011-12..."/>
<script src="https://im4change.in/js/jquery-1.10.2.js"></script>
<script type="text/javascript" src="https://im4change.in/js/jquery-migrate.min.js"></script>
<script language="javascript" type="text/javascript">
$(document).ready(function () {
var img = $("img")[0]; // Get my img elem
var pic_real_width, pic_real_height;
$("<img/>") // Make in memory copy of image to avoid css issues
.attr("src", $(img).attr("src"))
.load(function () {
pic_real_width = this.width; // Note: $(this).width() will not
pic_real_height = this.height; // work for in memory images.
});
});
</script>
<style type="text/css">
@media screen {
div.divFooter {
display: block;
}
}
@media print {
.printbutton {
display: none !important;
}
}
</style>
</head>
<body>
<table cellpadding="0" cellspacing="0" border="0" width="98%" align="center">
<tr>
<td class="top_bg">
<div class="divFooter">
<img src="https://im4change.in/images/logo1.jpg" height="59" border="0"
alt="Resource centre on India's rural distress" style="padding-top:14px;"/>
</div>
</td>
</tr>
<tr>
<td id="topspace"> </td>
</tr>
<tr id="topspace">
<td> </td>
</tr>
<tr>
<td height="50" style="border-bottom:1px solid #000; padding-top:10px;" class="printbutton">
<form><input type="button" value=" Print this page "
onclick="window.print();return false;"/></form>
</td>
</tr>
<tr>
<td width="100%">
<h1 class="news_headlines" style="font-style:normal">
<strong>How deep is India’s poverty? -C Rangarajan and S Mahendra Dev</strong></h1>
</td>
</tr>
<tr>
<td width="100%" style="font-family:Arial, 'Segoe Script', 'Segoe UI', sans-serif, serif"><font size="3">
<div align="justify">-The Indian Express<br /></div><div align="justify"> </div><div align="justify"><em>India’s poor are closely bunched up near the poverty line. This could make poverty alleviation more manageable. </em></div><div align="justify"> </div><div align="justify">A recent World Bank (WB) report brought out poverty ratios across countries. According to these estimates, poverty in India in 2011-12 could be as low as 12.4 per cent if we use “modified mixed reference period” (MMRP), in which there are three recall periods depending on the nature of items. This contrasts with the Rangarajan committee estimates of 29.5 per cent. The poverty line (PL) used by the Rangarajan committee for India was around Rs 1,105 per capita per month. That translates to $2.44 per capita per day, in terms of purchasing power parity. As such, the WB’s PL of $1.90 per capita per day is only about 78 per cent of the PL used by the Rangarajan committee. The lower PL is the reason for the lower poverty ratio estimated by the WB.<br /><br />However, the WB report also talks about the depth of poverty in terms of person-equivalent headcounts. According to the report, the depth elasticity at the global level between 1990 and 2012 was 1.18. In other words, the reductions in traditional head count ratios were accompanied by even larger reductions in person-equivalent poverty ratios. This is true in the regions where the bulk of the poor reside, such as South Asia.<br /><br />Here, we examine the depth of poverty in India in a different way — by looking at the poverty ratios using different cut-offs of the PL. The first issue is whether the poverty ratios with lowered PL cut-offs are declining as fast as those with raised PL cut-offs. The second issue is the location of the poor, that is, whether the poor are located much below the PL or around the PL.<br /><br />One conclusion is that even if we raise the PL to 125 per cent of what it is, the reduction in the poverty ratio was 9 percentage points between 2009-10 and 2011-12 (Table 1). This is also true for the poverty ratio based on 115 per cent of the PL. In the case of 85 per cent and 75 per cent of the PL, the percentage point decline was lower than those with the raised PL. But if we adjust for base poverty ratio, its decline was faster for 85 per cent of the PL and 75 per cent of the PL as compared to those between the PL and 125 per cent of the PL.<br /></div><div align="justify"> </div><div align="justify"><img src="https://im4change.in/siteadmin/tinymce/uploaded/Table Poverty.jpg" alt="Table Poverty" width="759" height="908" /> <br /></div><div align="justify"> </div><div align="justify">Headcount ratio is often criticised on the ground that it does not measure the “depth” of poverty. It is seen, however, that more than 50 per cent of the poor lie between the PL and 75 per cent of the PL. This is true for both 2009-10 and 2011-12. In fact, 65 per cent of the rural poor and 61 per cent total poor lie between the PL and 75 per cent of the PL in 2011-12. It may also be noted that many of the non-poor also live just above the PL between 115 per cent of the PL and the PL or between 125 per cent of the PL and the PL.<br /><br />Another point is that there is a negligible population below 50 per cent of the PL — less than 2 per cent in 2011-12.<br /><br />We also looked at the poverty ratios with different cut-offs of PLs for two relatively poorer states — Bihar and Odisha — and two developed states —Tamil Nadu and Gujarat (Table 2). It provides interesting results. In Bihar and Odisha, the rate of decline in poverty is lower for the raised PL of 125 per cent and 115 per cent, as compared to the PL and the lower cut-offs of 85 of the PL and 75 per cent of the PL. The decline is even faster for these two states at lower cut-offs if we take into account the base poverty ratio. The raised PLs for Odisha reveal only a marginal decline for both 125 per cent of the PL and 115 per cent of the PL. In the case of Gujarat, the decline in percentage points is higher for the raised cut-offs compared to the lowered cut-offs. If we take into account the base effect, the rate of decline is higher for the lowered cut-offs. As far as Tamil Nadu is concerned, the decline in percentage points in poverty was higher for the raised PL compared to those of the lowered PLs. However, if we take the base effect, the rate of change is more or less similar.<br /><br />As far as a concentration of poverty is concerned, it is clear that in all the four states the bulk of the poor lie between the PL and 75 per cent of the PL. In the case of two advanced states, Gujarat and Tamil Nadu, the concentration is even higher. In 2011-12, in Gujarat, 71.5 per cent of the poor were within these limits. In Tamil Nadu, the percentage of the poor falling within these limits is 63 per cent. The proportions are, however, much lower in the case of Bihar and Odisha. In both Gujarat and Tamil Nadu, the percentage of the poor falling between these limits has increased between 2009-10 and 2011-12, indicating a faster decline in the depth of poverty.<br /><br />There are three conclusions from the all-India and state-wise analysis. First, the rate of decline in poverty ratios for the lowered cut-off is similar or more than those for the PL or the raised PL. Second, poverty is concentrated around the PL. Third, the percentage of population below 50 per cent of the PL is negligible at both all-India and state levels.<br /><br />The bunching of poverty around the poverty line in India renders the problem of reducing poverty more manageable. The pace and pattern of growth have a significant impact on reducing poverty ratios. But as we have repeatedly emphasised, policymakers must pursue a two-fold strategy of letting the economy grow fast and attacking poverty directly through poverty alleviation programmes.<br /><br /> <br /><em>Rangarajan is chairman, Madras School of Economics, Chennai and Dev is director, Indira Gandhi Institute of Development Research, Mumbai.<br /></em><br /></div> </font>
</td>
</tr>
<tr>
<td> </td>
</tr>
<tr>
<td height="50" style="border-top:1px solid #000; border-bottom:1px solid #000;padding-top:10px;">
<form><input type="button" value=" Print this page "
onclick="window.print();return false;"/></form>
</td>
</tr>
</table></body>
</html>'
}
$reasonPhrase = 'OK'
header - [internal], line ??
Cake\Http\ResponseEmitter::emitStatusLine() - CORE/src/Http/ResponseEmitter.php, line 148
Cake\Http\ResponseEmitter::emit() - CORE/src/Http/ResponseEmitter.php, line 54
Cake\Http\Server::emit() - CORE/src/Http/Server.php, line 141
[main] - ROOT/webroot/index.php, line 39
Warning (2): Cannot modify header information - headers already sent by (output started at /home/brlfuser/public_html/vendor/cakephp/cakephp/src/Error/Debugger.php:853) [CORE/src/Http/ResponseEmitter.php, line 181]
$response = object(Cake\Http\Response) {
'status' => (int) 200,
'contentType' => 'text/html',
'headers' => [
'Content-Type' => [
[maximum depth reached]
]
],
'file' => null,
'fileRange' => [],
'cookies' => object(Cake\Http\Cookie\CookieCollection) {},
'cacheDirectives' => [],
'body' => '<!DOCTYPE html PUBLIC "-//W3C//DTD XHTML 1.0 Transitional//EN"
"http://www.w3.org/TR/xhtml1/DTD/xhtml1-transitional.dtd">
<html xmlns="http://www.w3.org/1999/xhtml">
<head>
<link rel="canonical" href="https://im4change.in/<pre class="cake-error"><a href="javascript:void(0);" onclick="document.getElementById('cakeErr67f6a6089de6a-trace').style.display = (document.getElementById('cakeErr67f6a6089de6a-trace').style.display == 'none' ? '' : 'none');"><b>Notice</b> (8)</a>: Undefined variable: urlPrefix [<b>APP/Template/Layout/printlayout.ctp</b>, line <b>8</b>]<div id="cakeErr67f6a6089de6a-trace" class="cake-stack-trace" style="display: none;"><a href="javascript:void(0);" onclick="document.getElementById('cakeErr67f6a6089de6a-code').style.display = (document.getElementById('cakeErr67f6a6089de6a-code').style.display == 'none' ? '' : 'none')">Code</a> <a href="javascript:void(0);" onclick="document.getElementById('cakeErr67f6a6089de6a-context').style.display = (document.getElementById('cakeErr67f6a6089de6a-context').style.display == 'none' ? '' : 'none')">Context</a><pre id="cakeErr67f6a6089de6a-code" class="cake-code-dump" style="display: none;"><code><span style="color: #000000"><span style="color: #0000BB"></span><span style="color: #007700"><</span><span style="color: #0000BB">head</span><span style="color: #007700">>
</span></span></code>
<span class="code-highlight"><code><span style="color: #000000"> <link rel="canonical" href="<span style="color: #0000BB"><?php </span><span style="color: #007700">echo </span><span style="color: #0000BB">Configure</span><span style="color: #007700">::</span><span style="color: #0000BB">read</span><span style="color: #007700">(</span><span style="color: #DD0000">'SITE_URL'</span><span style="color: #007700">); </span><span style="color: #0000BB">?><?php </span><span style="color: #007700">echo </span><span style="color: #0000BB">$urlPrefix</span><span style="color: #007700">;</span><span style="color: #0000BB">?><?php </span><span style="color: #007700">echo </span><span style="color: #0000BB">$article_current</span><span style="color: #007700">-></span><span style="color: #0000BB">category</span><span style="color: #007700">-></span><span style="color: #0000BB">slug</span><span style="color: #007700">; </span><span style="color: #0000BB">?></span>/<span style="color: #0000BB"><?php </span><span style="color: #007700">echo </span><span style="color: #0000BB">$article_current</span><span style="color: #007700">-></span><span style="color: #0000BB">seo_url</span><span style="color: #007700">; </span><span style="color: #0000BB">?></span>.html"/>
</span></code></span>
<code><span style="color: #000000"><span style="color: #0000BB"> </span><span style="color: #007700"><</span><span style="color: #0000BB">meta http</span><span style="color: #007700">-</span><span style="color: #0000BB">equiv</span><span style="color: #007700">=</span><span style="color: #DD0000">"Content-Type" </span><span style="color: #0000BB">content</span><span style="color: #007700">=</span><span style="color: #DD0000">"text/html; charset=utf-8"</span><span style="color: #007700">/>
</span></span></code></pre><pre id="cakeErr67f6a6089de6a-context" class="cake-context" style="display: none;">$viewFile = '/home/brlfuser/public_html/src/Template/Layout/printlayout.ctp'
$dataForView = [
'article_current' => object(App\Model\Entity\Article) {
'id' => (int) 30010,
'title' => 'How deep is India’s poverty? -C Rangarajan and S Mahendra Dev',
'subheading' => '',
'description' => '<div align="justify">
-The Indian Express<br />
</div>
<div align="justify">
&nbsp;
</div>
<div align="justify">
<em>India&rsquo;s poor are closely bunched up near the poverty line. This could make poverty alleviation more manageable.&nbsp; </em>
</div>
<div align="justify">
&nbsp;
</div>
<div align="justify">
A recent World Bank (WB) report brought out poverty ratios across countries. According to these estimates, poverty in India in 2011-12 could be as low as 12.4 per cent if we use &ldquo;modified mixed reference period&rdquo; (MMRP), in which there are three recall periods depending on the nature of items. This contrasts with the Rangarajan committee estimates of 29.5 per cent. The poverty line (PL) used by the Rangarajan committee for India was around Rs 1,105 per capita per month. That translates to $2.44 per capita per day, in terms of purchasing power parity. As such, the WB&rsquo;s PL of $1.90 per capita per day is only about 78 per cent of the PL used by the Rangarajan committee. The lower PL is the reason for the lower poverty ratio estimated by the WB.<br />
<br />
However, the WB report also talks about the depth of poverty in terms of person-equivalent headcounts. According to the report, the depth elasticity at the global level between 1990 and 2012 was 1.18. In other words, the reductions in traditional head count ratios were accompanied by even larger reductions in person-equivalent poverty ratios. This is true in the regions where the bulk of the poor reside, such as South Asia.<br />
<br />
Here, we examine the depth of poverty in India in a different way &mdash; by looking at the poverty ratios using different cut-offs of the PL. The first issue is whether the poverty ratios with lowered PL cut-offs are declining as fast as those with raised PL cut-offs. The second issue is the location of the poor, that is, whether the poor are located much below the PL or around the PL.<br />
<br />
One conclusion is that even if we raise the PL to 125 per cent of what it is, the reduction in the poverty ratio was 9 percentage points between 2009-10 and 2011-12 (Table 1). This is also true for the poverty ratio based on 115 per cent of the PL. In the case of 85 per cent and 75 per cent of the PL, the percentage point decline was lower than those with the raised PL. But if we adjust for base poverty ratio, its decline was faster for 85 per cent of the PL and 75 per cent of the PL as compared to those between the PL and 125 per cent of the PL.<br />
</div>
<div align="justify">
&nbsp;
</div>
<div align="justify">
<img src="tinymce/uploaded/Table Poverty.jpg" alt="Table Poverty" width="759" height="908" /> <br />
</div>
<div align="justify">
&nbsp;
</div>
<div align="justify">
Headcount ratio is often criticised on the ground that it does not measure the &ldquo;depth&rdquo; of poverty. It is seen, however, that more than 50 per cent of the poor lie between the PL and 75 per cent of the PL. This is true for both 2009-10 and 2011-12. In fact, 65 per cent of the rural poor and 61 per cent total poor lie between the PL and 75 per cent of the PL in 2011-12. It may also be noted that many of the non-poor also live just above the PL between 115 per cent of the PL and the PL or between 125 per cent of the PL and the PL.<br />
<br />
Another point is that there is a negligible population below 50 per cent of the PL &mdash; less than 2 per cent in 2011-12.<br />
<br />
We also looked at the poverty ratios with different cut-offs of PLs for two relatively poorer states &mdash; Bihar and Odisha &mdash; and two developed states &mdash;Tamil Nadu and Gujarat (Table 2). It provides interesting results. In Bihar and Odisha, the rate of decline in poverty is lower for the raised PL of 125 per cent and 115 per cent, as compared to the PL and the lower cut-offs of 85 of the PL and 75 per cent of the PL. The decline is even faster for these two states at lower cut-offs if we take into account the base poverty ratio. The raised PLs for Odisha reveal only a marginal decline for both 125 per cent of the PL and 115 per cent of the PL. In the case of Gujarat, the decline in percentage points is higher for the raised cut-offs compared to the lowered cut-offs. If we take into account the base effect, the rate of decline is higher for the lowered cut-offs. As far as Tamil Nadu is concerned, the decline in percentage points in poverty was higher for the raised PL compared to those of the lowered PLs. However, if we take the base effect, the rate of change is more or less similar.<br />
<br />
As far as a concentration of poverty is concerned, it is clear that in all the four states the bulk of the poor lie between the PL and 75 per cent of the PL. In the case of two advanced states, Gujarat and Tamil Nadu, the concentration is even higher. In 2011-12, in Gujarat, 71.5 per cent of the poor were within these limits. In Tamil Nadu, the percentage of the poor falling within these limits is 63 per cent. The proportions are, however, much lower in the case of Bihar and Odisha. In both Gujarat and Tamil Nadu, the percentage of the poor falling between these limits has increased between 2009-10 and 2011-12, indicating a faster decline in the depth of poverty.<br />
<br />
There are three conclusions from the all-India and state-wise analysis. First, the rate of decline in poverty ratios for the lowered cut-off is similar or more than those for the PL or the raised PL. Second, poverty is concentrated around the PL. Third, the percentage of population below 50 per cent of the PL is negligible at both all-India and state levels.<br />
<br />
The bunching of poverty around the poverty line in India renders the problem of reducing poverty more manageable. The pace and pattern of growth have a significant impact on reducing poverty ratios. But as we have repeatedly emphasised, policymakers must pursue a two-fold strategy of letting the economy grow fast and attacking poverty directly through poverty alleviation programmes.<br />
<br />
&nbsp;<br />
<em>Rangarajan is chairman, Madras School of Economics, Chennai and Dev is director, Indira Gandhi Institute of Development Research, Mumbai.<br />
</em><br />
</div>',
'credit_writer' => 'The Indian Express, 15 December, 2015, http://indianexpress.com/article/opinion/columns/how-deep-is-indias-poverty/',
'article_img' => '',
'article_img_thumb' => '',
'status' => (int) 1,
'show_on_home' => (int) 1,
'lang' => 'EN',
'category_id' => (int) 16,
'tag_keyword' => '',
'seo_url' => 'how-deep-is-indias-poverty-c-rangarajan-and-s-mahendra-dev-4678069',
'meta_title' => null,
'meta_keywords' => null,
'meta_description' => null,
'noindex' => (int) 0,
'publish_date' => object(Cake\I18n\FrozenDate) {},
'most_visit_section_id' => null,
'article_big_img' => null,
'liveid' => (int) 4678069,
'created' => object(Cake\I18n\FrozenTime) {},
'modified' => object(Cake\I18n\FrozenTime) {},
'edate' => '',
'tags' => [
[maximum depth reached]
],
'category' => object(App\Model\Entity\Category) {},
'[new]' => false,
'[accessible]' => [
[maximum depth reached]
],
'[dirty]' => [[maximum depth reached]],
'[original]' => [[maximum depth reached]],
'[virtual]' => [[maximum depth reached]],
'[hasErrors]' => false,
'[errors]' => [[maximum depth reached]],
'[invalid]' => [[maximum depth reached]],
'[repository]' => 'Articles'
},
'articleid' => (int) 30010,
'metaTitle' => 'LATEST NEWS UPDATES | How deep is India’s poverty? -C Rangarajan and S Mahendra Dev',
'metaKeywords' => 'poverty estimate,poverty estimates,poverty line,poverty measures',
'metaDesc' => '
-The Indian Express
&nbsp;
India&rsquo;s poor are closely bunched up near the poverty line. This could make poverty alleviation more manageable.&nbsp;
&nbsp;
A recent World Bank (WB) report brought out poverty ratios across countries. According to these estimates, poverty in India in 2011-12...',
'disp' => '<div align="justify">-The Indian Express<br /></div><div align="justify">&nbsp;</div><div align="justify"><em>India&rsquo;s poor are closely bunched up near the poverty line. This could make poverty alleviation more manageable.&nbsp; </em></div><div align="justify">&nbsp;</div><div align="justify">A recent World Bank (WB) report brought out poverty ratios across countries. According to these estimates, poverty in India in 2011-12 could be as low as 12.4 per cent if we use &ldquo;modified mixed reference period&rdquo; (MMRP), in which there are three recall periods depending on the nature of items. This contrasts with the Rangarajan committee estimates of 29.5 per cent. The poverty line (PL) used by the Rangarajan committee for India was around Rs 1,105 per capita per month. That translates to $2.44 per capita per day, in terms of purchasing power parity. As such, the WB&rsquo;s PL of $1.90 per capita per day is only about 78 per cent of the PL used by the Rangarajan committee. The lower PL is the reason for the lower poverty ratio estimated by the WB.<br /><br />However, the WB report also talks about the depth of poverty in terms of person-equivalent headcounts. According to the report, the depth elasticity at the global level between 1990 and 2012 was 1.18. In other words, the reductions in traditional head count ratios were accompanied by even larger reductions in person-equivalent poverty ratios. This is true in the regions where the bulk of the poor reside, such as South Asia.<br /><br />Here, we examine the depth of poverty in India in a different way &mdash; by looking at the poverty ratios using different cut-offs of the PL. The first issue is whether the poverty ratios with lowered PL cut-offs are declining as fast as those with raised PL cut-offs. The second issue is the location of the poor, that is, whether the poor are located much below the PL or around the PL.<br /><br />One conclusion is that even if we raise the PL to 125 per cent of what it is, the reduction in the poverty ratio was 9 percentage points between 2009-10 and 2011-12 (Table 1). This is also true for the poverty ratio based on 115 per cent of the PL. In the case of 85 per cent and 75 per cent of the PL, the percentage point decline was lower than those with the raised PL. But if we adjust for base poverty ratio, its decline was faster for 85 per cent of the PL and 75 per cent of the PL as compared to those between the PL and 125 per cent of the PL.<br /></div><div align="justify">&nbsp;</div><div align="justify"><img src="https://im4change.in/siteadmin/tinymce/uploaded/Table Poverty.jpg" alt="Table Poverty" width="759" height="908" /> <br /></div><div align="justify">&nbsp;</div><div align="justify">Headcount ratio is often criticised on the ground that it does not measure the &ldquo;depth&rdquo; of poverty. It is seen, however, that more than 50 per cent of the poor lie between the PL and 75 per cent of the PL. This is true for both 2009-10 and 2011-12. In fact, 65 per cent of the rural poor and 61 per cent total poor lie between the PL and 75 per cent of the PL in 2011-12. It may also be noted that many of the non-poor also live just above the PL between 115 per cent of the PL and the PL or between 125 per cent of the PL and the PL.<br /><br />Another point is that there is a negligible population below 50 per cent of the PL &mdash; less than 2 per cent in 2011-12.<br /><br />We also looked at the poverty ratios with different cut-offs of PLs for two relatively poorer states &mdash; Bihar and Odisha &mdash; and two developed states &mdash;Tamil Nadu and Gujarat (Table 2). It provides interesting results. In Bihar and Odisha, the rate of decline in poverty is lower for the raised PL of 125 per cent and 115 per cent, as compared to the PL and the lower cut-offs of 85 of the PL and 75 per cent of the PL. The decline is even faster for these two states at lower cut-offs if we take into account the base poverty ratio. The raised PLs for Odisha reveal only a marginal decline for both 125 per cent of the PL and 115 per cent of the PL. In the case of Gujarat, the decline in percentage points is higher for the raised cut-offs compared to the lowered cut-offs. If we take into account the base effect, the rate of decline is higher for the lowered cut-offs. As far as Tamil Nadu is concerned, the decline in percentage points in poverty was higher for the raised PL compared to those of the lowered PLs. However, if we take the base effect, the rate of change is more or less similar.<br /><br />As far as a concentration of poverty is concerned, it is clear that in all the four states the bulk of the poor lie between the PL and 75 per cent of the PL. In the case of two advanced states, Gujarat and Tamil Nadu, the concentration is even higher. In 2011-12, in Gujarat, 71.5 per cent of the poor were within these limits. In Tamil Nadu, the percentage of the poor falling within these limits is 63 per cent. The proportions are, however, much lower in the case of Bihar and Odisha. In both Gujarat and Tamil Nadu, the percentage of the poor falling between these limits has increased between 2009-10 and 2011-12, indicating a faster decline in the depth of poverty.<br /><br />There are three conclusions from the all-India and state-wise analysis. First, the rate of decline in poverty ratios for the lowered cut-off is similar or more than those for the PL or the raised PL. Second, poverty is concentrated around the PL. Third, the percentage of population below 50 per cent of the PL is negligible at both all-India and state levels.<br /><br />The bunching of poverty around the poverty line in India renders the problem of reducing poverty more manageable. The pace and pattern of growth have a significant impact on reducing poverty ratios. But as we have repeatedly emphasised, policymakers must pursue a two-fold strategy of letting the economy grow fast and attacking poverty directly through poverty alleviation programmes.<br /><br />&nbsp;<br /><em>Rangarajan is chairman, Madras School of Economics, Chennai and Dev is director, Indira Gandhi Institute of Development Research, Mumbai.<br /></em><br /></div>',
'lang' => 'English',
'SITE_URL' => 'https://im4change.in/',
'site_title' => 'im4change',
'adminprix' => 'admin'
]
$article_current = object(App\Model\Entity\Article) {
'id' => (int) 30010,
'title' => 'How deep is India’s poverty? -C Rangarajan and S Mahendra Dev',
'subheading' => '',
'description' => '<div align="justify">
-The Indian Express<br />
</div>
<div align="justify">
&nbsp;
</div>
<div align="justify">
<em>India&rsquo;s poor are closely bunched up near the poverty line. This could make poverty alleviation more manageable.&nbsp; </em>
</div>
<div align="justify">
&nbsp;
</div>
<div align="justify">
A recent World Bank (WB) report brought out poverty ratios across countries. According to these estimates, poverty in India in 2011-12 could be as low as 12.4 per cent if we use &ldquo;modified mixed reference period&rdquo; (MMRP), in which there are three recall periods depending on the nature of items. This contrasts with the Rangarajan committee estimates of 29.5 per cent. The poverty line (PL) used by the Rangarajan committee for India was around Rs 1,105 per capita per month. That translates to $2.44 per capita per day, in terms of purchasing power parity. As such, the WB&rsquo;s PL of $1.90 per capita per day is only about 78 per cent of the PL used by the Rangarajan committee. The lower PL is the reason for the lower poverty ratio estimated by the WB.<br />
<br />
However, the WB report also talks about the depth of poverty in terms of person-equivalent headcounts. According to the report, the depth elasticity at the global level between 1990 and 2012 was 1.18. In other words, the reductions in traditional head count ratios were accompanied by even larger reductions in person-equivalent poverty ratios. This is true in the regions where the bulk of the poor reside, such as South Asia.<br />
<br />
Here, we examine the depth of poverty in India in a different way &mdash; by looking at the poverty ratios using different cut-offs of the PL. The first issue is whether the poverty ratios with lowered PL cut-offs are declining as fast as those with raised PL cut-offs. The second issue is the location of the poor, that is, whether the poor are located much below the PL or around the PL.<br />
<br />
One conclusion is that even if we raise the PL to 125 per cent of what it is, the reduction in the poverty ratio was 9 percentage points between 2009-10 and 2011-12 (Table 1). This is also true for the poverty ratio based on 115 per cent of the PL. In the case of 85 per cent and 75 per cent of the PL, the percentage point decline was lower than those with the raised PL. But if we adjust for base poverty ratio, its decline was faster for 85 per cent of the PL and 75 per cent of the PL as compared to those between the PL and 125 per cent of the PL.<br />
</div>
<div align="justify">
&nbsp;
</div>
<div align="justify">
<img src="tinymce/uploaded/Table Poverty.jpg" alt="Table Poverty" width="759" height="908" /> <br />
</div>
<div align="justify">
&nbsp;
</div>
<div align="justify">
Headcount ratio is often criticised on the ground that it does not measure the &ldquo;depth&rdquo; of poverty. It is seen, however, that more than 50 per cent of the poor lie between the PL and 75 per cent of the PL. This is true for both 2009-10 and 2011-12. In fact, 65 per cent of the rural poor and 61 per cent total poor lie between the PL and 75 per cent of the PL in 2011-12. It may also be noted that many of the non-poor also live just above the PL between 115 per cent of the PL and the PL or between 125 per cent of the PL and the PL.<br />
<br />
Another point is that there is a negligible population below 50 per cent of the PL &mdash; less than 2 per cent in 2011-12.<br />
<br />
We also looked at the poverty ratios with different cut-offs of PLs for two relatively poorer states &mdash; Bihar and Odisha &mdash; and two developed states &mdash;Tamil Nadu and Gujarat (Table 2). It provides interesting results. In Bihar and Odisha, the rate of decline in poverty is lower for the raised PL of 125 per cent and 115 per cent, as compared to the PL and the lower cut-offs of 85 of the PL and 75 per cent of the PL. The decline is even faster for these two states at lower cut-offs if we take into account the base poverty ratio. The raised PLs for Odisha reveal only a marginal decline for both 125 per cent of the PL and 115 per cent of the PL. In the case of Gujarat, the decline in percentage points is higher for the raised cut-offs compared to the lowered cut-offs. If we take into account the base effect, the rate of decline is higher for the lowered cut-offs. As far as Tamil Nadu is concerned, the decline in percentage points in poverty was higher for the raised PL compared to those of the lowered PLs. However, if we take the base effect, the rate of change is more or less similar.<br />
<br />
As far as a concentration of poverty is concerned, it is clear that in all the four states the bulk of the poor lie between the PL and 75 per cent of the PL. In the case of two advanced states, Gujarat and Tamil Nadu, the concentration is even higher. In 2011-12, in Gujarat, 71.5 per cent of the poor were within these limits. In Tamil Nadu, the percentage of the poor falling within these limits is 63 per cent. The proportions are, however, much lower in the case of Bihar and Odisha. In both Gujarat and Tamil Nadu, the percentage of the poor falling between these limits has increased between 2009-10 and 2011-12, indicating a faster decline in the depth of poverty.<br />
<br />
There are three conclusions from the all-India and state-wise analysis. First, the rate of decline in poverty ratios for the lowered cut-off is similar or more than those for the PL or the raised PL. Second, poverty is concentrated around the PL. Third, the percentage of population below 50 per cent of the PL is negligible at both all-India and state levels.<br />
<br />
The bunching of poverty around the poverty line in India renders the problem of reducing poverty more manageable. The pace and pattern of growth have a significant impact on reducing poverty ratios. But as we have repeatedly emphasised, policymakers must pursue a two-fold strategy of letting the economy grow fast and attacking poverty directly through poverty alleviation programmes.<br />
<br />
&nbsp;<br />
<em>Rangarajan is chairman, Madras School of Economics, Chennai and Dev is director, Indira Gandhi Institute of Development Research, Mumbai.<br />
</em><br />
</div>',
'credit_writer' => 'The Indian Express, 15 December, 2015, http://indianexpress.com/article/opinion/columns/how-deep-is-indias-poverty/',
'article_img' => '',
'article_img_thumb' => '',
'status' => (int) 1,
'show_on_home' => (int) 1,
'lang' => 'EN',
'category_id' => (int) 16,
'tag_keyword' => '',
'seo_url' => 'how-deep-is-indias-poverty-c-rangarajan-and-s-mahendra-dev-4678069',
'meta_title' => null,
'meta_keywords' => null,
'meta_description' => null,
'noindex' => (int) 0,
'publish_date' => object(Cake\I18n\FrozenDate) {},
'most_visit_section_id' => null,
'article_big_img' => null,
'liveid' => (int) 4678069,
'created' => object(Cake\I18n\FrozenTime) {},
'modified' => object(Cake\I18n\FrozenTime) {},
'edate' => '',
'tags' => [
(int) 0 => object(Cake\ORM\Entity) {},
(int) 1 => object(Cake\ORM\Entity) {},
(int) 2 => object(Cake\ORM\Entity) {},
(int) 3 => object(Cake\ORM\Entity) {}
],
'category' => object(App\Model\Entity\Category) {},
'[new]' => false,
'[accessible]' => [
'*' => true,
'id' => false
],
'[dirty]' => [],
'[original]' => [],
'[virtual]' => [],
'[hasErrors]' => false,
'[errors]' => [],
'[invalid]' => [],
'[repository]' => 'Articles'
}
$articleid = (int) 30010
$metaTitle = 'LATEST NEWS UPDATES | How deep is India’s poverty? -C Rangarajan and S Mahendra Dev'
$metaKeywords = 'poverty estimate,poverty estimates,poverty line,poverty measures'
$metaDesc = '
-The Indian Express
&nbsp;
India&rsquo;s poor are closely bunched up near the poverty line. This could make poverty alleviation more manageable.&nbsp;
&nbsp;
A recent World Bank (WB) report brought out poverty ratios across countries. According to these estimates, poverty in India in 2011-12...'
$disp = '<div align="justify">-The Indian Express<br /></div><div align="justify">&nbsp;</div><div align="justify"><em>India&rsquo;s poor are closely bunched up near the poverty line. This could make poverty alleviation more manageable.&nbsp; </em></div><div align="justify">&nbsp;</div><div align="justify">A recent World Bank (WB) report brought out poverty ratios across countries. According to these estimates, poverty in India in 2011-12 could be as low as 12.4 per cent if we use &ldquo;modified mixed reference period&rdquo; (MMRP), in which there are three recall periods depending on the nature of items. This contrasts with the Rangarajan committee estimates of 29.5 per cent. The poverty line (PL) used by the Rangarajan committee for India was around Rs 1,105 per capita per month. That translates to $2.44 per capita per day, in terms of purchasing power parity. As such, the WB&rsquo;s PL of $1.90 per capita per day is only about 78 per cent of the PL used by the Rangarajan committee. The lower PL is the reason for the lower poverty ratio estimated by the WB.<br /><br />However, the WB report also talks about the depth of poverty in terms of person-equivalent headcounts. According to the report, the depth elasticity at the global level between 1990 and 2012 was 1.18. In other words, the reductions in traditional head count ratios were accompanied by even larger reductions in person-equivalent poverty ratios. This is true in the regions where the bulk of the poor reside, such as South Asia.<br /><br />Here, we examine the depth of poverty in India in a different way &mdash; by looking at the poverty ratios using different cut-offs of the PL. The first issue is whether the poverty ratios with lowered PL cut-offs are declining as fast as those with raised PL cut-offs. The second issue is the location of the poor, that is, whether the poor are located much below the PL or around the PL.<br /><br />One conclusion is that even if we raise the PL to 125 per cent of what it is, the reduction in the poverty ratio was 9 percentage points between 2009-10 and 2011-12 (Table 1). This is also true for the poverty ratio based on 115 per cent of the PL. In the case of 85 per cent and 75 per cent of the PL, the percentage point decline was lower than those with the raised PL. But if we adjust for base poverty ratio, its decline was faster for 85 per cent of the PL and 75 per cent of the PL as compared to those between the PL and 125 per cent of the PL.<br /></div><div align="justify">&nbsp;</div><div align="justify"><img src="https://im4change.in/siteadmin/tinymce/uploaded/Table Poverty.jpg" alt="Table Poverty" width="759" height="908" /> <br /></div><div align="justify">&nbsp;</div><div align="justify">Headcount ratio is often criticised on the ground that it does not measure the &ldquo;depth&rdquo; of poverty. It is seen, however, that more than 50 per cent of the poor lie between the PL and 75 per cent of the PL. This is true for both 2009-10 and 2011-12. In fact, 65 per cent of the rural poor and 61 per cent total poor lie between the PL and 75 per cent of the PL in 2011-12. It may also be noted that many of the non-poor also live just above the PL between 115 per cent of the PL and the PL or between 125 per cent of the PL and the PL.<br /><br />Another point is that there is a negligible population below 50 per cent of the PL &mdash; less than 2 per cent in 2011-12.<br /><br />We also looked at the poverty ratios with different cut-offs of PLs for two relatively poorer states &mdash; Bihar and Odisha &mdash; and two developed states &mdash;Tamil Nadu and Gujarat (Table 2). It provides interesting results. In Bihar and Odisha, the rate of decline in poverty is lower for the raised PL of 125 per cent and 115 per cent, as compared to the PL and the lower cut-offs of 85 of the PL and 75 per cent of the PL. The decline is even faster for these two states at lower cut-offs if we take into account the base poverty ratio. The raised PLs for Odisha reveal only a marginal decline for both 125 per cent of the PL and 115 per cent of the PL. In the case of Gujarat, the decline in percentage points is higher for the raised cut-offs compared to the lowered cut-offs. If we take into account the base effect, the rate of decline is higher for the lowered cut-offs. As far as Tamil Nadu is concerned, the decline in percentage points in poverty was higher for the raised PL compared to those of the lowered PLs. However, if we take the base effect, the rate of change is more or less similar.<br /><br />As far as a concentration of poverty is concerned, it is clear that in all the four states the bulk of the poor lie between the PL and 75 per cent of the PL. In the case of two advanced states, Gujarat and Tamil Nadu, the concentration is even higher. In 2011-12, in Gujarat, 71.5 per cent of the poor were within these limits. In Tamil Nadu, the percentage of the poor falling within these limits is 63 per cent. The proportions are, however, much lower in the case of Bihar and Odisha. In both Gujarat and Tamil Nadu, the percentage of the poor falling between these limits has increased between 2009-10 and 2011-12, indicating a faster decline in the depth of poverty.<br /><br />There are three conclusions from the all-India and state-wise analysis. First, the rate of decline in poverty ratios for the lowered cut-off is similar or more than those for the PL or the raised PL. Second, poverty is concentrated around the PL. Third, the percentage of population below 50 per cent of the PL is negligible at both all-India and state levels.<br /><br />The bunching of poverty around the poverty line in India renders the problem of reducing poverty more manageable. The pace and pattern of growth have a significant impact on reducing poverty ratios. But as we have repeatedly emphasised, policymakers must pursue a two-fold strategy of letting the economy grow fast and attacking poverty directly through poverty alleviation programmes.<br /><br />&nbsp;<br /><em>Rangarajan is chairman, Madras School of Economics, Chennai and Dev is director, Indira Gandhi Institute of Development Research, Mumbai.<br /></em><br /></div>'
$lang = 'English'
$SITE_URL = 'https://im4change.in/'
$site_title = 'im4change'
$adminprix = 'admin'</pre><pre class="stack-trace">include - APP/Template/Layout/printlayout.ctp, line 8
Cake\View\View::_evaluate() - CORE/src/View/View.php, line 1413
Cake\View\View::_render() - CORE/src/View/View.php, line 1374
Cake\View\View::renderLayout() - CORE/src/View/View.php, line 927
Cake\View\View::render() - CORE/src/View/View.php, line 885
Cake\Controller\Controller::render() - CORE/src/Controller/Controller.php, line 791
Cake\Http\ActionDispatcher::_invoke() - CORE/src/Http/ActionDispatcher.php, line 126
Cake\Http\ActionDispatcher::dispatch() - CORE/src/Http/ActionDispatcher.php, line 94
Cake\Http\BaseApplication::__invoke() - CORE/src/Http/BaseApplication.php, line 235
Cake\Http\Runner::__invoke() - CORE/src/Http/Runner.php, line 65
Cake\Routing\Middleware\RoutingMiddleware::__invoke() - CORE/src/Routing/Middleware/RoutingMiddleware.php, line 162
Cake\Http\Runner::__invoke() - CORE/src/Http/Runner.php, line 65
Cake\Routing\Middleware\AssetMiddleware::__invoke() - CORE/src/Routing/Middleware/AssetMiddleware.php, line 88
Cake\Http\Runner::__invoke() - CORE/src/Http/Runner.php, line 65
Cake\Error\Middleware\ErrorHandlerMiddleware::__invoke() - CORE/src/Error/Middleware/ErrorHandlerMiddleware.php, line 96
Cake\Http\Runner::__invoke() - CORE/src/Http/Runner.php, line 65
Cake\Http\Runner::run() - CORE/src/Http/Runner.php, line 51</pre></div></pre>latest-news-updates/how-deep-is-indias-poverty-c-rangarajan-and-s-mahendra-dev-4678069.html"/>
<meta http-equiv="Content-Type" content="text/html; charset=utf-8"/>
<link href="https://im4change.in/css/control.css" rel="stylesheet" type="text/css"
media="all"/>
<title>LATEST NEWS UPDATES | How deep is India’s poverty? -C Rangarajan and S Mahendra Dev | Im4change.org</title>
<meta name="description" content="
-The Indian Express
India’s poor are closely bunched up near the poverty line. This could make poverty alleviation more manageable.
A recent World Bank (WB) report brought out poverty ratios across countries. According to these estimates, poverty in India in 2011-12..."/>
<script src="https://im4change.in/js/jquery-1.10.2.js"></script>
<script type="text/javascript" src="https://im4change.in/js/jquery-migrate.min.js"></script>
<script language="javascript" type="text/javascript">
$(document).ready(function () {
var img = $("img")[0]; // Get my img elem
var pic_real_width, pic_real_height;
$("<img/>") // Make in memory copy of image to avoid css issues
.attr("src", $(img).attr("src"))
.load(function () {
pic_real_width = this.width; // Note: $(this).width() will not
pic_real_height = this.height; // work for in memory images.
});
});
</script>
<style type="text/css">
@media screen {
div.divFooter {
display: block;
}
}
@media print {
.printbutton {
display: none !important;
}
}
</style>
</head>
<body>
<table cellpadding="0" cellspacing="0" border="0" width="98%" align="center">
<tr>
<td class="top_bg">
<div class="divFooter">
<img src="https://im4change.in/images/logo1.jpg" height="59" border="0"
alt="Resource centre on India's rural distress" style="padding-top:14px;"/>
</div>
</td>
</tr>
<tr>
<td id="topspace"> </td>
</tr>
<tr id="topspace">
<td> </td>
</tr>
<tr>
<td height="50" style="border-bottom:1px solid #000; padding-top:10px;" class="printbutton">
<form><input type="button" value=" Print this page "
onclick="window.print();return false;"/></form>
</td>
</tr>
<tr>
<td width="100%">
<h1 class="news_headlines" style="font-style:normal">
<strong>How deep is India’s poverty? -C Rangarajan and S Mahendra Dev</strong></h1>
</td>
</tr>
<tr>
<td width="100%" style="font-family:Arial, 'Segoe Script', 'Segoe UI', sans-serif, serif"><font size="3">
<div align="justify">-The Indian Express<br /></div><div align="justify"> </div><div align="justify"><em>India’s poor are closely bunched up near the poverty line. This could make poverty alleviation more manageable. </em></div><div align="justify"> </div><div align="justify">A recent World Bank (WB) report brought out poverty ratios across countries. According to these estimates, poverty in India in 2011-12 could be as low as 12.4 per cent if we use “modified mixed reference period” (MMRP), in which there are three recall periods depending on the nature of items. This contrasts with the Rangarajan committee estimates of 29.5 per cent. The poverty line (PL) used by the Rangarajan committee for India was around Rs 1,105 per capita per month. That translates to $2.44 per capita per day, in terms of purchasing power parity. As such, the WB’s PL of $1.90 per capita per day is only about 78 per cent of the PL used by the Rangarajan committee. The lower PL is the reason for the lower poverty ratio estimated by the WB.<br /><br />However, the WB report also talks about the depth of poverty in terms of person-equivalent headcounts. According to the report, the depth elasticity at the global level between 1990 and 2012 was 1.18. In other words, the reductions in traditional head count ratios were accompanied by even larger reductions in person-equivalent poverty ratios. This is true in the regions where the bulk of the poor reside, such as South Asia.<br /><br />Here, we examine the depth of poverty in India in a different way — by looking at the poverty ratios using different cut-offs of the PL. The first issue is whether the poverty ratios with lowered PL cut-offs are declining as fast as those with raised PL cut-offs. The second issue is the location of the poor, that is, whether the poor are located much below the PL or around the PL.<br /><br />One conclusion is that even if we raise the PL to 125 per cent of what it is, the reduction in the poverty ratio was 9 percentage points between 2009-10 and 2011-12 (Table 1). This is also true for the poverty ratio based on 115 per cent of the PL. In the case of 85 per cent and 75 per cent of the PL, the percentage point decline was lower than those with the raised PL. But if we adjust for base poverty ratio, its decline was faster for 85 per cent of the PL and 75 per cent of the PL as compared to those between the PL and 125 per cent of the PL.<br /></div><div align="justify"> </div><div align="justify"><img src="https://im4change.in/siteadmin/tinymce/uploaded/Table Poverty.jpg" alt="Table Poverty" width="759" height="908" /> <br /></div><div align="justify"> </div><div align="justify">Headcount ratio is often criticised on the ground that it does not measure the “depth” of poverty. It is seen, however, that more than 50 per cent of the poor lie between the PL and 75 per cent of the PL. This is true for both 2009-10 and 2011-12. In fact, 65 per cent of the rural poor and 61 per cent total poor lie between the PL and 75 per cent of the PL in 2011-12. It may also be noted that many of the non-poor also live just above the PL between 115 per cent of the PL and the PL or between 125 per cent of the PL and the PL.<br /><br />Another point is that there is a negligible population below 50 per cent of the PL — less than 2 per cent in 2011-12.<br /><br />We also looked at the poverty ratios with different cut-offs of PLs for two relatively poorer states — Bihar and Odisha — and two developed states —Tamil Nadu and Gujarat (Table 2). It provides interesting results. In Bihar and Odisha, the rate of decline in poverty is lower for the raised PL of 125 per cent and 115 per cent, as compared to the PL and the lower cut-offs of 85 of the PL and 75 per cent of the PL. The decline is even faster for these two states at lower cut-offs if we take into account the base poverty ratio. The raised PLs for Odisha reveal only a marginal decline for both 125 per cent of the PL and 115 per cent of the PL. In the case of Gujarat, the decline in percentage points is higher for the raised cut-offs compared to the lowered cut-offs. If we take into account the base effect, the rate of decline is higher for the lowered cut-offs. As far as Tamil Nadu is concerned, the decline in percentage points in poverty was higher for the raised PL compared to those of the lowered PLs. However, if we take the base effect, the rate of change is more or less similar.<br /><br />As far as a concentration of poverty is concerned, it is clear that in all the four states the bulk of the poor lie between the PL and 75 per cent of the PL. In the case of two advanced states, Gujarat and Tamil Nadu, the concentration is even higher. In 2011-12, in Gujarat, 71.5 per cent of the poor were within these limits. In Tamil Nadu, the percentage of the poor falling within these limits is 63 per cent. The proportions are, however, much lower in the case of Bihar and Odisha. In both Gujarat and Tamil Nadu, the percentage of the poor falling between these limits has increased between 2009-10 and 2011-12, indicating a faster decline in the depth of poverty.<br /><br />There are three conclusions from the all-India and state-wise analysis. First, the rate of decline in poverty ratios for the lowered cut-off is similar or more than those for the PL or the raised PL. Second, poverty is concentrated around the PL. Third, the percentage of population below 50 per cent of the PL is negligible at both all-India and state levels.<br /><br />The bunching of poverty around the poverty line in India renders the problem of reducing poverty more manageable. The pace and pattern of growth have a significant impact on reducing poverty ratios. But as we have repeatedly emphasised, policymakers must pursue a two-fold strategy of letting the economy grow fast and attacking poverty directly through poverty alleviation programmes.<br /><br /> <br /><em>Rangarajan is chairman, Madras School of Economics, Chennai and Dev is director, Indira Gandhi Institute of Development Research, Mumbai.<br /></em><br /></div> </font>
</td>
</tr>
<tr>
<td> </td>
</tr>
<tr>
<td height="50" style="border-top:1px solid #000; border-bottom:1px solid #000;padding-top:10px;">
<form><input type="button" value=" Print this page "
onclick="window.print();return false;"/></form>
</td>
</tr>
</table></body>
</html>'
}
$cookies = []
$values = [
(int) 0 => 'text/html; charset=UTF-8'
]
$name = 'Content-Type'
$first = true
$value = 'text/html; charset=UTF-8'
header - [internal], line ??
Cake\Http\ResponseEmitter::emitHeaders() - CORE/src/Http/ResponseEmitter.php, line 181
Cake\Http\ResponseEmitter::emit() - CORE/src/Http/ResponseEmitter.php, line 55
Cake\Http\Server::emit() - CORE/src/Http/Server.php, line 141
[main] - ROOT/webroot/index.php, line 39
Notice (8): Undefined variable: urlPrefix [APP/Template/Layout/printlayout.ctp, line 8]
$viewFile = '/home/brlfuser/public_html/src/Template/Layout/printlayout.ctp'
$dataForView = [
'article_current' => object(App\Model\Entity\Article) {
'id' => (int) 30010,
'title' => 'How deep is India’s poverty? -C Rangarajan and S Mahendra Dev',
'subheading' => '',
'description' => '<div align="justify">
-The Indian Express<br />
</div>
<div align="justify">
</div>
<div align="justify">
<em>India’s poor are closely bunched up near the poverty line. This could make poverty alleviation more manageable. </em>
</div>
<div align="justify">
</div>
<div align="justify">
A recent World Bank (WB) report brought out poverty ratios across countries. According to these estimates, poverty in India in 2011-12 could be as low as 12.4 per cent if we use “modified mixed reference period” (MMRP), in which there are three recall periods depending on the nature of items. This contrasts with the Rangarajan committee estimates of 29.5 per cent. The poverty line (PL) used by the Rangarajan committee for India was around Rs 1,105 per capita per month. That translates to $2.44 per capita per day, in terms of purchasing power parity. As such, the WB’s PL of $1.90 per capita per day is only about 78 per cent of the PL used by the Rangarajan committee. The lower PL is the reason for the lower poverty ratio estimated by the WB.<br />
<br />
However, the WB report also talks about the depth of poverty in terms of person-equivalent headcounts. According to the report, the depth elasticity at the global level between 1990 and 2012 was 1.18. In other words, the reductions in traditional head count ratios were accompanied by even larger reductions in person-equivalent poverty ratios. This is true in the regions where the bulk of the poor reside, such as South Asia.<br />
<br />
Here, we examine the depth of poverty in India in a different way — by looking at the poverty ratios using different cut-offs of the PL. The first issue is whether the poverty ratios with lowered PL cut-offs are declining as fast as those with raised PL cut-offs. The second issue is the location of the poor, that is, whether the poor are located much below the PL or around the PL.<br />
<br />
One conclusion is that even if we raise the PL to 125 per cent of what it is, the reduction in the poverty ratio was 9 percentage points between 2009-10 and 2011-12 (Table 1). This is also true for the poverty ratio based on 115 per cent of the PL. In the case of 85 per cent and 75 per cent of the PL, the percentage point decline was lower than those with the raised PL. But if we adjust for base poverty ratio, its decline was faster for 85 per cent of the PL and 75 per cent of the PL as compared to those between the PL and 125 per cent of the PL.<br />
</div>
<div align="justify">
</div>
<div align="justify">
<img src="tinymce/uploaded/Table Poverty.jpg" alt="Table Poverty" width="759" height="908" /> <br />
</div>
<div align="justify">
</div>
<div align="justify">
Headcount ratio is often criticised on the ground that it does not measure the “depth” of poverty. It is seen, however, that more than 50 per cent of the poor lie between the PL and 75 per cent of the PL. This is true for both 2009-10 and 2011-12. In fact, 65 per cent of the rural poor and 61 per cent total poor lie between the PL and 75 per cent of the PL in 2011-12. It may also be noted that many of the non-poor also live just above the PL between 115 per cent of the PL and the PL or between 125 per cent of the PL and the PL.<br />
<br />
Another point is that there is a negligible population below 50 per cent of the PL — less than 2 per cent in 2011-12.<br />
<br />
We also looked at the poverty ratios with different cut-offs of PLs for two relatively poorer states — Bihar and Odisha — and two developed states —Tamil Nadu and Gujarat (Table 2). It provides interesting results. In Bihar and Odisha, the rate of decline in poverty is lower for the raised PL of 125 per cent and 115 per cent, as compared to the PL and the lower cut-offs of 85 of the PL and 75 per cent of the PL. The decline is even faster for these two states at lower cut-offs if we take into account the base poverty ratio. The raised PLs for Odisha reveal only a marginal decline for both 125 per cent of the PL and 115 per cent of the PL. In the case of Gujarat, the decline in percentage points is higher for the raised cut-offs compared to the lowered cut-offs. If we take into account the base effect, the rate of decline is higher for the lowered cut-offs. As far as Tamil Nadu is concerned, the decline in percentage points in poverty was higher for the raised PL compared to those of the lowered PLs. However, if we take the base effect, the rate of change is more or less similar.<br />
<br />
As far as a concentration of poverty is concerned, it is clear that in all the four states the bulk of the poor lie between the PL and 75 per cent of the PL. In the case of two advanced states, Gujarat and Tamil Nadu, the concentration is even higher. In 2011-12, in Gujarat, 71.5 per cent of the poor were within these limits. In Tamil Nadu, the percentage of the poor falling within these limits is 63 per cent. The proportions are, however, much lower in the case of Bihar and Odisha. In both Gujarat and Tamil Nadu, the percentage of the poor falling between these limits has increased between 2009-10 and 2011-12, indicating a faster decline in the depth of poverty.<br />
<br />
There are three conclusions from the all-India and state-wise analysis. First, the rate of decline in poverty ratios for the lowered cut-off is similar or more than those for the PL or the raised PL. Second, poverty is concentrated around the PL. Third, the percentage of population below 50 per cent of the PL is negligible at both all-India and state levels.<br />
<br />
The bunching of poverty around the poverty line in India renders the problem of reducing poverty more manageable. The pace and pattern of growth have a significant impact on reducing poverty ratios. But as we have repeatedly emphasised, policymakers must pursue a two-fold strategy of letting the economy grow fast and attacking poverty directly through poverty alleviation programmes.<br />
<br />
<br />
<em>Rangarajan is chairman, Madras School of Economics, Chennai and Dev is director, Indira Gandhi Institute of Development Research, Mumbai.<br />
</em><br />
</div>',
'credit_writer' => 'The Indian Express, 15 December, 2015, http://indianexpress.com/article/opinion/columns/how-deep-is-indias-poverty/',
'article_img' => '',
'article_img_thumb' => '',
'status' => (int) 1,
'show_on_home' => (int) 1,
'lang' => 'EN',
'category_id' => (int) 16,
'tag_keyword' => '',
'seo_url' => 'how-deep-is-indias-poverty-c-rangarajan-and-s-mahendra-dev-4678069',
'meta_title' => null,
'meta_keywords' => null,
'meta_description' => null,
'noindex' => (int) 0,
'publish_date' => object(Cake\I18n\FrozenDate) {},
'most_visit_section_id' => null,
'article_big_img' => null,
'liveid' => (int) 4678069,
'created' => object(Cake\I18n\FrozenTime) {},
'modified' => object(Cake\I18n\FrozenTime) {},
'edate' => '',
'tags' => [
[maximum depth reached]
],
'category' => object(App\Model\Entity\Category) {},
'[new]' => false,
'[accessible]' => [
[maximum depth reached]
],
'[dirty]' => [[maximum depth reached]],
'[original]' => [[maximum depth reached]],
'[virtual]' => [[maximum depth reached]],
'[hasErrors]' => false,
'[errors]' => [[maximum depth reached]],
'[invalid]' => [[maximum depth reached]],
'[repository]' => 'Articles'
},
'articleid' => (int) 30010,
'metaTitle' => 'LATEST NEWS UPDATES | How deep is India’s poverty? -C Rangarajan and S Mahendra Dev',
'metaKeywords' => 'poverty estimate,poverty estimates,poverty line,poverty measures',
'metaDesc' => '
-The Indian Express
India’s poor are closely bunched up near the poverty line. This could make poverty alleviation more manageable.
A recent World Bank (WB) report brought out poverty ratios across countries. According to these estimates, poverty in India in 2011-12...',
'disp' => '<div align="justify">-The Indian Express<br /></div><div align="justify"> </div><div align="justify"><em>India’s poor are closely bunched up near the poverty line. This could make poverty alleviation more manageable. </em></div><div align="justify"> </div><div align="justify">A recent World Bank (WB) report brought out poverty ratios across countries. According to these estimates, poverty in India in 2011-12 could be as low as 12.4 per cent if we use “modified mixed reference period” (MMRP), in which there are three recall periods depending on the nature of items. This contrasts with the Rangarajan committee estimates of 29.5 per cent. The poverty line (PL) used by the Rangarajan committee for India was around Rs 1,105 per capita per month. That translates to $2.44 per capita per day, in terms of purchasing power parity. As such, the WB’s PL of $1.90 per capita per day is only about 78 per cent of the PL used by the Rangarajan committee. The lower PL is the reason for the lower poverty ratio estimated by the WB.<br /><br />However, the WB report also talks about the depth of poverty in terms of person-equivalent headcounts. According to the report, the depth elasticity at the global level between 1990 and 2012 was 1.18. In other words, the reductions in traditional head count ratios were accompanied by even larger reductions in person-equivalent poverty ratios. This is true in the regions where the bulk of the poor reside, such as South Asia.<br /><br />Here, we examine the depth of poverty in India in a different way — by looking at the poverty ratios using different cut-offs of the PL. The first issue is whether the poverty ratios with lowered PL cut-offs are declining as fast as those with raised PL cut-offs. The second issue is the location of the poor, that is, whether the poor are located much below the PL or around the PL.<br /><br />One conclusion is that even if we raise the PL to 125 per cent of what it is, the reduction in the poverty ratio was 9 percentage points between 2009-10 and 2011-12 (Table 1). This is also true for the poverty ratio based on 115 per cent of the PL. In the case of 85 per cent and 75 per cent of the PL, the percentage point decline was lower than those with the raised PL. But if we adjust for base poverty ratio, its decline was faster for 85 per cent of the PL and 75 per cent of the PL as compared to those between the PL and 125 per cent of the PL.<br /></div><div align="justify"> </div><div align="justify"><img src="https://im4change.in/siteadmin/tinymce/uploaded/Table Poverty.jpg" alt="Table Poverty" width="759" height="908" /> <br /></div><div align="justify"> </div><div align="justify">Headcount ratio is often criticised on the ground that it does not measure the “depth” of poverty. It is seen, however, that more than 50 per cent of the poor lie between the PL and 75 per cent of the PL. This is true for both 2009-10 and 2011-12. In fact, 65 per cent of the rural poor and 61 per cent total poor lie between the PL and 75 per cent of the PL in 2011-12. It may also be noted that many of the non-poor also live just above the PL between 115 per cent of the PL and the PL or between 125 per cent of the PL and the PL.<br /><br />Another point is that there is a negligible population below 50 per cent of the PL — less than 2 per cent in 2011-12.<br /><br />We also looked at the poverty ratios with different cut-offs of PLs for two relatively poorer states — Bihar and Odisha — and two developed states —Tamil Nadu and Gujarat (Table 2). It provides interesting results. In Bihar and Odisha, the rate of decline in poverty is lower for the raised PL of 125 per cent and 115 per cent, as compared to the PL and the lower cut-offs of 85 of the PL and 75 per cent of the PL. The decline is even faster for these two states at lower cut-offs if we take into account the base poverty ratio. The raised PLs for Odisha reveal only a marginal decline for both 125 per cent of the PL and 115 per cent of the PL. In the case of Gujarat, the decline in percentage points is higher for the raised cut-offs compared to the lowered cut-offs. If we take into account the base effect, the rate of decline is higher for the lowered cut-offs. As far as Tamil Nadu is concerned, the decline in percentage points in poverty was higher for the raised PL compared to those of the lowered PLs. However, if we take the base effect, the rate of change is more or less similar.<br /><br />As far as a concentration of poverty is concerned, it is clear that in all the four states the bulk of the poor lie between the PL and 75 per cent of the PL. In the case of two advanced states, Gujarat and Tamil Nadu, the concentration is even higher. In 2011-12, in Gujarat, 71.5 per cent of the poor were within these limits. In Tamil Nadu, the percentage of the poor falling within these limits is 63 per cent. The proportions are, however, much lower in the case of Bihar and Odisha. In both Gujarat and Tamil Nadu, the percentage of the poor falling between these limits has increased between 2009-10 and 2011-12, indicating a faster decline in the depth of poverty.<br /><br />There are three conclusions from the all-India and state-wise analysis. First, the rate of decline in poverty ratios for the lowered cut-off is similar or more than those for the PL or the raised PL. Second, poverty is concentrated around the PL. Third, the percentage of population below 50 per cent of the PL is negligible at both all-India and state levels.<br /><br />The bunching of poverty around the poverty line in India renders the problem of reducing poverty more manageable. The pace and pattern of growth have a significant impact on reducing poverty ratios. But as we have repeatedly emphasised, policymakers must pursue a two-fold strategy of letting the economy grow fast and attacking poverty directly through poverty alleviation programmes.<br /><br /> <br /><em>Rangarajan is chairman, Madras School of Economics, Chennai and Dev is director, Indira Gandhi Institute of Development Research, Mumbai.<br /></em><br /></div>',
'lang' => 'English',
'SITE_URL' => 'https://im4change.in/',
'site_title' => 'im4change',
'adminprix' => 'admin'
]
$article_current = object(App\Model\Entity\Article) {
'id' => (int) 30010,
'title' => 'How deep is India’s poverty? -C Rangarajan and S Mahendra Dev',
'subheading' => '',
'description' => '<div align="justify">
-The Indian Express<br />
</div>
<div align="justify">
</div>
<div align="justify">
<em>India’s poor are closely bunched up near the poverty line. This could make poverty alleviation more manageable. </em>
</div>
<div align="justify">
</div>
<div align="justify">
A recent World Bank (WB) report brought out poverty ratios across countries. According to these estimates, poverty in India in 2011-12 could be as low as 12.4 per cent if we use “modified mixed reference period” (MMRP), in which there are three recall periods depending on the nature of items. This contrasts with the Rangarajan committee estimates of 29.5 per cent. The poverty line (PL) used by the Rangarajan committee for India was around Rs 1,105 per capita per month. That translates to $2.44 per capita per day, in terms of purchasing power parity. As such, the WB’s PL of $1.90 per capita per day is only about 78 per cent of the PL used by the Rangarajan committee. The lower PL is the reason for the lower poverty ratio estimated by the WB.<br />
<br />
However, the WB report also talks about the depth of poverty in terms of person-equivalent headcounts. According to the report, the depth elasticity at the global level between 1990 and 2012 was 1.18. In other words, the reductions in traditional head count ratios were accompanied by even larger reductions in person-equivalent poverty ratios. This is true in the regions where the bulk of the poor reside, such as South Asia.<br />
<br />
Here, we examine the depth of poverty in India in a different way — by looking at the poverty ratios using different cut-offs of the PL. The first issue is whether the poverty ratios with lowered PL cut-offs are declining as fast as those with raised PL cut-offs. The second issue is the location of the poor, that is, whether the poor are located much below the PL or around the PL.<br />
<br />
One conclusion is that even if we raise the PL to 125 per cent of what it is, the reduction in the poverty ratio was 9 percentage points between 2009-10 and 2011-12 (Table 1). This is also true for the poverty ratio based on 115 per cent of the PL. In the case of 85 per cent and 75 per cent of the PL, the percentage point decline was lower than those with the raised PL. But if we adjust for base poverty ratio, its decline was faster for 85 per cent of the PL and 75 per cent of the PL as compared to those between the PL and 125 per cent of the PL.<br />
</div>
<div align="justify">
</div>
<div align="justify">
<img src="tinymce/uploaded/Table Poverty.jpg" alt="Table Poverty" width="759" height="908" /> <br />
</div>
<div align="justify">
</div>
<div align="justify">
Headcount ratio is often criticised on the ground that it does not measure the “depth” of poverty. It is seen, however, that more than 50 per cent of the poor lie between the PL and 75 per cent of the PL. This is true for both 2009-10 and 2011-12. In fact, 65 per cent of the rural poor and 61 per cent total poor lie between the PL and 75 per cent of the PL in 2011-12. It may also be noted that many of the non-poor also live just above the PL between 115 per cent of the PL and the PL or between 125 per cent of the PL and the PL.<br />
<br />
Another point is that there is a negligible population below 50 per cent of the PL — less than 2 per cent in 2011-12.<br />
<br />
We also looked at the poverty ratios with different cut-offs of PLs for two relatively poorer states — Bihar and Odisha — and two developed states —Tamil Nadu and Gujarat (Table 2). It provides interesting results. In Bihar and Odisha, the rate of decline in poverty is lower for the raised PL of 125 per cent and 115 per cent, as compared to the PL and the lower cut-offs of 85 of the PL and 75 per cent of the PL. The decline is even faster for these two states at lower cut-offs if we take into account the base poverty ratio. The raised PLs for Odisha reveal only a marginal decline for both 125 per cent of the PL and 115 per cent of the PL. In the case of Gujarat, the decline in percentage points is higher for the raised cut-offs compared to the lowered cut-offs. If we take into account the base effect, the rate of decline is higher for the lowered cut-offs. As far as Tamil Nadu is concerned, the decline in percentage points in poverty was higher for the raised PL compared to those of the lowered PLs. However, if we take the base effect, the rate of change is more or less similar.<br />
<br />
As far as a concentration of poverty is concerned, it is clear that in all the four states the bulk of the poor lie between the PL and 75 per cent of the PL. In the case of two advanced states, Gujarat and Tamil Nadu, the concentration is even higher. In 2011-12, in Gujarat, 71.5 per cent of the poor were within these limits. In Tamil Nadu, the percentage of the poor falling within these limits is 63 per cent. The proportions are, however, much lower in the case of Bihar and Odisha. In both Gujarat and Tamil Nadu, the percentage of the poor falling between these limits has increased between 2009-10 and 2011-12, indicating a faster decline in the depth of poverty.<br />
<br />
There are three conclusions from the all-India and state-wise analysis. First, the rate of decline in poverty ratios for the lowered cut-off is similar or more than those for the PL or the raised PL. Second, poverty is concentrated around the PL. Third, the percentage of population below 50 per cent of the PL is negligible at both all-India and state levels.<br />
<br />
The bunching of poverty around the poverty line in India renders the problem of reducing poverty more manageable. The pace and pattern of growth have a significant impact on reducing poverty ratios. But as we have repeatedly emphasised, policymakers must pursue a two-fold strategy of letting the economy grow fast and attacking poverty directly through poverty alleviation programmes.<br />
<br />
<br />
<em>Rangarajan is chairman, Madras School of Economics, Chennai and Dev is director, Indira Gandhi Institute of Development Research, Mumbai.<br />
</em><br />
</div>',
'credit_writer' => 'The Indian Express, 15 December, 2015, http://indianexpress.com/article/opinion/columns/how-deep-is-indias-poverty/',
'article_img' => '',
'article_img_thumb' => '',
'status' => (int) 1,
'show_on_home' => (int) 1,
'lang' => 'EN',
'category_id' => (int) 16,
'tag_keyword' => '',
'seo_url' => 'how-deep-is-indias-poverty-c-rangarajan-and-s-mahendra-dev-4678069',
'meta_title' => null,
'meta_keywords' => null,
'meta_description' => null,
'noindex' => (int) 0,
'publish_date' => object(Cake\I18n\FrozenDate) {},
'most_visit_section_id' => null,
'article_big_img' => null,
'liveid' => (int) 4678069,
'created' => object(Cake\I18n\FrozenTime) {},
'modified' => object(Cake\I18n\FrozenTime) {},
'edate' => '',
'tags' => [
(int) 0 => object(Cake\ORM\Entity) {},
(int) 1 => object(Cake\ORM\Entity) {},
(int) 2 => object(Cake\ORM\Entity) {},
(int) 3 => object(Cake\ORM\Entity) {}
],
'category' => object(App\Model\Entity\Category) {},
'[new]' => false,
'[accessible]' => [
'*' => true,
'id' => false
],
'[dirty]' => [],
'[original]' => [],
'[virtual]' => [],
'[hasErrors]' => false,
'[errors]' => [],
'[invalid]' => [],
'[repository]' => 'Articles'
}
$articleid = (int) 30010
$metaTitle = 'LATEST NEWS UPDATES | How deep is India’s poverty? -C Rangarajan and S Mahendra Dev'
$metaKeywords = 'poverty estimate,poverty estimates,poverty line,poverty measures'
$metaDesc = '
-The Indian Express
India’s poor are closely bunched up near the poverty line. This could make poverty alleviation more manageable.
A recent World Bank (WB) report brought out poverty ratios across countries. According to these estimates, poverty in India in 2011-12...'
$disp = '<div align="justify">-The Indian Express<br /></div><div align="justify"> </div><div align="justify"><em>India’s poor are closely bunched up near the poverty line. This could make poverty alleviation more manageable. </em></div><div align="justify"> </div><div align="justify">A recent World Bank (WB) report brought out poverty ratios across countries. According to these estimates, poverty in India in 2011-12 could be as low as 12.4 per cent if we use “modified mixed reference period” (MMRP), in which there are three recall periods depending on the nature of items. This contrasts with the Rangarajan committee estimates of 29.5 per cent. The poverty line (PL) used by the Rangarajan committee for India was around Rs 1,105 per capita per month. That translates to $2.44 per capita per day, in terms of purchasing power parity. As such, the WB’s PL of $1.90 per capita per day is only about 78 per cent of the PL used by the Rangarajan committee. The lower PL is the reason for the lower poverty ratio estimated by the WB.<br /><br />However, the WB report also talks about the depth of poverty in terms of person-equivalent headcounts. According to the report, the depth elasticity at the global level between 1990 and 2012 was 1.18. In other words, the reductions in traditional head count ratios were accompanied by even larger reductions in person-equivalent poverty ratios. This is true in the regions where the bulk of the poor reside, such as South Asia.<br /><br />Here, we examine the depth of poverty in India in a different way — by looking at the poverty ratios using different cut-offs of the PL. The first issue is whether the poverty ratios with lowered PL cut-offs are declining as fast as those with raised PL cut-offs. The second issue is the location of the poor, that is, whether the poor are located much below the PL or around the PL.<br /><br />One conclusion is that even if we raise the PL to 125 per cent of what it is, the reduction in the poverty ratio was 9 percentage points between 2009-10 and 2011-12 (Table 1). This is also true for the poverty ratio based on 115 per cent of the PL. In the case of 85 per cent and 75 per cent of the PL, the percentage point decline was lower than those with the raised PL. But if we adjust for base poverty ratio, its decline was faster for 85 per cent of the PL and 75 per cent of the PL as compared to those between the PL and 125 per cent of the PL.<br /></div><div align="justify"> </div><div align="justify"><img src="https://im4change.in/siteadmin/tinymce/uploaded/Table Poverty.jpg" alt="Table Poverty" width="759" height="908" /> <br /></div><div align="justify"> </div><div align="justify">Headcount ratio is often criticised on the ground that it does not measure the “depth” of poverty. It is seen, however, that more than 50 per cent of the poor lie between the PL and 75 per cent of the PL. This is true for both 2009-10 and 2011-12. In fact, 65 per cent of the rural poor and 61 per cent total poor lie between the PL and 75 per cent of the PL in 2011-12. It may also be noted that many of the non-poor also live just above the PL between 115 per cent of the PL and the PL or between 125 per cent of the PL and the PL.<br /><br />Another point is that there is a negligible population below 50 per cent of the PL — less than 2 per cent in 2011-12.<br /><br />We also looked at the poverty ratios with different cut-offs of PLs for two relatively poorer states — Bihar and Odisha — and two developed states —Tamil Nadu and Gujarat (Table 2). It provides interesting results. In Bihar and Odisha, the rate of decline in poverty is lower for the raised PL of 125 per cent and 115 per cent, as compared to the PL and the lower cut-offs of 85 of the PL and 75 per cent of the PL. The decline is even faster for these two states at lower cut-offs if we take into account the base poverty ratio. The raised PLs for Odisha reveal only a marginal decline for both 125 per cent of the PL and 115 per cent of the PL. In the case of Gujarat, the decline in percentage points is higher for the raised cut-offs compared to the lowered cut-offs. If we take into account the base effect, the rate of decline is higher for the lowered cut-offs. As far as Tamil Nadu is concerned, the decline in percentage points in poverty was higher for the raised PL compared to those of the lowered PLs. However, if we take the base effect, the rate of change is more or less similar.<br /><br />As far as a concentration of poverty is concerned, it is clear that in all the four states the bulk of the poor lie between the PL and 75 per cent of the PL. In the case of two advanced states, Gujarat and Tamil Nadu, the concentration is even higher. In 2011-12, in Gujarat, 71.5 per cent of the poor were within these limits. In Tamil Nadu, the percentage of the poor falling within these limits is 63 per cent. The proportions are, however, much lower in the case of Bihar and Odisha. In both Gujarat and Tamil Nadu, the percentage of the poor falling between these limits has increased between 2009-10 and 2011-12, indicating a faster decline in the depth of poverty.<br /><br />There are three conclusions from the all-India and state-wise analysis. First, the rate of decline in poverty ratios for the lowered cut-off is similar or more than those for the PL or the raised PL. Second, poverty is concentrated around the PL. Third, the percentage of population below 50 per cent of the PL is negligible at both all-India and state levels.<br /><br />The bunching of poverty around the poverty line in India renders the problem of reducing poverty more manageable. The pace and pattern of growth have a significant impact on reducing poverty ratios. But as we have repeatedly emphasised, policymakers must pursue a two-fold strategy of letting the economy grow fast and attacking poverty directly through poverty alleviation programmes.<br /><br /> <br /><em>Rangarajan is chairman, Madras School of Economics, Chennai and Dev is director, Indira Gandhi Institute of Development Research, Mumbai.<br /></em><br /></div>'
$lang = 'English'
$SITE_URL = 'https://im4change.in/'
$site_title = 'im4change'
$adminprix = 'admin'
include - APP/Template/Layout/printlayout.ctp, line 8
Cake\View\View::_evaluate() - CORE/src/View/View.php, line 1413
Cake\View\View::_render() - CORE/src/View/View.php, line 1374
Cake\View\View::renderLayout() - CORE/src/View/View.php, line 927
Cake\View\View::render() - CORE/src/View/View.php, line 885
Cake\Controller\Controller::render() - CORE/src/Controller/Controller.php, line 791
Cake\Http\ActionDispatcher::_invoke() - CORE/src/Http/ActionDispatcher.php, line 126
Cake\Http\ActionDispatcher::dispatch() - CORE/src/Http/ActionDispatcher.php, line 94
Cake\Http\BaseApplication::__invoke() - CORE/src/Http/BaseApplication.php, line 235
Cake\Http\Runner::__invoke() - CORE/src/Http/Runner.php, line 65
Cake\Routing\Middleware\RoutingMiddleware::__invoke() - CORE/src/Routing/Middleware/RoutingMiddleware.php, line 162
Cake\Http\Runner::__invoke() - CORE/src/Http/Runner.php, line 65
Cake\Routing\Middleware\AssetMiddleware::__invoke() - CORE/src/Routing/Middleware/AssetMiddleware.php, line 88
Cake\Http\Runner::__invoke() - CORE/src/Http/Runner.php, line 65
Cake\Error\Middleware\ErrorHandlerMiddleware::__invoke() - CORE/src/Error/Middleware/ErrorHandlerMiddleware.php, line 96
Cake\Http\Runner::__invoke() - CORE/src/Http/Runner.php, line 65
Cake\Http\Runner::run() - CORE/src/Http/Runner.php, line 51
latest-news-updates/how-deep-is-indias-poverty-c-rangarajan-and-s-mahendra-dev-4678069.html"/>
LATEST NEWS UPDATES | How deep is India’s poverty? -C Rangarajan and S Mahendra Dev | Im4change.org
How deep is India’s poverty? -C Rangarajan and S Mahendra Dev
-The Indian Express
India’s poor are closely bunched up near the poverty line. This could make poverty alleviation more manageable.
A recent World Bank (WB) report brought out poverty ratios across countries. According to these estimates, poverty in India in 2011-12 could be as low as 12.4 per cent if we use “modified mixed reference period” (MMRP), in which there are three recall periods depending on the nature of items. This contrasts with the Rangarajan committee estimates of 29.5 per cent. The poverty line (PL) used by the Rangarajan committee for India was around Rs 1,105 per capita per month. That translates to $2.44 per capita per day, in terms of purchasing power parity. As such, the WB’s PL of $1.90 per capita per day is only about 78 per cent of the PL used by the Rangarajan committee. The lower PL is the reason for the lower poverty ratio estimated by the WB.
However, the WB report also talks about the depth of poverty in terms of person-equivalent headcounts. According to the report, the depth elasticity at the global level between 1990 and 2012 was 1.18. In other words, the reductions in traditional head count ratios were accompanied by even larger reductions in person-equivalent poverty ratios. This is true in the regions where the bulk of the poor reside, such as South Asia.
Here, we examine the depth of poverty in India in a different way — by looking at the poverty ratios using different cut-offs of the PL. The first issue is whether the poverty ratios with lowered PL cut-offs are declining as fast as those with raised PL cut-offs. The second issue is the location of the poor, that is, whether the poor are located much below the PL or around the PL.
One conclusion is that even if we raise the PL to 125 per cent of what it is, the reduction in the poverty ratio was 9 percentage points between 2009-10 and 2011-12 (Table 1). This is also true for the poverty ratio based on 115 per cent of the PL. In the case of 85 per cent and 75 per cent of the PL, the percentage point decline was lower than those with the raised PL. But if we adjust for base poverty ratio, its decline was faster for 85 per cent of the PL and 75 per cent of the PL as compared to those between the PL and 125 per cent of the PL.
Headcount ratio is often criticised on the ground that it does not measure the “depth” of poverty. It is seen, however, that more than 50 per cent of the poor lie between the PL and 75 per cent of the PL. This is true for both 2009-10 and 2011-12. In fact, 65 per cent of the rural poor and 61 per cent total poor lie between the PL and 75 per cent of the PL in 2011-12. It may also be noted that many of the non-poor also live just above the PL between 115 per cent of the PL and the PL or between 125 per cent of the PL and the PL.
Another point is that there is a negligible population below 50 per cent of the PL — less than 2 per cent in 2011-12.
We also looked at the poverty ratios with different cut-offs of PLs for two relatively poorer states — Bihar and Odisha — and two developed states —Tamil Nadu and Gujarat (Table 2). It provides interesting results. In Bihar and Odisha, the rate of decline in poverty is lower for the raised PL of 125 per cent and 115 per cent, as compared to the PL and the lower cut-offs of 85 of the PL and 75 per cent of the PL. The decline is even faster for these two states at lower cut-offs if we take into account the base poverty ratio. The raised PLs for Odisha reveal only a marginal decline for both 125 per cent of the PL and 115 per cent of the PL. In the case of Gujarat, the decline in percentage points is higher for the raised cut-offs compared to the lowered cut-offs. If we take into account the base effect, the rate of decline is higher for the lowered cut-offs. As far as Tamil Nadu is concerned, the decline in percentage points in poverty was higher for the raised PL compared to those of the lowered PLs. However, if we take the base effect, the rate of change is more or less similar.
As far as a concentration of poverty is concerned, it is clear that in all the four states the bulk of the poor lie between the PL and 75 per cent of the PL. In the case of two advanced states, Gujarat and Tamil Nadu, the concentration is even higher. In 2011-12, in Gujarat, 71.5 per cent of the poor were within these limits. In Tamil Nadu, the percentage of the poor falling within these limits is 63 per cent. The proportions are, however, much lower in the case of Bihar and Odisha. In both Gujarat and Tamil Nadu, the percentage of the poor falling between these limits has increased between 2009-10 and 2011-12, indicating a faster decline in the depth of poverty.
There are three conclusions from the all-India and state-wise analysis. First, the rate of decline in poverty ratios for the lowered cut-off is similar or more than those for the PL or the raised PL. Second, poverty is concentrated around the PL. Third, the percentage of population below 50 per cent of the PL is negligible at both all-India and state levels.
The bunching of poverty around the poverty line in India renders the problem of reducing poverty more manageable. The pace and pattern of growth have a significant impact on reducing poverty ratios. But as we have repeatedly emphasised, policymakers must pursue a two-fold strategy of letting the economy grow fast and attacking poverty directly through poverty alleviation programmes.
Rangarajan is chairman, Madras School of Economics, Chennai and Dev is director, Indira Gandhi Institute of Development Research, Mumbai.