Deprecated (16384): The ArrayAccess methods will be removed in 4.0.0.Use getParam(), getData() and getQuery() instead. - /home/brlfuser/public_html/src/Controller/ArtileDetailController.php, line: 73
You can disable deprecation warnings by setting `Error.errorLevel` to `E_ALL & ~E_USER_DEPRECATED` in your config/app.php. [CORE/src/Core/functions.php, line 311]
deprecationWarning - CORE/src/Core/functions.php, line 311
Cake\Http\ServerRequest::offsetGet() - CORE/src/Http/ServerRequest.php, line 2421
App\Controller\ArtileDetailController::printArticle() - APP/Controller/ArtileDetailController.php, line 73
Cake\Controller\Controller::invokeAction() - CORE/src/Controller/Controller.php, line 610
Cake\Http\ActionDispatcher::_invoke() - CORE/src/Http/ActionDispatcher.php, line 120
Cake\Http\ActionDispatcher::dispatch() - CORE/src/Http/ActionDispatcher.php, line 94
Cake\Http\BaseApplication::__invoke() - CORE/src/Http/BaseApplication.php, line 235
Cake\Http\Runner::__invoke() - CORE/src/Http/Runner.php, line 65
Cake\Routing\Middleware\RoutingMiddleware::__invoke() - CORE/src/Routing/Middleware/RoutingMiddleware.php, line 162
Cake\Http\Runner::__invoke() - CORE/src/Http/Runner.php, line 65
Cake\Routing\Middleware\AssetMiddleware::__invoke() - CORE/src/Routing/Middleware/AssetMiddleware.php, line 88
Cake\Http\Runner::__invoke() - CORE/src/Http/Runner.php, line 65
Cake\Error\Middleware\ErrorHandlerMiddleware::__invoke() - CORE/src/Error/Middleware/ErrorHandlerMiddleware.php, line 96
Cake\Http\Runner::__invoke() - CORE/src/Http/Runner.php, line 65
Cake\Http\Runner::run() - CORE/src/Http/Runner.php, line 51
Cake\Http\Server::run() - CORE/src/Http/Server.php, line 98
Deprecated (16384): The ArrayAccess methods will be removed in 4.0.0.Use getParam(), getData() and getQuery() instead. - /home/brlfuser/public_html/src/Controller/ArtileDetailController.php, line: 74
You can disable deprecation warnings by setting `Error.errorLevel` to `E_ALL & ~E_USER_DEPRECATED` in your config/app.php. [CORE/src/Core/functions.php, line 311]
deprecationWarning - CORE/src/Core/functions.php, line 311
Cake\Http\ServerRequest::offsetGet() - CORE/src/Http/ServerRequest.php, line 2421
App\Controller\ArtileDetailController::printArticle() - APP/Controller/ArtileDetailController.php, line 74
Cake\Controller\Controller::invokeAction() - CORE/src/Controller/Controller.php, line 610
Cake\Http\ActionDispatcher::_invoke() - CORE/src/Http/ActionDispatcher.php, line 120
Cake\Http\ActionDispatcher::dispatch() - CORE/src/Http/ActionDispatcher.php, line 94
Cake\Http\BaseApplication::__invoke() - CORE/src/Http/BaseApplication.php, line 235
Cake\Http\Runner::__invoke() - CORE/src/Http/Runner.php, line 65
Cake\Routing\Middleware\RoutingMiddleware::__invoke() - CORE/src/Routing/Middleware/RoutingMiddleware.php, line 162
Cake\Http\Runner::__invoke() - CORE/src/Http/Runner.php, line 65
Cake\Routing\Middleware\AssetMiddleware::__invoke() - CORE/src/Routing/Middleware/AssetMiddleware.php, line 88
Cake\Http\Runner::__invoke() - CORE/src/Http/Runner.php, line 65
Cake\Error\Middleware\ErrorHandlerMiddleware::__invoke() - CORE/src/Error/Middleware/ErrorHandlerMiddleware.php, line 96
Cake\Http\Runner::__invoke() - CORE/src/Http/Runner.php, line 65
Cake\Http\Runner::run() - CORE/src/Http/Runner.php, line 51
Cake\Http\Server::run() - CORE/src/Http/Server.php, line 98
Warning (512): Unable to emit headers. Headers sent in file=/home/brlfuser/public_html/vendor/cakephp/cakephp/src/Error/Debugger.php line=853 [CORE/src/Http/ResponseEmitter.php, line 48]
if (Configure::read('debug')) {
trigger_error($message, E_USER_WARNING);
} else {
$response = object(Cake\Http\Response) {
'status' => (int) 200,
'contentType' => 'text/html',
'headers' => [
'Content-Type' => [
[maximum depth reached]
]
],
'file' => null,
'fileRange' => [],
'cookies' => object(Cake\Http\Cookie\CookieCollection) {},
'cacheDirectives' => [],
'body' => '<!DOCTYPE html PUBLIC "-//W3C//DTD XHTML 1.0 Transitional//EN"
"http://www.w3.org/TR/xhtml1/DTD/xhtml1-transitional.dtd">
<html xmlns="http://www.w3.org/1999/xhtml">
<head>
<link rel="canonical" href="https://im4change.in/<pre class="cake-error"><a href="javascript:void(0);" onclick="document.getElementById('cakeErr67f4892922ad8-trace').style.display = (document.getElementById('cakeErr67f4892922ad8-trace').style.display == 'none' ? '' : 'none');"><b>Notice</b> (8)</a>: Undefined variable: urlPrefix [<b>APP/Template/Layout/printlayout.ctp</b>, line <b>8</b>]<div id="cakeErr67f4892922ad8-trace" class="cake-stack-trace" style="display: none;"><a href="javascript:void(0);" onclick="document.getElementById('cakeErr67f4892922ad8-code').style.display = (document.getElementById('cakeErr67f4892922ad8-code').style.display == 'none' ? '' : 'none')">Code</a> <a href="javascript:void(0);" onclick="document.getElementById('cakeErr67f4892922ad8-context').style.display = (document.getElementById('cakeErr67f4892922ad8-context').style.display == 'none' ? '' : 'none')">Context</a><pre id="cakeErr67f4892922ad8-code" class="cake-code-dump" style="display: none;"><code><span style="color: #000000"><span style="color: #0000BB"></span><span style="color: #007700"><</span><span style="color: #0000BB">head</span><span style="color: #007700">>
</span></span></code>
<span class="code-highlight"><code><span style="color: #000000"> <link rel="canonical" href="<span style="color: #0000BB"><?php </span><span style="color: #007700">echo </span><span style="color: #0000BB">Configure</span><span style="color: #007700">::</span><span style="color: #0000BB">read</span><span style="color: #007700">(</span><span style="color: #DD0000">'SITE_URL'</span><span style="color: #007700">); </span><span style="color: #0000BB">?><?php </span><span style="color: #007700">echo </span><span style="color: #0000BB">$urlPrefix</span><span style="color: #007700">;</span><span style="color: #0000BB">?><?php </span><span style="color: #007700">echo </span><span style="color: #0000BB">$article_current</span><span style="color: #007700">-></span><span style="color: #0000BB">category</span><span style="color: #007700">-></span><span style="color: #0000BB">slug</span><span style="color: #007700">; </span><span style="color: #0000BB">?></span>/<span style="color: #0000BB"><?php </span><span style="color: #007700">echo </span><span style="color: #0000BB">$article_current</span><span style="color: #007700">-></span><span style="color: #0000BB">seo_url</span><span style="color: #007700">; </span><span style="color: #0000BB">?></span>.html"/>
</span></code></span>
<code><span style="color: #000000"><span style="color: #0000BB"> </span><span style="color: #007700"><</span><span style="color: #0000BB">meta http</span><span style="color: #007700">-</span><span style="color: #0000BB">equiv</span><span style="color: #007700">=</span><span style="color: #DD0000">"Content-Type" </span><span style="color: #0000BB">content</span><span style="color: #007700">=</span><span style="color: #DD0000">"text/html; charset=utf-8"</span><span style="color: #007700">/>
</span></span></code></pre><pre id="cakeErr67f4892922ad8-context" class="cake-context" style="display: none;">$viewFile = '/home/brlfuser/public_html/src/Template/Layout/printlayout.ctp'
$dataForView = [
'article_current' => object(App\Model\Entity\Article) {
'id' => (int) 63956,
'title' => 'How well did the women workers fare during the pandemic years? The yearly PLFS reports provide some mixed answers.',
'subheading' => null,
'description' => '<p style="text-align:justify">Do you want a job that does not pay you at all? The answer will be surely &#39;no&#39; for most of us. And yet, in our <a href="https://im4change.org/news-alerts-57/plfs-unemployment-rate-labour-force-participation-rate-worker-population-ratio-decent-work-social-security-quality-of-work-gainful-employment.html">previous analysis</a>, it was found that the proportion of &#39;helpers in household enterprises&#39; among the total number of workers grew over various rounds of annual PLFS <em>(Periodic Labour Force Survey)</em>, from 13.3 percent to 15.9 percent between PLFS 2018-19 and PLFS 2019-20, and then soared further to 17.3 percent in PLFS 2020-21.&nbsp;</p>
<p style="text-align:justify">The most elemental question that comes to one&rsquo;s mind is which gender took up such unpaid, low-quality jobs during the pandemic years and whether there was a rural-urban divide noticed in that trend.&nbsp;</p>
<p style="text-align:justify">Without further ado, it needs to be mentioned here that from table-15 of each of the annual PLFS reports <em>(please click <a href="https://im4change.org/upload/files/Annual%20Report%20PLFS%202020-21.pdf">here</a>, <a href="https://im4change.org/upload/files/Annual_Report_PLFS_2019_20.pdf">here</a>, <a href="https://im4change.org/docs/annual-report-on-periodic-labour-force-survey-july-2018-june-2019.pdf">here</a> and <a href="https://im4change.org/docs/216Annual_Report_PLFS_2017_18_31052019.pdf">here</a> to access)</em>, the proportion of male and female workers for various categories of work is extracted, and the data is presented as table-1 and table-2 in this analysis.</p>
<p style="text-align:justify">The categories of workers, which have been considered in the present news alert, are as follows:&nbsp;</p>
<p style="text-align:justify"><strong>Self-employed&nbsp;</strong></p>
<p style="text-align:justify">- Code 11: worked in household enterprises <em>(self-employed) </em>as own-account worker&nbsp;<br />
- Code 12: worked in household enterprises <em>(self-employed) </em>as an employer<br />
- Code 21: worked in household enterprises <em>(self-employed) </em>as helper&nbsp;</p>
<p style="text-align:justify"><strong>Regular/salaried&nbsp;</strong></p>
<p style="text-align:justify">- Code 31: worked as regular wage/salaried employee&nbsp;</p>
<p style="text-align:justify"><strong>Casual Workers&nbsp;</strong></p>
<p style="text-align:justify">- Code 41: worked as casual labour in public works other than MGNREG public works<br />
- Code 51: worked as casual labour in other types of works</p>
<p style="text-align:justify"><strong>Not working but seeking/available for work <em>(or unemployed)</em></strong></p>
<p style="text-align:justify">- Code 81: sought work or did not seek but was available for work <em>(for usual status approach)</em>&nbsp;</p>
<p style="text-align:justify"><strong>Neither working nor available for work <em>(or not in labour force)</em>&nbsp;</strong></p>
<p style="text-align:justify">- Code 97: others <em>(including beggars, prostitutes, etc.)</em></p>
<p style="text-align:justify"><strong>---</strong></p>
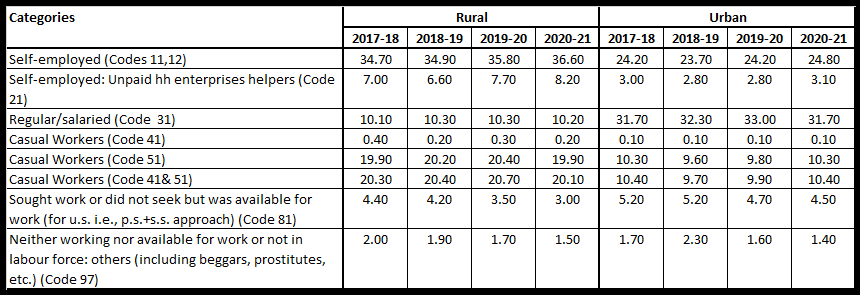
<p style="text-align:justify">In rural areas, the proportion of usual status male workers as self-employed <em>(sum of own-account workers and employers in household enterprises) </em>increased over various rounds of annual PLFS, from 34.7&nbsp;percent in PLFS 2017-18 to 36.6 percent in PLFS 2020-21. In urban areas too, for the same category of self-employed, this proportion went up between PLFS 2018-19 and PLFS 2020-21. Please see table-1.</p>
<p style="text-align:justify"><strong>Table 1: Percentage of usual status workers in different categories of 15 years plus population: Male</strong></p>
<p style="text-align:justify"><img alt="" src="/upload/images/Table%201%20Percentage%20of%20usual%20status%20workers%20in%20different%20categories%20of%2015%20plus%20population%20Male.png" style="height:295px; width:860px" /></p>
<p style="text-align:justify"><em><strong>Source: </strong>Fourth Periodic Labour Force Survey Annual Report (July 2020-June 2021), please <a href="https://im4change.org/upload/files/Annual%20Report%20PLFS%202020-21.pdf">click here</a> to access &nbsp;</em></p>
<p style="text-align:justify"><em>Third Periodic Labour Force Survey Annual Report (July 2019-June 2020), please <a href="https://im4change.org/upload/files/Annual_Report_PLFS_2019_20.pdf ">click here</a> to access &nbsp;</em></p>
<p style="text-align:justify"><em>Second Periodic Labour Force Survey Annual Report (July 2018-June 2019), please <a href="https://im4change.org/docs/annual-report-on-periodic-labour-force-survey-july-2018-june-2019.pdf ">click here</a> to access &nbsp;</em></p>
<p style="text-align:justify"><em>First Periodic Labour Force Survey Annual Report (July 2017-June 2018), please <a href="https://im4change.org/docs/216Annual_Report_PLFS_2017_18_31052019.pdf ">click here</a> to access &nbsp;</em></p>
<p style="text-align:justify"><strong>---</strong></p>
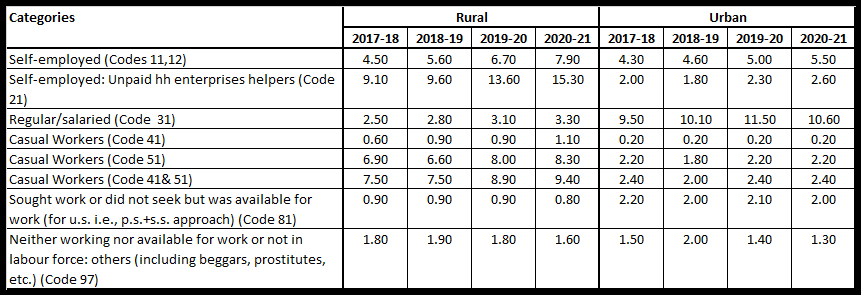
<p style="text-align:justify">The proportion of usual status female workers as self-employed <em>(sum of own-account workers and employers in household enterprises) </em>climbed up over various rounds of annual PLFS, from 4.5 percent in PLFS 2017-18 to 7.9 percent in PLFS 2020-21. In urban areas too, for the same category of self-employed, this proportion went up between PLFS 2017-18 and PLFS 2020-21. Kindly take a look at table-2.</p>
<p style="text-align:justify"><strong>Table 2: Percentage of usual status workers in different categories of 15 years plus population: Female</strong></p>
<p style="text-align:justify"><img alt="" src="/upload/images/Table%202%20Percentage%20of%20usual%20status%20workers%20in%20different%20categories%20of%2015%20plus%20population%20Female.png" style="height:295px; width:861px" /></p>
<p style="text-align:justify"><em><strong>Source: </strong>Same as table-1</em><br />
<strong>---</strong></p>
<p style="text-align:justify">As can be seen from table-1 of this analysis, although the proportion of usual status male workers as household enterprise helpers in rural areas came down slightly between PLFS 2017-18 and PLFS 2018-19, it gradually went up to 7.7&nbsp;percent in PLFS 2019-20, and further to 8.2&nbsp;percent in PLFS 2020-21.&nbsp;</p>
<p style="text-align:justify">In urban areas, after remaining unchanged for two successive rounds of annual PLFS, the proportion of usual status male workers as household enterprise helpers increased marginally to 3.1&nbsp;percent in PLFS 2020-21.&nbsp;</p>
<p style="text-align:justify"><span style="background-color:#ffcc00">In contrast to male workers, the proportion of usual status female workers as household enterprise helpers in rural areas increased over various rounds of annual PLFS, from 9.1 percent in PLFS 2017-18 to 15.3 percent in PLFS 2020-21. Between PLFS 2018-19 and PLFS 2019-20, there was a noticeable jump in the proportion of usual status female workers as household enterprise helpers in such areas. In rural areas, compared to its male counterpart, a higher proportion of usual status female workers worked as household enterprise helpers during each of the annual PLFS rounds, from PLFS 2017-18 to PLFS 2020-21.&nbsp;The gap between the proportion of usual status female workers as household enterprise helpers and that of its male counterpart in rural areas expanded from 2.1 percentage points (p.p.) to 7.1 p.p. between PLFS 2017-18 and PLFS 2020-21. Kindly compare table-1 against table-2.&nbsp;</span></p>
<p style="text-align:justify">In urban areas, the proportion of usual status female workers as household enterprise helpers increased over various rounds of annual PLFS, from 1.8 percent in PLFS 2018-19 to 2.6 percent in PLFS 2020-21.&nbsp;</p>
<p style="text-align:justify">In rural areas, the proportion of usual status male workers as regular/salaried workers remained almost the same between PLFS 2017-18 and PLFS 2020-21. However, the proportion of usual status male workers as regular/salaried workers decreased from 33.0 percent to 31.7 percent between PLFS 2019-20 and PLFS 2020-21 in urban areas. Please see table-1.</p>
<p style="text-align:justify">In rural areas, the proportion of usual status female workers as regular/salaried workers increased over various annual PLFS rounds, from 2.5 percent in PLFS 2017-18 to 3.3 percent in PLFS 2020-21. In urban areas, at first the proportion of usual status female workers as regular/salaried workers grew from 9.5 percent in PLFS 2017-18 to 11.5 percent in PLFS 2019-20, but then it dropped to 10.6 percent in PLFS 2020-21.</p>
<p style="text-align:justify">In rural areas, the proportion of usual status male workers who worked as casual labour in other types of works <em>(i.e., excluding public works as well as MGNREGA) </em>remained at around 20 percent in various annual PLFS rounds. For the same category of workers in urban areas, this proportion marginally rose from 9.6 percent in PLFS 2018-19 to 9.8 percent in PLFS 2019-20, and further to 10.3 percent in 2020-21. Kindly consult table-1.</p>
<p style="text-align:justify">In rural areas, the proportion of usual status female workers who worked as casual labour in other types of works <em>(i.e., excluding public works as well as MGNREGA) </em>increased from 6.6 percent to 8.3 percent between PLFS 2018-19 and PLFS 2020-21. For the same category of workers in urban areas, this proportion remained the same in PLFS 2019-20 and PLFS 2020-21.&nbsp;Kindly look at table-2.</p>
<p style="text-align:justify">Please note&nbsp;that the&nbsp;<a href="https://im4change.org/upload/files/Annual%20Report%20PLFS%202020-21.pdf" title="https://im4change.org/upload/files/Annual%20Report%20PLFS%202020-21.pdf">Annual Report on PLFS 2020-2021</a>&nbsp;has also covered the period&nbsp;<em>(i.e., April-June, 2021)&nbsp;</em>when the state-wide lockdowns&nbsp;associated with the second wave of COVID-19&nbsp;were imposed. The&nbsp;<a href="https://im4change.org/upload/files/Annual_Report_PLFS_2019_20.pdf" title="https://im4change.org/upload/files/Annual_Report_PLFS_2019_20.pdf">Annual Report on PLFS 2019-20</a>&nbsp;too had covered the period&nbsp;<em>(i.e., April-June, 2020)</em>&nbsp;when the countrywide lockdown&nbsp;<em>(associated with the first year of the COVID-19 pandemic)&nbsp;</em>was imposed.&nbsp;</p>
<p style="text-align:justify"><em><strong>References</strong></em></p>
<p style="text-align:justify">Fourth Periodic Labour Force Survey Annual Report (July 2020-June 2021), released in June 2022, National Statistical Office (NSO), Ministry of Statistics and Programme Implementation (MoSPI), <a href="https://im4change.org/upload/files/Annual%20Report%20PLFS%202020-21.pdf">click here</a> to access &nbsp;</p>
<p style="text-align:justify">Third Periodic Labour Force Survey Annual Report (July 2019-June 2020), released in July 2021, National Statistical Office (NSO), Ministry of Statistics and Programme Implementation (MoSPI), please <a href="https://im4change.org/upload/files/Annual_Report_PLFS_2019_20.pdf ">click here</a> to access &nbsp;</p>
<p style="text-align:justify">Second Periodic Labour Force Survey Annual Report (July 2018-June 2019), released in June 2020, National Statistical Office (NSO), Ministry of Statistics and Programme Implementation (MoSPI), please <a href="https://im4change.org/docs/annual-report-on-periodic-labour-force-survey-july-2018-june-2019.pdf ">click here</a> to access &nbsp;</p>
<p style="text-align:justify">First Periodic Labour Force Survey Annual Report (July 2017-June 2018), released in May 2019, National Statistical Office (NSO), Ministry of Statistics and Programme Implementation (MoSPI), please <a href="https://im4change.org/docs/216Annual_Report_PLFS_2017_18_31052019.pdf ">click here</a> to access &nbsp;&nbsp;</p>
<p style="text-align:justify">News alert: Quality of work matters, and not just job creation, Inclusive Media for Change, Published on: Sep 26, 2022, please <a href="https://im4change.org/news-alerts-57/plfs-unemployment-rate-labour-force-participation-rate-worker-population-ratio-decent-work-social-security-quality-of-work-gainful-employment.html">click here</a> to access</p>
<p style="text-align:justify">What&rsquo;s behind the &lsquo;improvement&rsquo; in employment situation in labour force survey report -PC Mohanan, ThePrint, 21 August, 2021, please <a href="https://theprint.in/opinion/what-is-behind-the-improvement-in-employment-situation/719674/ ">click here</a> to access&nbsp;</p>
<p style="text-align:justify"><br />
<strong>Image Courtesy: Inclusive Media for Change/ Himanshu Joshi</strong></p>
',
'credit_writer' => '',
'article_img' => 'Image Employment dated 7 Oct 2022.jpg',
'article_img_thumb' => 'Image Employment dated 7 Oct 2022.jpg',
'status' => (int) 1,
'show_on_home' => (int) 1,
'lang' => 'EN',
'category_id' => (int) 4,
'tag_keyword' => '',
'seo_url' => 'how-well-did-the-women-worker-fare-during-the-pandemic-years-plfs-reports-provide-some-mixed-answers-casual-workers-self-employed-unpaid-helpers-family-enterprises-regular-wage-salaried',
'meta_title' => '',
'meta_keywords' => '',
'meta_description' => '',
'noindex' => (int) 1,
'publish_date' => object(Cake\I18n\FrozenDate) {},
'most_visit_section_id' => null,
'article_big_img' => null,
'liveid' => null,
'created' => object(Cake\I18n\FrozenTime) {},
'modified' => object(Cake\I18n\FrozenTime) {},
'edate' => '',
'tags' => [
[maximum depth reached]
],
'category' => object(App\Model\Entity\Category) {},
'[new]' => false,
'[accessible]' => [
[maximum depth reached]
],
'[dirty]' => [[maximum depth reached]],
'[original]' => [[maximum depth reached]],
'[virtual]' => [[maximum depth reached]],
'[hasErrors]' => false,
'[errors]' => [[maximum depth reached]],
'[invalid]' => [[maximum depth reached]],
'[repository]' => 'Articles'
},
'articleid' => (int) 63956,
'metaTitle' => 'NEWS ALERTS | How well did the women workers fare during the pandemic years? The yearly PLFS reports provide some mixed answers.',
'metaKeywords' => 'Casual Workers,Female workers,Household Enterprises,Male workers,Periodic Labour Force Survey,PLFS,regular wage/salaried employee,Self Employed,Self-employed,Unpaid Helpers,Women workers',
'metaDesc' => 'Do you want a job that does not pay you at all? The answer will be surely &#39;no&#39; for most of us. And yet, in our previous analysis, it was found that the proportion of &#39;helpers in household enterprises&#39; among...',
'disp' => '<p style="text-align:justify">Do you want a job that does not pay you at all? The answer will be surely &#39;no&#39; for most of us. And yet, in our <a href="https://im4change.org/news-alerts-57/plfs-unemployment-rate-labour-force-participation-rate-worker-population-ratio-decent-work-social-security-quality-of-work-gainful-employment.html" title="https://im4change.org/news-alerts-57/plfs-unemployment-rate-labour-force-participation-rate-worker-population-ratio-decent-work-social-security-quality-of-work-gainful-employment.html">previous analysis</a>, it was found that the proportion of &#39;helpers in household enterprises&#39; among the total number of workers grew over various rounds of annual PLFS <em>(Periodic Labour Force Survey)</em>, from 13.3 percent to 15.9 percent between PLFS 2018-19 and PLFS 2019-20, and then soared further to 17.3 percent in PLFS 2020-21.&nbsp;</p><p style="text-align:justify">The most elemental question that comes to one&rsquo;s mind is which gender took up such unpaid, low-quality jobs during the pandemic years and whether there was a rural-urban divide noticed in that trend.&nbsp;</p><p style="text-align:justify">Without further ado, it needs to be mentioned here that from table-15 of each of the annual PLFS reports <em>(please click <a href="https://im4change.org/upload/files/Annual%20Report%20PLFS%202020-21.pdf" title="https://im4change.org/upload/files/Annual%20Report%20PLFS%202020-21.pdf">here</a>, <a href="https://im4change.org/upload/files/Annual_Report_PLFS_2019_20.pdf" title="https://im4change.org/upload/files/Annual_Report_PLFS_2019_20.pdf">here</a>, <a href="https://im4change.org/docs/annual-report-on-periodic-labour-force-survey-july-2018-june-2019.pdf" title="https://im4change.org/docs/annual-report-on-periodic-labour-force-survey-july-2018-june-2019.pdf">here</a> and <a href="https://im4change.org/docs/216Annual_Report_PLFS_2017_18_31052019.pdf" title="https://im4change.org/docs/216Annual_Report_PLFS_2017_18_31052019.pdf">here</a> to access)</em>, the proportion of male and female workers for various categories of work is extracted, and the data is presented as table-1 and table-2 in this analysis.</p><p style="text-align:justify">The categories of workers, which have been considered in the present news alert, are as follows:&nbsp;</p><p style="text-align:justify"><strong>Self-employed&nbsp;</strong></p><p style="text-align:justify">- Code 11: worked in household enterprises <em>(self-employed) </em>as own-account worker&nbsp;<br />- Code 12: worked in household enterprises <em>(self-employed) </em>as an employer<br />- Code 21: worked in household enterprises <em>(self-employed) </em>as helper&nbsp;</p><p style="text-align:justify"><strong>Regular/salaried&nbsp;</strong></p><p style="text-align:justify">- Code 31: worked as regular wage/salaried employee&nbsp;</p><p style="text-align:justify"><strong>Casual Workers&nbsp;</strong></p><p style="text-align:justify">- Code 41: worked as casual labour in public works other than MGNREG public works<br />- Code 51: worked as casual labour in other types of works</p><p style="text-align:justify"><strong>Not working but seeking/available for work <em>(or unemployed)</em></strong></p><p style="text-align:justify">- Code 81: sought work or did not seek but was available for work <em>(for usual status approach)</em>&nbsp;</p><p style="text-align:justify"><strong>Neither working nor available for work <em>(or not in labour force)</em>&nbsp;</strong></p><p style="text-align:justify">- Code 97: others <em>(including beggars, prostitutes, etc.)</em></p><p style="text-align:justify"><strong>---</strong></p><p style="text-align:justify">In rural areas, the proportion of usual status male workers as self-employed <em>(sum of own-account workers and employers in household enterprises) </em>increased over various rounds of annual PLFS, from 34.7&nbsp;percent in PLFS 2017-18 to 36.6 percent in PLFS 2020-21. In urban areas too, for the same category of self-employed, this proportion went up between PLFS 2018-19 and PLFS 2020-21. Please see table-1.</p><p style="text-align:justify"><strong>Table 1: Percentage of usual status workers in different categories of 15 years plus population: Male</strong></p><p style="text-align:justify"><img alt="" src="/upload/images/Table%201%20Percentage%20of%20usual%20status%20workers%20in%20different%20categories%20of%2015%20plus%20population%20Male.png" style="height:295px; width:860px" /></p><p style="text-align:justify"><em><strong>Source: </strong>Fourth Periodic Labour Force Survey Annual Report (July 2020-June 2021), please <a href="https://im4change.org/upload/files/Annual%20Report%20PLFS%202020-21.pdf" title="https://im4change.org/upload/files/Annual%20Report%20PLFS%202020-21.pdf">click here</a> to access &nbsp;</em></p><p style="text-align:justify"><em>Third Periodic Labour Force Survey Annual Report (July 2019-June 2020), please <a href="https://im4change.org/upload/files/Annual_Report_PLFS_2019_20.pdf" title="https://im4change.org/upload/files/Annual_Report_PLFS_2019_20.pdf">click here</a> to access &nbsp;</em></p><p style="text-align:justify"><em>Second Periodic Labour Force Survey Annual Report (July 2018-June 2019), please <a href="https://im4change.org/docs/annual-report-on-periodic-labour-force-survey-july-2018-june-2019.pdf" title="https://im4change.org/docs/annual-report-on-periodic-labour-force-survey-july-2018-june-2019.pdf">click here</a> to access &nbsp;</em></p><p style="text-align:justify"><em>First Periodic Labour Force Survey Annual Report (July 2017-June 2018), please <a href="https://im4change.org/docs/216Annual_Report_PLFS_2017_18_31052019.pdf" title="https://im4change.org/docs/216Annual_Report_PLFS_2017_18_31052019.pdf">click here</a> to access &nbsp;</em></p><p style="text-align:justify"><strong>---</strong></p><p style="text-align:justify">The proportion of usual status female workers as self-employed <em>(sum of own-account workers and employers in household enterprises) </em>climbed up over various rounds of annual PLFS, from 4.5 percent in PLFS 2017-18 to 7.9 percent in PLFS 2020-21. In urban areas too, for the same category of self-employed, this proportion went up between PLFS 2017-18 and PLFS 2020-21. Kindly take a look at table-2.</p><p style="text-align:justify"><strong>Table 2: Percentage of usual status workers in different categories of 15 years plus population: Female</strong></p><p style="text-align:justify"><img alt="" src="/upload/images/Table%202%20Percentage%20of%20usual%20status%20workers%20in%20different%20categories%20of%2015%20plus%20population%20Female.png" style="height:295px; width:861px" /></p><p style="text-align:justify"><em><strong>Source: </strong>Same as table-1</em><br /><strong>---</strong></p><p style="text-align:justify">As can be seen from table-1 of this analysis, although the proportion of usual status male workers as household enterprise helpers in rural areas came down slightly between PLFS 2017-18 and PLFS 2018-19, it gradually went up to 7.7&nbsp;percent in PLFS 2019-20, and further to 8.2&nbsp;percent in PLFS 2020-21.&nbsp;</p><p style="text-align:justify">In urban areas, after remaining unchanged for two successive rounds of annual PLFS, the proportion of usual status male workers as household enterprise helpers increased marginally to 3.1&nbsp;percent in PLFS 2020-21.&nbsp;</p><p style="text-align:justify"><span style="background-color:#ffcc00">In contrast to male workers, the proportion of usual status female workers as household enterprise helpers in rural areas increased over various rounds of annual PLFS, from 9.1 percent in PLFS 2017-18 to 15.3 percent in PLFS 2020-21. Between PLFS 2018-19 and PLFS 2019-20, there was a noticeable jump in the proportion of usual status female workers as household enterprise helpers in such areas. In rural areas, compared to its male counterpart, a higher proportion of usual status female workers worked as household enterprise helpers during each of the annual PLFS rounds, from PLFS 2017-18 to PLFS 2020-21.&nbsp;The gap between the proportion of usual status female workers as household enterprise helpers and that of its male counterpart in rural areas expanded from 2.1 percentage points (p.p.) to 7.1 p.p. between PLFS 2017-18 and PLFS 2020-21. Kindly compare table-1 against table-2.&nbsp;</span></p><p style="text-align:justify">In urban areas, the proportion of usual status female workers as household enterprise helpers increased over various rounds of annual PLFS, from 1.8 percent in PLFS 2018-19 to 2.6 percent in PLFS 2020-21.&nbsp;</p><p style="text-align:justify">In rural areas, the proportion of usual status male workers as regular/salaried workers remained almost the same between PLFS 2017-18 and PLFS 2020-21. However, the proportion of usual status male workers as regular/salaried workers decreased from 33.0 percent to 31.7 percent between PLFS 2019-20 and PLFS 2020-21 in urban areas. Please see table-1.</p><p style="text-align:justify">In rural areas, the proportion of usual status female workers as regular/salaried workers increased over various annual PLFS rounds, from 2.5 percent in PLFS 2017-18 to 3.3 percent in PLFS 2020-21. In urban areas, at first the proportion of usual status female workers as regular/salaried workers grew from 9.5 percent in PLFS 2017-18 to 11.5 percent in PLFS 2019-20, but then it dropped to 10.6 percent in PLFS 2020-21.</p><p style="text-align:justify">In rural areas, the proportion of usual status male workers who worked as casual labour in other types of works <em>(i.e., excluding public works as well as MGNREGA) </em>remained at around 20 percent in various annual PLFS rounds. For the same category of workers in urban areas, this proportion marginally rose from 9.6 percent in PLFS 2018-19 to 9.8 percent in PLFS 2019-20, and further to 10.3 percent in 2020-21. Kindly consult table-1.</p><p style="text-align:justify">In rural areas, the proportion of usual status female workers who worked as casual labour in other types of works <em>(i.e., excluding public works as well as MGNREGA) </em>increased from 6.6 percent to 8.3 percent between PLFS 2018-19 and PLFS 2020-21. For the same category of workers in urban areas, this proportion remained the same in PLFS 2019-20 and PLFS 2020-21.&nbsp;Kindly look at table-2.</p><p style="text-align:justify">Please note&nbsp;that the&nbsp;<a href="https://im4change.org/upload/files/Annual%20Report%20PLFS%202020-21.pdf" title="https://im4change.org/upload/files/Annual%20Report%20PLFS%202020-21.pdf" title="https://im4change.org/upload/files/Annual%20Report%20PLFS%202020-21.pdf" title="https://im4change.org/upload/files/Annual%20Report%20PLFS%202020-21.pdf">Annual Report on PLFS 2020-2021</a>&nbsp;has also covered the period&nbsp;<em>(i.e., April-June, 2021)&nbsp;</em>when the state-wide lockdowns&nbsp;associated with the second wave of COVID-19&nbsp;were imposed. The&nbsp;<a href="https://im4change.org/upload/files/Annual_Report_PLFS_2019_20.pdf" title="https://im4change.org/upload/files/Annual_Report_PLFS_2019_20.pdf" title="https://im4change.org/upload/files/Annual_Report_PLFS_2019_20.pdf" title="https://im4change.org/upload/files/Annual_Report_PLFS_2019_20.pdf">Annual Report on PLFS 2019-20</a>&nbsp;too had covered the period&nbsp;<em>(i.e., April-June, 2020)</em>&nbsp;when the countrywide lockdown&nbsp;<em>(associated with the first year of the COVID-19 pandemic)&nbsp;</em>was imposed.&nbsp;</p><p style="text-align:justify"><em><strong>References</strong></em></p><p style="text-align:justify">Fourth Periodic Labour Force Survey Annual Report (July 2020-June 2021), released in June 2022, National Statistical Office (NSO), Ministry of Statistics and Programme Implementation (MoSPI), <a href="https://im4change.org/upload/files/Annual%20Report%20PLFS%202020-21.pdf" title="https://im4change.org/upload/files/Annual%20Report%20PLFS%202020-21.pdf">click here</a> to access &nbsp;</p><p style="text-align:justify">Third Periodic Labour Force Survey Annual Report (July 2019-June 2020), released in July 2021, National Statistical Office (NSO), Ministry of Statistics and Programme Implementation (MoSPI), please <a href="https://im4change.org/upload/files/Annual_Report_PLFS_2019_20.pdf" title="https://im4change.org/upload/files/Annual_Report_PLFS_2019_20.pdf">click here</a> to access &nbsp;</p><p style="text-align:justify">Second Periodic Labour Force Survey Annual Report (July 2018-June 2019), released in June 2020, National Statistical Office (NSO), Ministry of Statistics and Programme Implementation (MoSPI), please <a href="https://im4change.org/docs/annual-report-on-periodic-labour-force-survey-july-2018-june-2019.pdf" title="https://im4change.org/docs/annual-report-on-periodic-labour-force-survey-july-2018-june-2019.pdf">click here</a> to access &nbsp;</p><p style="text-align:justify">First Periodic Labour Force Survey Annual Report (July 2017-June 2018), released in May 2019, National Statistical Office (NSO), Ministry of Statistics and Programme Implementation (MoSPI), please <a href="https://im4change.org/docs/216Annual_Report_PLFS_2017_18_31052019.pdf" title="https://im4change.org/docs/216Annual_Report_PLFS_2017_18_31052019.pdf">click here</a> to access &nbsp;&nbsp;</p><p style="text-align:justify">News alert: Quality of work matters, and not just job creation, Inclusive Media for Change, Published on: Sep 26, 2022, please <a href="https://im4change.org/news-alerts-57/plfs-unemployment-rate-labour-force-participation-rate-worker-population-ratio-decent-work-social-security-quality-of-work-gainful-employment.html" title="https://im4change.org/news-alerts-57/plfs-unemployment-rate-labour-force-participation-rate-worker-population-ratio-decent-work-social-security-quality-of-work-gainful-employment.html">click here</a> to access</p><p style="text-align:justify">What&rsquo;s behind the &lsquo;improvement&rsquo; in employment situation in labour force survey report -PC Mohanan, ThePrint, 21 August, 2021, please <a href="https://theprint.in/opinion/what-is-behind-the-improvement-in-employment-situation/719674/" title="https://theprint.in/opinion/what-is-behind-the-improvement-in-employment-situation/719674/">click here</a> to access&nbsp;</p><p style="text-align:justify"><br /><strong>Image Courtesy: Inclusive Media for Change/ Himanshu Joshi</strong></p>',
'lang' => 'English',
'SITE_URL' => 'https://im4change.in/',
'site_title' => 'im4change',
'adminprix' => 'admin'
]
$article_current = object(App\Model\Entity\Article) {
'id' => (int) 63956,
'title' => 'How well did the women workers fare during the pandemic years? The yearly PLFS reports provide some mixed answers.',
'subheading' => null,
'description' => '<p style="text-align:justify">Do you want a job that does not pay you at all? The answer will be surely &#39;no&#39; for most of us. And yet, in our <a href="https://im4change.org/news-alerts-57/plfs-unemployment-rate-labour-force-participation-rate-worker-population-ratio-decent-work-social-security-quality-of-work-gainful-employment.html">previous analysis</a>, it was found that the proportion of &#39;helpers in household enterprises&#39; among the total number of workers grew over various rounds of annual PLFS <em>(Periodic Labour Force Survey)</em>, from 13.3 percent to 15.9 percent between PLFS 2018-19 and PLFS 2019-20, and then soared further to 17.3 percent in PLFS 2020-21.&nbsp;</p>
<p style="text-align:justify">The most elemental question that comes to one&rsquo;s mind is which gender took up such unpaid, low-quality jobs during the pandemic years and whether there was a rural-urban divide noticed in that trend.&nbsp;</p>
<p style="text-align:justify">Without further ado, it needs to be mentioned here that from table-15 of each of the annual PLFS reports <em>(please click <a href="https://im4change.org/upload/files/Annual%20Report%20PLFS%202020-21.pdf">here</a>, <a href="https://im4change.org/upload/files/Annual_Report_PLFS_2019_20.pdf">here</a>, <a href="https://im4change.org/docs/annual-report-on-periodic-labour-force-survey-july-2018-june-2019.pdf">here</a> and <a href="https://im4change.org/docs/216Annual_Report_PLFS_2017_18_31052019.pdf">here</a> to access)</em>, the proportion of male and female workers for various categories of work is extracted, and the data is presented as table-1 and table-2 in this analysis.</p>
<p style="text-align:justify">The categories of workers, which have been considered in the present news alert, are as follows:&nbsp;</p>
<p style="text-align:justify"><strong>Self-employed&nbsp;</strong></p>
<p style="text-align:justify">- Code 11: worked in household enterprises <em>(self-employed) </em>as own-account worker&nbsp;<br />
- Code 12: worked in household enterprises <em>(self-employed) </em>as an employer<br />
- Code 21: worked in household enterprises <em>(self-employed) </em>as helper&nbsp;</p>
<p style="text-align:justify"><strong>Regular/salaried&nbsp;</strong></p>
<p style="text-align:justify">- Code 31: worked as regular wage/salaried employee&nbsp;</p>
<p style="text-align:justify"><strong>Casual Workers&nbsp;</strong></p>
<p style="text-align:justify">- Code 41: worked as casual labour in public works other than MGNREG public works<br />
- Code 51: worked as casual labour in other types of works</p>
<p style="text-align:justify"><strong>Not working but seeking/available for work <em>(or unemployed)</em></strong></p>
<p style="text-align:justify">- Code 81: sought work or did not seek but was available for work <em>(for usual status approach)</em>&nbsp;</p>
<p style="text-align:justify"><strong>Neither working nor available for work <em>(or not in labour force)</em>&nbsp;</strong></p>
<p style="text-align:justify">- Code 97: others <em>(including beggars, prostitutes, etc.)</em></p>
<p style="text-align:justify"><strong>---</strong></p>
<p style="text-align:justify">In rural areas, the proportion of usual status male workers as self-employed <em>(sum of own-account workers and employers in household enterprises) </em>increased over various rounds of annual PLFS, from 34.7&nbsp;percent in PLFS 2017-18 to 36.6 percent in PLFS 2020-21. In urban areas too, for the same category of self-employed, this proportion went up between PLFS 2018-19 and PLFS 2020-21. Please see table-1.</p>
<p style="text-align:justify"><strong>Table 1: Percentage of usual status workers in different categories of 15 years plus population: Male</strong></p>
<p style="text-align:justify"><img alt="" src="/upload/images/Table%201%20Percentage%20of%20usual%20status%20workers%20in%20different%20categories%20of%2015%20plus%20population%20Male.png" style="height:295px; width:860px" /></p>
<p style="text-align:justify"><em><strong>Source: </strong>Fourth Periodic Labour Force Survey Annual Report (July 2020-June 2021), please <a href="https://im4change.org/upload/files/Annual%20Report%20PLFS%202020-21.pdf">click here</a> to access &nbsp;</em></p>
<p style="text-align:justify"><em>Third Periodic Labour Force Survey Annual Report (July 2019-June 2020), please <a href="https://im4change.org/upload/files/Annual_Report_PLFS_2019_20.pdf ">click here</a> to access &nbsp;</em></p>
<p style="text-align:justify"><em>Second Periodic Labour Force Survey Annual Report (July 2018-June 2019), please <a href="https://im4change.org/docs/annual-report-on-periodic-labour-force-survey-july-2018-june-2019.pdf ">click here</a> to access &nbsp;</em></p>
<p style="text-align:justify"><em>First Periodic Labour Force Survey Annual Report (July 2017-June 2018), please <a href="https://im4change.org/docs/216Annual_Report_PLFS_2017_18_31052019.pdf ">click here</a> to access &nbsp;</em></p>
<p style="text-align:justify"><strong>---</strong></p>
<p style="text-align:justify">The proportion of usual status female workers as self-employed <em>(sum of own-account workers and employers in household enterprises) </em>climbed up over various rounds of annual PLFS, from 4.5 percent in PLFS 2017-18 to 7.9 percent in PLFS 2020-21. In urban areas too, for the same category of self-employed, this proportion went up between PLFS 2017-18 and PLFS 2020-21. Kindly take a look at table-2.</p>
<p style="text-align:justify"><strong>Table 2: Percentage of usual status workers in different categories of 15 years plus population: Female</strong></p>
<p style="text-align:justify"><img alt="" src="/upload/images/Table%202%20Percentage%20of%20usual%20status%20workers%20in%20different%20categories%20of%2015%20plus%20population%20Female.png" style="height:295px; width:861px" /></p>
<p style="text-align:justify"><em><strong>Source: </strong>Same as table-1</em><br />
<strong>---</strong></p>
<p style="text-align:justify">As can be seen from table-1 of this analysis, although the proportion of usual status male workers as household enterprise helpers in rural areas came down slightly between PLFS 2017-18 and PLFS 2018-19, it gradually went up to 7.7&nbsp;percent in PLFS 2019-20, and further to 8.2&nbsp;percent in PLFS 2020-21.&nbsp;</p>
<p style="text-align:justify">In urban areas, after remaining unchanged for two successive rounds of annual PLFS, the proportion of usual status male workers as household enterprise helpers increased marginally to 3.1&nbsp;percent in PLFS 2020-21.&nbsp;</p>
<p style="text-align:justify"><span style="background-color:#ffcc00">In contrast to male workers, the proportion of usual status female workers as household enterprise helpers in rural areas increased over various rounds of annual PLFS, from 9.1 percent in PLFS 2017-18 to 15.3 percent in PLFS 2020-21. Between PLFS 2018-19 and PLFS 2019-20, there was a noticeable jump in the proportion of usual status female workers as household enterprise helpers in such areas. In rural areas, compared to its male counterpart, a higher proportion of usual status female workers worked as household enterprise helpers during each of the annual PLFS rounds, from PLFS 2017-18 to PLFS 2020-21.&nbsp;The gap between the proportion of usual status female workers as household enterprise helpers and that of its male counterpart in rural areas expanded from 2.1 percentage points (p.p.) to 7.1 p.p. between PLFS 2017-18 and PLFS 2020-21. Kindly compare table-1 against table-2.&nbsp;</span></p>
<p style="text-align:justify">In urban areas, the proportion of usual status female workers as household enterprise helpers increased over various rounds of annual PLFS, from 1.8 percent in PLFS 2018-19 to 2.6 percent in PLFS 2020-21.&nbsp;</p>
<p style="text-align:justify">In rural areas, the proportion of usual status male workers as regular/salaried workers remained almost the same between PLFS 2017-18 and PLFS 2020-21. However, the proportion of usual status male workers as regular/salaried workers decreased from 33.0 percent to 31.7 percent between PLFS 2019-20 and PLFS 2020-21 in urban areas. Please see table-1.</p>
<p style="text-align:justify">In rural areas, the proportion of usual status female workers as regular/salaried workers increased over various annual PLFS rounds, from 2.5 percent in PLFS 2017-18 to 3.3 percent in PLFS 2020-21. In urban areas, at first the proportion of usual status female workers as regular/salaried workers grew from 9.5 percent in PLFS 2017-18 to 11.5 percent in PLFS 2019-20, but then it dropped to 10.6 percent in PLFS 2020-21.</p>
<p style="text-align:justify">In rural areas, the proportion of usual status male workers who worked as casual labour in other types of works <em>(i.e., excluding public works as well as MGNREGA) </em>remained at around 20 percent in various annual PLFS rounds. For the same category of workers in urban areas, this proportion marginally rose from 9.6 percent in PLFS 2018-19 to 9.8 percent in PLFS 2019-20, and further to 10.3 percent in 2020-21. Kindly consult table-1.</p>
<p style="text-align:justify">In rural areas, the proportion of usual status female workers who worked as casual labour in other types of works <em>(i.e., excluding public works as well as MGNREGA) </em>increased from 6.6 percent to 8.3 percent between PLFS 2018-19 and PLFS 2020-21. For the same category of workers in urban areas, this proportion remained the same in PLFS 2019-20 and PLFS 2020-21.&nbsp;Kindly look at table-2.</p>
<p style="text-align:justify">Please note&nbsp;that the&nbsp;<a href="https://im4change.org/upload/files/Annual%20Report%20PLFS%202020-21.pdf" title="https://im4change.org/upload/files/Annual%20Report%20PLFS%202020-21.pdf">Annual Report on PLFS 2020-2021</a>&nbsp;has also covered the period&nbsp;<em>(i.e., April-June, 2021)&nbsp;</em>when the state-wide lockdowns&nbsp;associated with the second wave of COVID-19&nbsp;were imposed. The&nbsp;<a href="https://im4change.org/upload/files/Annual_Report_PLFS_2019_20.pdf" title="https://im4change.org/upload/files/Annual_Report_PLFS_2019_20.pdf">Annual Report on PLFS 2019-20</a>&nbsp;too had covered the period&nbsp;<em>(i.e., April-June, 2020)</em>&nbsp;when the countrywide lockdown&nbsp;<em>(associated with the first year of the COVID-19 pandemic)&nbsp;</em>was imposed.&nbsp;</p>
<p style="text-align:justify"><em><strong>References</strong></em></p>
<p style="text-align:justify">Fourth Periodic Labour Force Survey Annual Report (July 2020-June 2021), released in June 2022, National Statistical Office (NSO), Ministry of Statistics and Programme Implementation (MoSPI), <a href="https://im4change.org/upload/files/Annual%20Report%20PLFS%202020-21.pdf">click here</a> to access &nbsp;</p>
<p style="text-align:justify">Third Periodic Labour Force Survey Annual Report (July 2019-June 2020), released in July 2021, National Statistical Office (NSO), Ministry of Statistics and Programme Implementation (MoSPI), please <a href="https://im4change.org/upload/files/Annual_Report_PLFS_2019_20.pdf ">click here</a> to access &nbsp;</p>
<p style="text-align:justify">Second Periodic Labour Force Survey Annual Report (July 2018-June 2019), released in June 2020, National Statistical Office (NSO), Ministry of Statistics and Programme Implementation (MoSPI), please <a href="https://im4change.org/docs/annual-report-on-periodic-labour-force-survey-july-2018-june-2019.pdf ">click here</a> to access &nbsp;</p>
<p style="text-align:justify">First Periodic Labour Force Survey Annual Report (July 2017-June 2018), released in May 2019, National Statistical Office (NSO), Ministry of Statistics and Programme Implementation (MoSPI), please <a href="https://im4change.org/docs/216Annual_Report_PLFS_2017_18_31052019.pdf ">click here</a> to access &nbsp;&nbsp;</p>
<p style="text-align:justify">News alert: Quality of work matters, and not just job creation, Inclusive Media for Change, Published on: Sep 26, 2022, please <a href="https://im4change.org/news-alerts-57/plfs-unemployment-rate-labour-force-participation-rate-worker-population-ratio-decent-work-social-security-quality-of-work-gainful-employment.html">click here</a> to access</p>
<p style="text-align:justify">What&rsquo;s behind the &lsquo;improvement&rsquo; in employment situation in labour force survey report -PC Mohanan, ThePrint, 21 August, 2021, please <a href="https://theprint.in/opinion/what-is-behind-the-improvement-in-employment-situation/719674/ ">click here</a> to access&nbsp;</p>
<p style="text-align:justify"><br />
<strong>Image Courtesy: Inclusive Media for Change/ Himanshu Joshi</strong></p>
',
'credit_writer' => '',
'article_img' => 'Image Employment dated 7 Oct 2022.jpg',
'article_img_thumb' => 'Image Employment dated 7 Oct 2022.jpg',
'status' => (int) 1,
'show_on_home' => (int) 1,
'lang' => 'EN',
'category_id' => (int) 4,
'tag_keyword' => '',
'seo_url' => 'how-well-did-the-women-worker-fare-during-the-pandemic-years-plfs-reports-provide-some-mixed-answers-casual-workers-self-employed-unpaid-helpers-family-enterprises-regular-wage-salaried',
'meta_title' => '',
'meta_keywords' => '',
'meta_description' => '',
'noindex' => (int) 1,
'publish_date' => object(Cake\I18n\FrozenDate) {},
'most_visit_section_id' => null,
'article_big_img' => null,
'liveid' => null,
'created' => object(Cake\I18n\FrozenTime) {},
'modified' => object(Cake\I18n\FrozenTime) {},
'edate' => '',
'tags' => [
(int) 0 => object(Cake\ORM\Entity) {},
(int) 1 => object(Cake\ORM\Entity) {},
(int) 2 => object(Cake\ORM\Entity) {},
(int) 3 => object(Cake\ORM\Entity) {},
(int) 4 => object(Cake\ORM\Entity) {},
(int) 5 => object(Cake\ORM\Entity) {},
(int) 6 => object(Cake\ORM\Entity) {},
(int) 7 => object(Cake\ORM\Entity) {},
(int) 8 => object(Cake\ORM\Entity) {},
(int) 9 => object(Cake\ORM\Entity) {},
(int) 10 => object(Cake\ORM\Entity) {}
],
'category' => object(App\Model\Entity\Category) {},
'[new]' => false,
'[accessible]' => [
'*' => true,
'id' => false
],
'[dirty]' => [],
'[original]' => [],
'[virtual]' => [],
'[hasErrors]' => false,
'[errors]' => [],
'[invalid]' => [],
'[repository]' => 'Articles'
}
$articleid = (int) 63956
$metaTitle = 'NEWS ALERTS | How well did the women workers fare during the pandemic years? The yearly PLFS reports provide some mixed answers.'
$metaKeywords = 'Casual Workers,Female workers,Household Enterprises,Male workers,Periodic Labour Force Survey,PLFS,regular wage/salaried employee,Self Employed,Self-employed,Unpaid Helpers,Women workers'
$metaDesc = 'Do you want a job that does not pay you at all? The answer will be surely &#39;no&#39; for most of us. And yet, in our previous analysis, it was found that the proportion of &#39;helpers in household enterprises&#39; among...'
$disp = '<p style="text-align:justify">Do you want a job that does not pay you at all? The answer will be surely &#39;no&#39; for most of us. And yet, in our <a href="https://im4change.org/news-alerts-57/plfs-unemployment-rate-labour-force-participation-rate-worker-population-ratio-decent-work-social-security-quality-of-work-gainful-employment.html" title="https://im4change.org/news-alerts-57/plfs-unemployment-rate-labour-force-participation-rate-worker-population-ratio-decent-work-social-security-quality-of-work-gainful-employment.html">previous analysis</a>, it was found that the proportion of &#39;helpers in household enterprises&#39; among the total number of workers grew over various rounds of annual PLFS <em>(Periodic Labour Force Survey)</em>, from 13.3 percent to 15.9 percent between PLFS 2018-19 and PLFS 2019-20, and then soared further to 17.3 percent in PLFS 2020-21.&nbsp;</p><p style="text-align:justify">The most elemental question that comes to one&rsquo;s mind is which gender took up such unpaid, low-quality jobs during the pandemic years and whether there was a rural-urban divide noticed in that trend.&nbsp;</p><p style="text-align:justify">Without further ado, it needs to be mentioned here that from table-15 of each of the annual PLFS reports <em>(please click <a href="https://im4change.org/upload/files/Annual%20Report%20PLFS%202020-21.pdf" title="https://im4change.org/upload/files/Annual%20Report%20PLFS%202020-21.pdf">here</a>, <a href="https://im4change.org/upload/files/Annual_Report_PLFS_2019_20.pdf" title="https://im4change.org/upload/files/Annual_Report_PLFS_2019_20.pdf">here</a>, <a href="https://im4change.org/docs/annual-report-on-periodic-labour-force-survey-july-2018-june-2019.pdf" title="https://im4change.org/docs/annual-report-on-periodic-labour-force-survey-july-2018-june-2019.pdf">here</a> and <a href="https://im4change.org/docs/216Annual_Report_PLFS_2017_18_31052019.pdf" title="https://im4change.org/docs/216Annual_Report_PLFS_2017_18_31052019.pdf">here</a> to access)</em>, the proportion of male and female workers for various categories of work is extracted, and the data is presented as table-1 and table-2 in this analysis.</p><p style="text-align:justify">The categories of workers, which have been considered in the present news alert, are as follows:&nbsp;</p><p style="text-align:justify"><strong>Self-employed&nbsp;</strong></p><p style="text-align:justify">- Code 11: worked in household enterprises <em>(self-employed) </em>as own-account worker&nbsp;<br />- Code 12: worked in household enterprises <em>(self-employed) </em>as an employer<br />- Code 21: worked in household enterprises <em>(self-employed) </em>as helper&nbsp;</p><p style="text-align:justify"><strong>Regular/salaried&nbsp;</strong></p><p style="text-align:justify">- Code 31: worked as regular wage/salaried employee&nbsp;</p><p style="text-align:justify"><strong>Casual Workers&nbsp;</strong></p><p style="text-align:justify">- Code 41: worked as casual labour in public works other than MGNREG public works<br />- Code 51: worked as casual labour in other types of works</p><p style="text-align:justify"><strong>Not working but seeking/available for work <em>(or unemployed)</em></strong></p><p style="text-align:justify">- Code 81: sought work or did not seek but was available for work <em>(for usual status approach)</em>&nbsp;</p><p style="text-align:justify"><strong>Neither working nor available for work <em>(or not in labour force)</em>&nbsp;</strong></p><p style="text-align:justify">- Code 97: others <em>(including beggars, prostitutes, etc.)</em></p><p style="text-align:justify"><strong>---</strong></p><p style="text-align:justify">In rural areas, the proportion of usual status male workers as self-employed <em>(sum of own-account workers and employers in household enterprises) </em>increased over various rounds of annual PLFS, from 34.7&nbsp;percent in PLFS 2017-18 to 36.6 percent in PLFS 2020-21. In urban areas too, for the same category of self-employed, this proportion went up between PLFS 2018-19 and PLFS 2020-21. Please see table-1.</p><p style="text-align:justify"><strong>Table 1: Percentage of usual status workers in different categories of 15 years plus population: Male</strong></p><p style="text-align:justify"><img alt="" src="/upload/images/Table%201%20Percentage%20of%20usual%20status%20workers%20in%20different%20categories%20of%2015%20plus%20population%20Male.png" style="height:295px; width:860px" /></p><p style="text-align:justify"><em><strong>Source: </strong>Fourth Periodic Labour Force Survey Annual Report (July 2020-June 2021), please <a href="https://im4change.org/upload/files/Annual%20Report%20PLFS%202020-21.pdf" title="https://im4change.org/upload/files/Annual%20Report%20PLFS%202020-21.pdf">click here</a> to access &nbsp;</em></p><p style="text-align:justify"><em>Third Periodic Labour Force Survey Annual Report (July 2019-June 2020), please <a href="https://im4change.org/upload/files/Annual_Report_PLFS_2019_20.pdf" title="https://im4change.org/upload/files/Annual_Report_PLFS_2019_20.pdf">click here</a> to access &nbsp;</em></p><p style="text-align:justify"><em>Second Periodic Labour Force Survey Annual Report (July 2018-June 2019), please <a href="https://im4change.org/docs/annual-report-on-periodic-labour-force-survey-july-2018-june-2019.pdf" title="https://im4change.org/docs/annual-report-on-periodic-labour-force-survey-july-2018-june-2019.pdf">click here</a> to access &nbsp;</em></p><p style="text-align:justify"><em>First Periodic Labour Force Survey Annual Report (July 2017-June 2018), please <a href="https://im4change.org/docs/216Annual_Report_PLFS_2017_18_31052019.pdf" title="https://im4change.org/docs/216Annual_Report_PLFS_2017_18_31052019.pdf">click here</a> to access &nbsp;</em></p><p style="text-align:justify"><strong>---</strong></p><p style="text-align:justify">The proportion of usual status female workers as self-employed <em>(sum of own-account workers and employers in household enterprises) </em>climbed up over various rounds of annual PLFS, from 4.5 percent in PLFS 2017-18 to 7.9 percent in PLFS 2020-21. In urban areas too, for the same category of self-employed, this proportion went up between PLFS 2017-18 and PLFS 2020-21. Kindly take a look at table-2.</p><p style="text-align:justify"><strong>Table 2: Percentage of usual status workers in different categories of 15 years plus population: Female</strong></p><p style="text-align:justify"><img alt="" src="/upload/images/Table%202%20Percentage%20of%20usual%20status%20workers%20in%20different%20categories%20of%2015%20plus%20population%20Female.png" style="height:295px; width:861px" /></p><p style="text-align:justify"><em><strong>Source: </strong>Same as table-1</em><br /><strong>---</strong></p><p style="text-align:justify">As can be seen from table-1 of this analysis, although the proportion of usual status male workers as household enterprise helpers in rural areas came down slightly between PLFS 2017-18 and PLFS 2018-19, it gradually went up to 7.7&nbsp;percent in PLFS 2019-20, and further to 8.2&nbsp;percent in PLFS 2020-21.&nbsp;</p><p style="text-align:justify">In urban areas, after remaining unchanged for two successive rounds of annual PLFS, the proportion of usual status male workers as household enterprise helpers increased marginally to 3.1&nbsp;percent in PLFS 2020-21.&nbsp;</p><p style="text-align:justify"><span style="background-color:#ffcc00">In contrast to male workers, the proportion of usual status female workers as household enterprise helpers in rural areas increased over various rounds of annual PLFS, from 9.1 percent in PLFS 2017-18 to 15.3 percent in PLFS 2020-21. Between PLFS 2018-19 and PLFS 2019-20, there was a noticeable jump in the proportion of usual status female workers as household enterprise helpers in such areas. In rural areas, compared to its male counterpart, a higher proportion of usual status female workers worked as household enterprise helpers during each of the annual PLFS rounds, from PLFS 2017-18 to PLFS 2020-21.&nbsp;The gap between the proportion of usual status female workers as household enterprise helpers and that of its male counterpart in rural areas expanded from 2.1 percentage points (p.p.) to 7.1 p.p. between PLFS 2017-18 and PLFS 2020-21. Kindly compare table-1 against table-2.&nbsp;</span></p><p style="text-align:justify">In urban areas, the proportion of usual status female workers as household enterprise helpers increased over various rounds of annual PLFS, from 1.8 percent in PLFS 2018-19 to 2.6 percent in PLFS 2020-21.&nbsp;</p><p style="text-align:justify">In rural areas, the proportion of usual status male workers as regular/salaried workers remained almost the same between PLFS 2017-18 and PLFS 2020-21. However, the proportion of usual status male workers as regular/salaried workers decreased from 33.0 percent to 31.7 percent between PLFS 2019-20 and PLFS 2020-21 in urban areas. Please see table-1.</p><p style="text-align:justify">In rural areas, the proportion of usual status female workers as regular/salaried workers increased over various annual PLFS rounds, from 2.5 percent in PLFS 2017-18 to 3.3 percent in PLFS 2020-21. In urban areas, at first the proportion of usual status female workers as regular/salaried workers grew from 9.5 percent in PLFS 2017-18 to 11.5 percent in PLFS 2019-20, but then it dropped to 10.6 percent in PLFS 2020-21.</p><p style="text-align:justify">In rural areas, the proportion of usual status male workers who worked as casual labour in other types of works <em>(i.e., excluding public works as well as MGNREGA) </em>remained at around 20 percent in various annual PLFS rounds. For the same category of workers in urban areas, this proportion marginally rose from 9.6 percent in PLFS 2018-19 to 9.8 percent in PLFS 2019-20, and further to 10.3 percent in 2020-21. Kindly consult table-1.</p><p style="text-align:justify">In rural areas, the proportion of usual status female workers who worked as casual labour in other types of works <em>(i.e., excluding public works as well as MGNREGA) </em>increased from 6.6 percent to 8.3 percent between PLFS 2018-19 and PLFS 2020-21. For the same category of workers in urban areas, this proportion remained the same in PLFS 2019-20 and PLFS 2020-21.&nbsp;Kindly look at table-2.</p><p style="text-align:justify">Please note&nbsp;that the&nbsp;<a href="https://im4change.org/upload/files/Annual%20Report%20PLFS%202020-21.pdf" title="https://im4change.org/upload/files/Annual%20Report%20PLFS%202020-21.pdf" title="https://im4change.org/upload/files/Annual%20Report%20PLFS%202020-21.pdf" title="https://im4change.org/upload/files/Annual%20Report%20PLFS%202020-21.pdf">Annual Report on PLFS 2020-2021</a>&nbsp;has also covered the period&nbsp;<em>(i.e., April-June, 2021)&nbsp;</em>when the state-wide lockdowns&nbsp;associated with the second wave of COVID-19&nbsp;were imposed. The&nbsp;<a href="https://im4change.org/upload/files/Annual_Report_PLFS_2019_20.pdf" title="https://im4change.org/upload/files/Annual_Report_PLFS_2019_20.pdf" title="https://im4change.org/upload/files/Annual_Report_PLFS_2019_20.pdf" title="https://im4change.org/upload/files/Annual_Report_PLFS_2019_20.pdf">Annual Report on PLFS 2019-20</a>&nbsp;too had covered the period&nbsp;<em>(i.e., April-June, 2020)</em>&nbsp;when the countrywide lockdown&nbsp;<em>(associated with the first year of the COVID-19 pandemic)&nbsp;</em>was imposed.&nbsp;</p><p style="text-align:justify"><em><strong>References</strong></em></p><p style="text-align:justify">Fourth Periodic Labour Force Survey Annual Report (July 2020-June 2021), released in June 2022, National Statistical Office (NSO), Ministry of Statistics and Programme Implementation (MoSPI), <a href="https://im4change.org/upload/files/Annual%20Report%20PLFS%202020-21.pdf" title="https://im4change.org/upload/files/Annual%20Report%20PLFS%202020-21.pdf">click here</a> to access &nbsp;</p><p style="text-align:justify">Third Periodic Labour Force Survey Annual Report (July 2019-June 2020), released in July 2021, National Statistical Office (NSO), Ministry of Statistics and Programme Implementation (MoSPI), please <a href="https://im4change.org/upload/files/Annual_Report_PLFS_2019_20.pdf" title="https://im4change.org/upload/files/Annual_Report_PLFS_2019_20.pdf">click here</a> to access &nbsp;</p><p style="text-align:justify">Second Periodic Labour Force Survey Annual Report (July 2018-June 2019), released in June 2020, National Statistical Office (NSO), Ministry of Statistics and Programme Implementation (MoSPI), please <a href="https://im4change.org/docs/annual-report-on-periodic-labour-force-survey-july-2018-june-2019.pdf" title="https://im4change.org/docs/annual-report-on-periodic-labour-force-survey-july-2018-june-2019.pdf">click here</a> to access &nbsp;</p><p style="text-align:justify">First Periodic Labour Force Survey Annual Report (July 2017-June 2018), released in May 2019, National Statistical Office (NSO), Ministry of Statistics and Programme Implementation (MoSPI), please <a href="https://im4change.org/docs/216Annual_Report_PLFS_2017_18_31052019.pdf" title="https://im4change.org/docs/216Annual_Report_PLFS_2017_18_31052019.pdf">click here</a> to access &nbsp;&nbsp;</p><p style="text-align:justify">News alert: Quality of work matters, and not just job creation, Inclusive Media for Change, Published on: Sep 26, 2022, please <a href="https://im4change.org/news-alerts-57/plfs-unemployment-rate-labour-force-participation-rate-worker-population-ratio-decent-work-social-security-quality-of-work-gainful-employment.html" title="https://im4change.org/news-alerts-57/plfs-unemployment-rate-labour-force-participation-rate-worker-population-ratio-decent-work-social-security-quality-of-work-gainful-employment.html">click here</a> to access</p><p style="text-align:justify">What&rsquo;s behind the &lsquo;improvement&rsquo; in employment situation in labour force survey report -PC Mohanan, ThePrint, 21 August, 2021, please <a href="https://theprint.in/opinion/what-is-behind-the-improvement-in-employment-situation/719674/" title="https://theprint.in/opinion/what-is-behind-the-improvement-in-employment-situation/719674/">click here</a> to access&nbsp;</p><p style="text-align:justify"><br /><strong>Image Courtesy: Inclusive Media for Change/ Himanshu Joshi</strong></p>'
$lang = 'English'
$SITE_URL = 'https://im4change.in/'
$site_title = 'im4change'
$adminprix = 'admin'</pre><pre class="stack-trace">include - APP/Template/Layout/printlayout.ctp, line 8
Cake\View\View::_evaluate() - CORE/src/View/View.php, line 1413
Cake\View\View::_render() - CORE/src/View/View.php, line 1374
Cake\View\View::renderLayout() - CORE/src/View/View.php, line 927
Cake\View\View::render() - CORE/src/View/View.php, line 885
Cake\Controller\Controller::render() - CORE/src/Controller/Controller.php, line 791
Cake\Http\ActionDispatcher::_invoke() - CORE/src/Http/ActionDispatcher.php, line 126
Cake\Http\ActionDispatcher::dispatch() - CORE/src/Http/ActionDispatcher.php, line 94
Cake\Http\BaseApplication::__invoke() - CORE/src/Http/BaseApplication.php, line 235
Cake\Http\Runner::__invoke() - CORE/src/Http/Runner.php, line 65
Cake\Routing\Middleware\RoutingMiddleware::__invoke() - CORE/src/Routing/Middleware/RoutingMiddleware.php, line 162
Cake\Http\Runner::__invoke() - CORE/src/Http/Runner.php, line 65
Cake\Routing\Middleware\AssetMiddleware::__invoke() - CORE/src/Routing/Middleware/AssetMiddleware.php, line 88
Cake\Http\Runner::__invoke() - CORE/src/Http/Runner.php, line 65
Cake\Error\Middleware\ErrorHandlerMiddleware::__invoke() - CORE/src/Error/Middleware/ErrorHandlerMiddleware.php, line 96
Cake\Http\Runner::__invoke() - CORE/src/Http/Runner.php, line 65
Cake\Http\Runner::run() - CORE/src/Http/Runner.php, line 51</pre></div></pre>news-alerts-57/how-well-did-the-women-worker-fare-during-the-pandemic-years-plfs-reports-provide-some-mixed-answers-casual-workers-self-employed-unpaid-helpers-family-enterprises-regular-wage-salaried.html"/>
<meta http-equiv="Content-Type" content="text/html; charset=utf-8"/>
<link href="https://im4change.in/css/control.css" rel="stylesheet" type="text/css"
media="all"/>
<title>NEWS ALERTS | How well did the women workers fare during the pandemic years? The yearly PLFS reports provide some mixed answers. | Im4change.org</title>
<meta name="description" content="Do you want a job that does not pay you at all? The answer will be surely 'no' for most of us. And yet, in our previous analysis, it was found that the proportion of 'helpers in household enterprises' among..."/>
<script src="https://im4change.in/js/jquery-1.10.2.js"></script>
<script type="text/javascript" src="https://im4change.in/js/jquery-migrate.min.js"></script>
<script language="javascript" type="text/javascript">
$(document).ready(function () {
var img = $("img")[0]; // Get my img elem
var pic_real_width, pic_real_height;
$("<img/>") // Make in memory copy of image to avoid css issues
.attr("src", $(img).attr("src"))
.load(function () {
pic_real_width = this.width; // Note: $(this).width() will not
pic_real_height = this.height; // work for in memory images.
});
});
</script>
<style type="text/css">
@media screen {
div.divFooter {
display: block;
}
}
@media print {
.printbutton {
display: none !important;
}
}
</style>
</head>
<body>
<table cellpadding="0" cellspacing="0" border="0" width="98%" align="center">
<tr>
<td class="top_bg">
<div class="divFooter">
<img src="https://im4change.in/images/logo1.jpg" height="59" border="0"
alt="Resource centre on India's rural distress" style="padding-top:14px;"/>
</div>
</td>
</tr>
<tr>
<td id="topspace"> </td>
</tr>
<tr id="topspace">
<td> </td>
</tr>
<tr>
<td height="50" style="border-bottom:1px solid #000; padding-top:10px;" class="printbutton">
<form><input type="button" value=" Print this page "
onclick="window.print();return false;"/></form>
</td>
</tr>
<tr>
<td width="100%">
<h1 class="news_headlines" style="font-style:normal">
<strong>How well did the women workers fare during the pandemic years? The yearly PLFS reports provide some mixed answers.</strong></h1>
</td>
</tr>
<tr>
<td width="100%" style="font-family:Arial, 'Segoe Script', 'Segoe UI', sans-serif, serif"><font size="3">
<p style="text-align:justify">Do you want a job that does not pay you at all? The answer will be surely 'no' for most of us. And yet, in our <a href="https://im4change.org/news-alerts-57/plfs-unemployment-rate-labour-force-participation-rate-worker-population-ratio-decent-work-social-security-quality-of-work-gainful-employment.html" title="https://im4change.org/news-alerts-57/plfs-unemployment-rate-labour-force-participation-rate-worker-population-ratio-decent-work-social-security-quality-of-work-gainful-employment.html">previous analysis</a>, it was found that the proportion of 'helpers in household enterprises' among the total number of workers grew over various rounds of annual PLFS <em>(Periodic Labour Force Survey)</em>, from 13.3 percent to 15.9 percent between PLFS 2018-19 and PLFS 2019-20, and then soared further to 17.3 percent in PLFS 2020-21. </p><p style="text-align:justify">The most elemental question that comes to one’s mind is which gender took up such unpaid, low-quality jobs during the pandemic years and whether there was a rural-urban divide noticed in that trend. </p><p style="text-align:justify">Without further ado, it needs to be mentioned here that from table-15 of each of the annual PLFS reports <em>(please click <a href="https://im4change.org/upload/files/Annual%20Report%20PLFS%202020-21.pdf" title="https://im4change.org/upload/files/Annual%20Report%20PLFS%202020-21.pdf">here</a>, <a href="https://im4change.org/upload/files/Annual_Report_PLFS_2019_20.pdf" title="https://im4change.org/upload/files/Annual_Report_PLFS_2019_20.pdf">here</a>, <a href="https://im4change.org/docs/annual-report-on-periodic-labour-force-survey-july-2018-june-2019.pdf" title="https://im4change.org/docs/annual-report-on-periodic-labour-force-survey-july-2018-june-2019.pdf">here</a> and <a href="https://im4change.org/docs/216Annual_Report_PLFS_2017_18_31052019.pdf" title="https://im4change.org/docs/216Annual_Report_PLFS_2017_18_31052019.pdf">here</a> to access)</em>, the proportion of male and female workers for various categories of work is extracted, and the data is presented as table-1 and table-2 in this analysis.</p><p style="text-align:justify">The categories of workers, which have been considered in the present news alert, are as follows: </p><p style="text-align:justify"><strong>Self-employed </strong></p><p style="text-align:justify">- Code 11: worked in household enterprises <em>(self-employed) </em>as own-account worker <br />- Code 12: worked in household enterprises <em>(self-employed) </em>as an employer<br />- Code 21: worked in household enterprises <em>(self-employed) </em>as helper </p><p style="text-align:justify"><strong>Regular/salaried </strong></p><p style="text-align:justify">- Code 31: worked as regular wage/salaried employee </p><p style="text-align:justify"><strong>Casual Workers </strong></p><p style="text-align:justify">- Code 41: worked as casual labour in public works other than MGNREG public works<br />- Code 51: worked as casual labour in other types of works</p><p style="text-align:justify"><strong>Not working but seeking/available for work <em>(or unemployed)</em></strong></p><p style="text-align:justify">- Code 81: sought work or did not seek but was available for work <em>(for usual status approach)</em> </p><p style="text-align:justify"><strong>Neither working nor available for work <em>(or not in labour force)</em> </strong></p><p style="text-align:justify">- Code 97: others <em>(including beggars, prostitutes, etc.)</em></p><p style="text-align:justify"><strong>---</strong></p><p style="text-align:justify">In rural areas, the proportion of usual status male workers as self-employed <em>(sum of own-account workers and employers in household enterprises) </em>increased over various rounds of annual PLFS, from 34.7 percent in PLFS 2017-18 to 36.6 percent in PLFS 2020-21. In urban areas too, for the same category of self-employed, this proportion went up between PLFS 2018-19 and PLFS 2020-21. Please see table-1.</p><p style="text-align:justify"><strong>Table 1: Percentage of usual status workers in different categories of 15 years plus population: Male</strong></p><p style="text-align:justify"><img alt="" src="/upload/images/Table%201%20Percentage%20of%20usual%20status%20workers%20in%20different%20categories%20of%2015%20plus%20population%20Male.png" style="height:295px; width:860px" /></p><p style="text-align:justify"><em><strong>Source: </strong>Fourth Periodic Labour Force Survey Annual Report (July 2020-June 2021), please <a href="https://im4change.org/upload/files/Annual%20Report%20PLFS%202020-21.pdf" title="https://im4change.org/upload/files/Annual%20Report%20PLFS%202020-21.pdf">click here</a> to access </em></p><p style="text-align:justify"><em>Third Periodic Labour Force Survey Annual Report (July 2019-June 2020), please <a href="https://im4change.org/upload/files/Annual_Report_PLFS_2019_20.pdf" title="https://im4change.org/upload/files/Annual_Report_PLFS_2019_20.pdf">click here</a> to access </em></p><p style="text-align:justify"><em>Second Periodic Labour Force Survey Annual Report (July 2018-June 2019), please <a href="https://im4change.org/docs/annual-report-on-periodic-labour-force-survey-july-2018-june-2019.pdf" title="https://im4change.org/docs/annual-report-on-periodic-labour-force-survey-july-2018-june-2019.pdf">click here</a> to access </em></p><p style="text-align:justify"><em>First Periodic Labour Force Survey Annual Report (July 2017-June 2018), please <a href="https://im4change.org/docs/216Annual_Report_PLFS_2017_18_31052019.pdf" title="https://im4change.org/docs/216Annual_Report_PLFS_2017_18_31052019.pdf">click here</a> to access </em></p><p style="text-align:justify"><strong>---</strong></p><p style="text-align:justify">The proportion of usual status female workers as self-employed <em>(sum of own-account workers and employers in household enterprises) </em>climbed up over various rounds of annual PLFS, from 4.5 percent in PLFS 2017-18 to 7.9 percent in PLFS 2020-21. In urban areas too, for the same category of self-employed, this proportion went up between PLFS 2017-18 and PLFS 2020-21. Kindly take a look at table-2.</p><p style="text-align:justify"><strong>Table 2: Percentage of usual status workers in different categories of 15 years plus population: Female</strong></p><p style="text-align:justify"><img alt="" src="/upload/images/Table%202%20Percentage%20of%20usual%20status%20workers%20in%20different%20categories%20of%2015%20plus%20population%20Female.png" style="height:295px; width:861px" /></p><p style="text-align:justify"><em><strong>Source: </strong>Same as table-1</em><br /><strong>---</strong></p><p style="text-align:justify">As can be seen from table-1 of this analysis, although the proportion of usual status male workers as household enterprise helpers in rural areas came down slightly between PLFS 2017-18 and PLFS 2018-19, it gradually went up to 7.7 percent in PLFS 2019-20, and further to 8.2 percent in PLFS 2020-21. </p><p style="text-align:justify">In urban areas, after remaining unchanged for two successive rounds of annual PLFS, the proportion of usual status male workers as household enterprise helpers increased marginally to 3.1 percent in PLFS 2020-21. </p><p style="text-align:justify"><span style="background-color:#ffcc00">In contrast to male workers, the proportion of usual status female workers as household enterprise helpers in rural areas increased over various rounds of annual PLFS, from 9.1 percent in PLFS 2017-18 to 15.3 percent in PLFS 2020-21. Between PLFS 2018-19 and PLFS 2019-20, there was a noticeable jump in the proportion of usual status female workers as household enterprise helpers in such areas. In rural areas, compared to its male counterpart, a higher proportion of usual status female workers worked as household enterprise helpers during each of the annual PLFS rounds, from PLFS 2017-18 to PLFS 2020-21. The gap between the proportion of usual status female workers as household enterprise helpers and that of its male counterpart in rural areas expanded from 2.1 percentage points (p.p.) to 7.1 p.p. between PLFS 2017-18 and PLFS 2020-21. Kindly compare table-1 against table-2. </span></p><p style="text-align:justify">In urban areas, the proportion of usual status female workers as household enterprise helpers increased over various rounds of annual PLFS, from 1.8 percent in PLFS 2018-19 to 2.6 percent in PLFS 2020-21. </p><p style="text-align:justify">In rural areas, the proportion of usual status male workers as regular/salaried workers remained almost the same between PLFS 2017-18 and PLFS 2020-21. However, the proportion of usual status male workers as regular/salaried workers decreased from 33.0 percent to 31.7 percent between PLFS 2019-20 and PLFS 2020-21 in urban areas. Please see table-1.</p><p style="text-align:justify">In rural areas, the proportion of usual status female workers as regular/salaried workers increased over various annual PLFS rounds, from 2.5 percent in PLFS 2017-18 to 3.3 percent in PLFS 2020-21. In urban areas, at first the proportion of usual status female workers as regular/salaried workers grew from 9.5 percent in PLFS 2017-18 to 11.5 percent in PLFS 2019-20, but then it dropped to 10.6 percent in PLFS 2020-21.</p><p style="text-align:justify">In rural areas, the proportion of usual status male workers who worked as casual labour in other types of works <em>(i.e., excluding public works as well as MGNREGA) </em>remained at around 20 percent in various annual PLFS rounds. For the same category of workers in urban areas, this proportion marginally rose from 9.6 percent in PLFS 2018-19 to 9.8 percent in PLFS 2019-20, and further to 10.3 percent in 2020-21. Kindly consult table-1.</p><p style="text-align:justify">In rural areas, the proportion of usual status female workers who worked as casual labour in other types of works <em>(i.e., excluding public works as well as MGNREGA) </em>increased from 6.6 percent to 8.3 percent between PLFS 2018-19 and PLFS 2020-21. For the same category of workers in urban areas, this proportion remained the same in PLFS 2019-20 and PLFS 2020-21. Kindly look at table-2.</p><p style="text-align:justify">Please note that the <a href="https://im4change.org/upload/files/Annual%20Report%20PLFS%202020-21.pdf" title="https://im4change.org/upload/files/Annual%20Report%20PLFS%202020-21.pdf" title="https://im4change.org/upload/files/Annual%20Report%20PLFS%202020-21.pdf" title="https://im4change.org/upload/files/Annual%20Report%20PLFS%202020-21.pdf">Annual Report on PLFS 2020-2021</a> has also covered the period <em>(i.e., April-June, 2021) </em>when the state-wide lockdowns associated with the second wave of COVID-19 were imposed. The <a href="https://im4change.org/upload/files/Annual_Report_PLFS_2019_20.pdf" title="https://im4change.org/upload/files/Annual_Report_PLFS_2019_20.pdf" title="https://im4change.org/upload/files/Annual_Report_PLFS_2019_20.pdf" title="https://im4change.org/upload/files/Annual_Report_PLFS_2019_20.pdf">Annual Report on PLFS 2019-20</a> too had covered the period <em>(i.e., April-June, 2020)</em> when the countrywide lockdown <em>(associated with the first year of the COVID-19 pandemic) </em>was imposed. </p><p style="text-align:justify"><em><strong>References</strong></em></p><p style="text-align:justify">Fourth Periodic Labour Force Survey Annual Report (July 2020-June 2021), released in June 2022, National Statistical Office (NSO), Ministry of Statistics and Programme Implementation (MoSPI), <a href="https://im4change.org/upload/files/Annual%20Report%20PLFS%202020-21.pdf" title="https://im4change.org/upload/files/Annual%20Report%20PLFS%202020-21.pdf">click here</a> to access </p><p style="text-align:justify">Third Periodic Labour Force Survey Annual Report (July 2019-June 2020), released in July 2021, National Statistical Office (NSO), Ministry of Statistics and Programme Implementation (MoSPI), please <a href="https://im4change.org/upload/files/Annual_Report_PLFS_2019_20.pdf" title="https://im4change.org/upload/files/Annual_Report_PLFS_2019_20.pdf">click here</a> to access </p><p style="text-align:justify">Second Periodic Labour Force Survey Annual Report (July 2018-June 2019), released in June 2020, National Statistical Office (NSO), Ministry of Statistics and Programme Implementation (MoSPI), please <a href="https://im4change.org/docs/annual-report-on-periodic-labour-force-survey-july-2018-june-2019.pdf" title="https://im4change.org/docs/annual-report-on-periodic-labour-force-survey-july-2018-june-2019.pdf">click here</a> to access </p><p style="text-align:justify">First Periodic Labour Force Survey Annual Report (July 2017-June 2018), released in May 2019, National Statistical Office (NSO), Ministry of Statistics and Programme Implementation (MoSPI), please <a href="https://im4change.org/docs/216Annual_Report_PLFS_2017_18_31052019.pdf" title="https://im4change.org/docs/216Annual_Report_PLFS_2017_18_31052019.pdf">click here</a> to access </p><p style="text-align:justify">News alert: Quality of work matters, and not just job creation, Inclusive Media for Change, Published on: Sep 26, 2022, please <a href="https://im4change.org/news-alerts-57/plfs-unemployment-rate-labour-force-participation-rate-worker-population-ratio-decent-work-social-security-quality-of-work-gainful-employment.html" title="https://im4change.org/news-alerts-57/plfs-unemployment-rate-labour-force-participation-rate-worker-population-ratio-decent-work-social-security-quality-of-work-gainful-employment.html">click here</a> to access</p><p style="text-align:justify">What’s behind the ‘improvement’ in employment situation in labour force survey report -PC Mohanan, ThePrint, 21 August, 2021, please <a href="https://theprint.in/opinion/what-is-behind-the-improvement-in-employment-situation/719674/" title="https://theprint.in/opinion/what-is-behind-the-improvement-in-employment-situation/719674/">click here</a> to access </p><p style="text-align:justify"><br /><strong>Image Courtesy: Inclusive Media for Change/ Himanshu Joshi</strong></p> </font>
</td>
</tr>
<tr>
<td> </td>
</tr>
<tr>
<td height="50" style="border-top:1px solid #000; border-bottom:1px solid #000;padding-top:10px;">
<form><input type="button" value=" Print this page "
onclick="window.print();return false;"/></form>
</td>
</tr>
</table></body>
</html>'
}
$maxBufferLength = (int) 8192
$file = '/home/brlfuser/public_html/vendor/cakephp/cakephp/src/Error/Debugger.php'
$line = (int) 853
$message = 'Unable to emit headers. Headers sent in file=/home/brlfuser/public_html/vendor/cakephp/cakephp/src/Error/Debugger.php line=853'
Cake\Http\ResponseEmitter::emit() - CORE/src/Http/ResponseEmitter.php, line 48
Cake\Http\Server::emit() - CORE/src/Http/Server.php, line 141
[main] - ROOT/webroot/index.php, line 39
Warning (2): Cannot modify header information - headers already sent by (output started at /home/brlfuser/public_html/vendor/cakephp/cakephp/src/Error/Debugger.php:853) [CORE/src/Http/ResponseEmitter.php, line 148]
$response = object(Cake\Http\Response) {
'status' => (int) 200,
'contentType' => 'text/html',
'headers' => [
'Content-Type' => [
[maximum depth reached]
]
],
'file' => null,
'fileRange' => [],
'cookies' => object(Cake\Http\Cookie\CookieCollection) {},
'cacheDirectives' => [],
'body' => '<!DOCTYPE html PUBLIC "-//W3C//DTD XHTML 1.0 Transitional//EN"
"http://www.w3.org/TR/xhtml1/DTD/xhtml1-transitional.dtd">
<html xmlns="http://www.w3.org/1999/xhtml">
<head>
<link rel="canonical" href="https://im4change.in/<pre class="cake-error"><a href="javascript:void(0);" onclick="document.getElementById('cakeErr67f4892922ad8-trace').style.display = (document.getElementById('cakeErr67f4892922ad8-trace').style.display == 'none' ? '' : 'none');"><b>Notice</b> (8)</a>: Undefined variable: urlPrefix [<b>APP/Template/Layout/printlayout.ctp</b>, line <b>8</b>]<div id="cakeErr67f4892922ad8-trace" class="cake-stack-trace" style="display: none;"><a href="javascript:void(0);" onclick="document.getElementById('cakeErr67f4892922ad8-code').style.display = (document.getElementById('cakeErr67f4892922ad8-code').style.display == 'none' ? '' : 'none')">Code</a> <a href="javascript:void(0);" onclick="document.getElementById('cakeErr67f4892922ad8-context').style.display = (document.getElementById('cakeErr67f4892922ad8-context').style.display == 'none' ? '' : 'none')">Context</a><pre id="cakeErr67f4892922ad8-code" class="cake-code-dump" style="display: none;"><code><span style="color: #000000"><span style="color: #0000BB"></span><span style="color: #007700"><</span><span style="color: #0000BB">head</span><span style="color: #007700">>
</span></span></code>
<span class="code-highlight"><code><span style="color: #000000"> <link rel="canonical" href="<span style="color: #0000BB"><?php </span><span style="color: #007700">echo </span><span style="color: #0000BB">Configure</span><span style="color: #007700">::</span><span style="color: #0000BB">read</span><span style="color: #007700">(</span><span style="color: #DD0000">'SITE_URL'</span><span style="color: #007700">); </span><span style="color: #0000BB">?><?php </span><span style="color: #007700">echo </span><span style="color: #0000BB">$urlPrefix</span><span style="color: #007700">;</span><span style="color: #0000BB">?><?php </span><span style="color: #007700">echo </span><span style="color: #0000BB">$article_current</span><span style="color: #007700">-></span><span style="color: #0000BB">category</span><span style="color: #007700">-></span><span style="color: #0000BB">slug</span><span style="color: #007700">; </span><span style="color: #0000BB">?></span>/<span style="color: #0000BB"><?php </span><span style="color: #007700">echo </span><span style="color: #0000BB">$article_current</span><span style="color: #007700">-></span><span style="color: #0000BB">seo_url</span><span style="color: #007700">; </span><span style="color: #0000BB">?></span>.html"/>
</span></code></span>
<code><span style="color: #000000"><span style="color: #0000BB"> </span><span style="color: #007700"><</span><span style="color: #0000BB">meta http</span><span style="color: #007700">-</span><span style="color: #0000BB">equiv</span><span style="color: #007700">=</span><span style="color: #DD0000">"Content-Type" </span><span style="color: #0000BB">content</span><span style="color: #007700">=</span><span style="color: #DD0000">"text/html; charset=utf-8"</span><span style="color: #007700">/>
</span></span></code></pre><pre id="cakeErr67f4892922ad8-context" class="cake-context" style="display: none;">$viewFile = '/home/brlfuser/public_html/src/Template/Layout/printlayout.ctp'
$dataForView = [
'article_current' => object(App\Model\Entity\Article) {
'id' => (int) 63956,
'title' => 'How well did the women workers fare during the pandemic years? The yearly PLFS reports provide some mixed answers.',
'subheading' => null,
'description' => '<p style="text-align:justify">Do you want a job that does not pay you at all? The answer will be surely &#39;no&#39; for most of us. And yet, in our <a href="https://im4change.org/news-alerts-57/plfs-unemployment-rate-labour-force-participation-rate-worker-population-ratio-decent-work-social-security-quality-of-work-gainful-employment.html">previous analysis</a>, it was found that the proportion of &#39;helpers in household enterprises&#39; among the total number of workers grew over various rounds of annual PLFS <em>(Periodic Labour Force Survey)</em>, from 13.3 percent to 15.9 percent between PLFS 2018-19 and PLFS 2019-20, and then soared further to 17.3 percent in PLFS 2020-21.&nbsp;</p>
<p style="text-align:justify">The most elemental question that comes to one&rsquo;s mind is which gender took up such unpaid, low-quality jobs during the pandemic years and whether there was a rural-urban divide noticed in that trend.&nbsp;</p>
<p style="text-align:justify">Without further ado, it needs to be mentioned here that from table-15 of each of the annual PLFS reports <em>(please click <a href="https://im4change.org/upload/files/Annual%20Report%20PLFS%202020-21.pdf">here</a>, <a href="https://im4change.org/upload/files/Annual_Report_PLFS_2019_20.pdf">here</a>, <a href="https://im4change.org/docs/annual-report-on-periodic-labour-force-survey-july-2018-june-2019.pdf">here</a> and <a href="https://im4change.org/docs/216Annual_Report_PLFS_2017_18_31052019.pdf">here</a> to access)</em>, the proportion of male and female workers for various categories of work is extracted, and the data is presented as table-1 and table-2 in this analysis.</p>
<p style="text-align:justify">The categories of workers, which have been considered in the present news alert, are as follows:&nbsp;</p>
<p style="text-align:justify"><strong>Self-employed&nbsp;</strong></p>
<p style="text-align:justify">- Code 11: worked in household enterprises <em>(self-employed) </em>as own-account worker&nbsp;<br />
- Code 12: worked in household enterprises <em>(self-employed) </em>as an employer<br />
- Code 21: worked in household enterprises <em>(self-employed) </em>as helper&nbsp;</p>
<p style="text-align:justify"><strong>Regular/salaried&nbsp;</strong></p>
<p style="text-align:justify">- Code 31: worked as regular wage/salaried employee&nbsp;</p>
<p style="text-align:justify"><strong>Casual Workers&nbsp;</strong></p>
<p style="text-align:justify">- Code 41: worked as casual labour in public works other than MGNREG public works<br />
- Code 51: worked as casual labour in other types of works</p>
<p style="text-align:justify"><strong>Not working but seeking/available for work <em>(or unemployed)</em></strong></p>
<p style="text-align:justify">- Code 81: sought work or did not seek but was available for work <em>(for usual status approach)</em>&nbsp;</p>
<p style="text-align:justify"><strong>Neither working nor available for work <em>(or not in labour force)</em>&nbsp;</strong></p>
<p style="text-align:justify">- Code 97: others <em>(including beggars, prostitutes, etc.)</em></p>
<p style="text-align:justify"><strong>---</strong></p>
<p style="text-align:justify">In rural areas, the proportion of usual status male workers as self-employed <em>(sum of own-account workers and employers in household enterprises) </em>increased over various rounds of annual PLFS, from 34.7&nbsp;percent in PLFS 2017-18 to 36.6 percent in PLFS 2020-21. In urban areas too, for the same category of self-employed, this proportion went up between PLFS 2018-19 and PLFS 2020-21. Please see table-1.</p>
<p style="text-align:justify"><strong>Table 1: Percentage of usual status workers in different categories of 15 years plus population: Male</strong></p>
<p style="text-align:justify"><img alt="" src="/upload/images/Table%201%20Percentage%20of%20usual%20status%20workers%20in%20different%20categories%20of%2015%20plus%20population%20Male.png" style="height:295px; width:860px" /></p>
<p style="text-align:justify"><em><strong>Source: </strong>Fourth Periodic Labour Force Survey Annual Report (July 2020-June 2021), please <a href="https://im4change.org/upload/files/Annual%20Report%20PLFS%202020-21.pdf">click here</a> to access &nbsp;</em></p>
<p style="text-align:justify"><em>Third Periodic Labour Force Survey Annual Report (July 2019-June 2020), please <a href="https://im4change.org/upload/files/Annual_Report_PLFS_2019_20.pdf ">click here</a> to access &nbsp;</em></p>
<p style="text-align:justify"><em>Second Periodic Labour Force Survey Annual Report (July 2018-June 2019), please <a href="https://im4change.org/docs/annual-report-on-periodic-labour-force-survey-july-2018-june-2019.pdf ">click here</a> to access &nbsp;</em></p>
<p style="text-align:justify"><em>First Periodic Labour Force Survey Annual Report (July 2017-June 2018), please <a href="https://im4change.org/docs/216Annual_Report_PLFS_2017_18_31052019.pdf ">click here</a> to access &nbsp;</em></p>
<p style="text-align:justify"><strong>---</strong></p>
<p style="text-align:justify">The proportion of usual status female workers as self-employed <em>(sum of own-account workers and employers in household enterprises) </em>climbed up over various rounds of annual PLFS, from 4.5 percent in PLFS 2017-18 to 7.9 percent in PLFS 2020-21. In urban areas too, for the same category of self-employed, this proportion went up between PLFS 2017-18 and PLFS 2020-21. Kindly take a look at table-2.</p>
<p style="text-align:justify"><strong>Table 2: Percentage of usual status workers in different categories of 15 years plus population: Female</strong></p>
<p style="text-align:justify"><img alt="" src="/upload/images/Table%202%20Percentage%20of%20usual%20status%20workers%20in%20different%20categories%20of%2015%20plus%20population%20Female.png" style="height:295px; width:861px" /></p>
<p style="text-align:justify"><em><strong>Source: </strong>Same as table-1</em><br />
<strong>---</strong></p>
<p style="text-align:justify">As can be seen from table-1 of this analysis, although the proportion of usual status male workers as household enterprise helpers in rural areas came down slightly between PLFS 2017-18 and PLFS 2018-19, it gradually went up to 7.7&nbsp;percent in PLFS 2019-20, and further to 8.2&nbsp;percent in PLFS 2020-21.&nbsp;</p>
<p style="text-align:justify">In urban areas, after remaining unchanged for two successive rounds of annual PLFS, the proportion of usual status male workers as household enterprise helpers increased marginally to 3.1&nbsp;percent in PLFS 2020-21.&nbsp;</p>
<p style="text-align:justify"><span style="background-color:#ffcc00">In contrast to male workers, the proportion of usual status female workers as household enterprise helpers in rural areas increased over various rounds of annual PLFS, from 9.1 percent in PLFS 2017-18 to 15.3 percent in PLFS 2020-21. Between PLFS 2018-19 and PLFS 2019-20, there was a noticeable jump in the proportion of usual status female workers as household enterprise helpers in such areas. In rural areas, compared to its male counterpart, a higher proportion of usual status female workers worked as household enterprise helpers during each of the annual PLFS rounds, from PLFS 2017-18 to PLFS 2020-21.&nbsp;The gap between the proportion of usual status female workers as household enterprise helpers and that of its male counterpart in rural areas expanded from 2.1 percentage points (p.p.) to 7.1 p.p. between PLFS 2017-18 and PLFS 2020-21. Kindly compare table-1 against table-2.&nbsp;</span></p>
<p style="text-align:justify">In urban areas, the proportion of usual status female workers as household enterprise helpers increased over various rounds of annual PLFS, from 1.8 percent in PLFS 2018-19 to 2.6 percent in PLFS 2020-21.&nbsp;</p>
<p style="text-align:justify">In rural areas, the proportion of usual status male workers as regular/salaried workers remained almost the same between PLFS 2017-18 and PLFS 2020-21. However, the proportion of usual status male workers as regular/salaried workers decreased from 33.0 percent to 31.7 percent between PLFS 2019-20 and PLFS 2020-21 in urban areas. Please see table-1.</p>
<p style="text-align:justify">In rural areas, the proportion of usual status female workers as regular/salaried workers increased over various annual PLFS rounds, from 2.5 percent in PLFS 2017-18 to 3.3 percent in PLFS 2020-21. In urban areas, at first the proportion of usual status female workers as regular/salaried workers grew from 9.5 percent in PLFS 2017-18 to 11.5 percent in PLFS 2019-20, but then it dropped to 10.6 percent in PLFS 2020-21.</p>
<p style="text-align:justify">In rural areas, the proportion of usual status male workers who worked as casual labour in other types of works <em>(i.e., excluding public works as well as MGNREGA) </em>remained at around 20 percent in various annual PLFS rounds. For the same category of workers in urban areas, this proportion marginally rose from 9.6 percent in PLFS 2018-19 to 9.8 percent in PLFS 2019-20, and further to 10.3 percent in 2020-21. Kindly consult table-1.</p>
<p style="text-align:justify">In rural areas, the proportion of usual status female workers who worked as casual labour in other types of works <em>(i.e., excluding public works as well as MGNREGA) </em>increased from 6.6 percent to 8.3 percent between PLFS 2018-19 and PLFS 2020-21. For the same category of workers in urban areas, this proportion remained the same in PLFS 2019-20 and PLFS 2020-21.&nbsp;Kindly look at table-2.</p>
<p style="text-align:justify">Please note&nbsp;that the&nbsp;<a href="https://im4change.org/upload/files/Annual%20Report%20PLFS%202020-21.pdf" title="https://im4change.org/upload/files/Annual%20Report%20PLFS%202020-21.pdf">Annual Report on PLFS 2020-2021</a>&nbsp;has also covered the period&nbsp;<em>(i.e., April-June, 2021)&nbsp;</em>when the state-wide lockdowns&nbsp;associated with the second wave of COVID-19&nbsp;were imposed. The&nbsp;<a href="https://im4change.org/upload/files/Annual_Report_PLFS_2019_20.pdf" title="https://im4change.org/upload/files/Annual_Report_PLFS_2019_20.pdf">Annual Report on PLFS 2019-20</a>&nbsp;too had covered the period&nbsp;<em>(i.e., April-June, 2020)</em>&nbsp;when the countrywide lockdown&nbsp;<em>(associated with the first year of the COVID-19 pandemic)&nbsp;</em>was imposed.&nbsp;</p>
<p style="text-align:justify"><em><strong>References</strong></em></p>
<p style="text-align:justify">Fourth Periodic Labour Force Survey Annual Report (July 2020-June 2021), released in June 2022, National Statistical Office (NSO), Ministry of Statistics and Programme Implementation (MoSPI), <a href="https://im4change.org/upload/files/Annual%20Report%20PLFS%202020-21.pdf">click here</a> to access &nbsp;</p>
<p style="text-align:justify">Third Periodic Labour Force Survey Annual Report (July 2019-June 2020), released in July 2021, National Statistical Office (NSO), Ministry of Statistics and Programme Implementation (MoSPI), please <a href="https://im4change.org/upload/files/Annual_Report_PLFS_2019_20.pdf ">click here</a> to access &nbsp;</p>
<p style="text-align:justify">Second Periodic Labour Force Survey Annual Report (July 2018-June 2019), released in June 2020, National Statistical Office (NSO), Ministry of Statistics and Programme Implementation (MoSPI), please <a href="https://im4change.org/docs/annual-report-on-periodic-labour-force-survey-july-2018-june-2019.pdf ">click here</a> to access &nbsp;</p>
<p style="text-align:justify">First Periodic Labour Force Survey Annual Report (July 2017-June 2018), released in May 2019, National Statistical Office (NSO), Ministry of Statistics and Programme Implementation (MoSPI), please <a href="https://im4change.org/docs/216Annual_Report_PLFS_2017_18_31052019.pdf ">click here</a> to access &nbsp;&nbsp;</p>
<p style="text-align:justify">News alert: Quality of work matters, and not just job creation, Inclusive Media for Change, Published on: Sep 26, 2022, please <a href="https://im4change.org/news-alerts-57/plfs-unemployment-rate-labour-force-participation-rate-worker-population-ratio-decent-work-social-security-quality-of-work-gainful-employment.html">click here</a> to access</p>
<p style="text-align:justify">What&rsquo;s behind the &lsquo;improvement&rsquo; in employment situation in labour force survey report -PC Mohanan, ThePrint, 21 August, 2021, please <a href="https://theprint.in/opinion/what-is-behind-the-improvement-in-employment-situation/719674/ ">click here</a> to access&nbsp;</p>
<p style="text-align:justify"><br />
<strong>Image Courtesy: Inclusive Media for Change/ Himanshu Joshi</strong></p>
',
'credit_writer' => '',
'article_img' => 'Image Employment dated 7 Oct 2022.jpg',
'article_img_thumb' => 'Image Employment dated 7 Oct 2022.jpg',
'status' => (int) 1,
'show_on_home' => (int) 1,
'lang' => 'EN',
'category_id' => (int) 4,
'tag_keyword' => '',
'seo_url' => 'how-well-did-the-women-worker-fare-during-the-pandemic-years-plfs-reports-provide-some-mixed-answers-casual-workers-self-employed-unpaid-helpers-family-enterprises-regular-wage-salaried',
'meta_title' => '',
'meta_keywords' => '',
'meta_description' => '',
'noindex' => (int) 1,
'publish_date' => object(Cake\I18n\FrozenDate) {},
'most_visit_section_id' => null,
'article_big_img' => null,
'liveid' => null,
'created' => object(Cake\I18n\FrozenTime) {},
'modified' => object(Cake\I18n\FrozenTime) {},
'edate' => '',
'tags' => [
[maximum depth reached]
],
'category' => object(App\Model\Entity\Category) {},
'[new]' => false,
'[accessible]' => [
[maximum depth reached]
],
'[dirty]' => [[maximum depth reached]],
'[original]' => [[maximum depth reached]],
'[virtual]' => [[maximum depth reached]],
'[hasErrors]' => false,
'[errors]' => [[maximum depth reached]],
'[invalid]' => [[maximum depth reached]],
'[repository]' => 'Articles'
},
'articleid' => (int) 63956,
'metaTitle' => 'NEWS ALERTS | How well did the women workers fare during the pandemic years? The yearly PLFS reports provide some mixed answers.',
'metaKeywords' => 'Casual Workers,Female workers,Household Enterprises,Male workers,Periodic Labour Force Survey,PLFS,regular wage/salaried employee,Self Employed,Self-employed,Unpaid Helpers,Women workers',
'metaDesc' => 'Do you want a job that does not pay you at all? The answer will be surely &#39;no&#39; for most of us. And yet, in our previous analysis, it was found that the proportion of &#39;helpers in household enterprises&#39; among...',
'disp' => '<p style="text-align:justify">Do you want a job that does not pay you at all? The answer will be surely &#39;no&#39; for most of us. And yet, in our <a href="https://im4change.org/news-alerts-57/plfs-unemployment-rate-labour-force-participation-rate-worker-population-ratio-decent-work-social-security-quality-of-work-gainful-employment.html" title="https://im4change.org/news-alerts-57/plfs-unemployment-rate-labour-force-participation-rate-worker-population-ratio-decent-work-social-security-quality-of-work-gainful-employment.html">previous analysis</a>, it was found that the proportion of &#39;helpers in household enterprises&#39; among the total number of workers grew over various rounds of annual PLFS <em>(Periodic Labour Force Survey)</em>, from 13.3 percent to 15.9 percent between PLFS 2018-19 and PLFS 2019-20, and then soared further to 17.3 percent in PLFS 2020-21.&nbsp;</p><p style="text-align:justify">The most elemental question that comes to one&rsquo;s mind is which gender took up such unpaid, low-quality jobs during the pandemic years and whether there was a rural-urban divide noticed in that trend.&nbsp;</p><p style="text-align:justify">Without further ado, it needs to be mentioned here that from table-15 of each of the annual PLFS reports <em>(please click <a href="https://im4change.org/upload/files/Annual%20Report%20PLFS%202020-21.pdf" title="https://im4change.org/upload/files/Annual%20Report%20PLFS%202020-21.pdf">here</a>, <a href="https://im4change.org/upload/files/Annual_Report_PLFS_2019_20.pdf" title="https://im4change.org/upload/files/Annual_Report_PLFS_2019_20.pdf">here</a>, <a href="https://im4change.org/docs/annual-report-on-periodic-labour-force-survey-july-2018-june-2019.pdf" title="https://im4change.org/docs/annual-report-on-periodic-labour-force-survey-july-2018-june-2019.pdf">here</a> and <a href="https://im4change.org/docs/216Annual_Report_PLFS_2017_18_31052019.pdf" title="https://im4change.org/docs/216Annual_Report_PLFS_2017_18_31052019.pdf">here</a> to access)</em>, the proportion of male and female workers for various categories of work is extracted, and the data is presented as table-1 and table-2 in this analysis.</p><p style="text-align:justify">The categories of workers, which have been considered in the present news alert, are as follows:&nbsp;</p><p style="text-align:justify"><strong>Self-employed&nbsp;</strong></p><p style="text-align:justify">- Code 11: worked in household enterprises <em>(self-employed) </em>as own-account worker&nbsp;<br />- Code 12: worked in household enterprises <em>(self-employed) </em>as an employer<br />- Code 21: worked in household enterprises <em>(self-employed) </em>as helper&nbsp;</p><p style="text-align:justify"><strong>Regular/salaried&nbsp;</strong></p><p style="text-align:justify">- Code 31: worked as regular wage/salaried employee&nbsp;</p><p style="text-align:justify"><strong>Casual Workers&nbsp;</strong></p><p style="text-align:justify">- Code 41: worked as casual labour in public works other than MGNREG public works<br />- Code 51: worked as casual labour in other types of works</p><p style="text-align:justify"><strong>Not working but seeking/available for work <em>(or unemployed)</em></strong></p><p style="text-align:justify">- Code 81: sought work or did not seek but was available for work <em>(for usual status approach)</em>&nbsp;</p><p style="text-align:justify"><strong>Neither working nor available for work <em>(or not in labour force)</em>&nbsp;</strong></p><p style="text-align:justify">- Code 97: others <em>(including beggars, prostitutes, etc.)</em></p><p style="text-align:justify"><strong>---</strong></p><p style="text-align:justify">In rural areas, the proportion of usual status male workers as self-employed <em>(sum of own-account workers and employers in household enterprises) </em>increased over various rounds of annual PLFS, from 34.7&nbsp;percent in PLFS 2017-18 to 36.6 percent in PLFS 2020-21. In urban areas too, for the same category of self-employed, this proportion went up between PLFS 2018-19 and PLFS 2020-21. Please see table-1.</p><p style="text-align:justify"><strong>Table 1: Percentage of usual status workers in different categories of 15 years plus population: Male</strong></p><p style="text-align:justify"><img alt="" src="/upload/images/Table%201%20Percentage%20of%20usual%20status%20workers%20in%20different%20categories%20of%2015%20plus%20population%20Male.png" style="height:295px; width:860px" /></p><p style="text-align:justify"><em><strong>Source: </strong>Fourth Periodic Labour Force Survey Annual Report (July 2020-June 2021), please <a href="https://im4change.org/upload/files/Annual%20Report%20PLFS%202020-21.pdf" title="https://im4change.org/upload/files/Annual%20Report%20PLFS%202020-21.pdf">click here</a> to access &nbsp;</em></p><p style="text-align:justify"><em>Third Periodic Labour Force Survey Annual Report (July 2019-June 2020), please <a href="https://im4change.org/upload/files/Annual_Report_PLFS_2019_20.pdf" title="https://im4change.org/upload/files/Annual_Report_PLFS_2019_20.pdf">click here</a> to access &nbsp;</em></p><p style="text-align:justify"><em>Second Periodic Labour Force Survey Annual Report (July 2018-June 2019), please <a href="https://im4change.org/docs/annual-report-on-periodic-labour-force-survey-july-2018-june-2019.pdf" title="https://im4change.org/docs/annual-report-on-periodic-labour-force-survey-july-2018-june-2019.pdf">click here</a> to access &nbsp;</em></p><p style="text-align:justify"><em>First Periodic Labour Force Survey Annual Report (July 2017-June 2018), please <a href="https://im4change.org/docs/216Annual_Report_PLFS_2017_18_31052019.pdf" title="https://im4change.org/docs/216Annual_Report_PLFS_2017_18_31052019.pdf">click here</a> to access &nbsp;</em></p><p style="text-align:justify"><strong>---</strong></p><p style="text-align:justify">The proportion of usual status female workers as self-employed <em>(sum of own-account workers and employers in household enterprises) </em>climbed up over various rounds of annual PLFS, from 4.5 percent in PLFS 2017-18 to 7.9 percent in PLFS 2020-21. In urban areas too, for the same category of self-employed, this proportion went up between PLFS 2017-18 and PLFS 2020-21. Kindly take a look at table-2.</p><p style="text-align:justify"><strong>Table 2: Percentage of usual status workers in different categories of 15 years plus population: Female</strong></p><p style="text-align:justify"><img alt="" src="/upload/images/Table%202%20Percentage%20of%20usual%20status%20workers%20in%20different%20categories%20of%2015%20plus%20population%20Female.png" style="height:295px; width:861px" /></p><p style="text-align:justify"><em><strong>Source: </strong>Same as table-1</em><br /><strong>---</strong></p><p style="text-align:justify">As can be seen from table-1 of this analysis, although the proportion of usual status male workers as household enterprise helpers in rural areas came down slightly between PLFS 2017-18 and PLFS 2018-19, it gradually went up to 7.7&nbsp;percent in PLFS 2019-20, and further to 8.2&nbsp;percent in PLFS 2020-21.&nbsp;</p><p style="text-align:justify">In urban areas, after remaining unchanged for two successive rounds of annual PLFS, the proportion of usual status male workers as household enterprise helpers increased marginally to 3.1&nbsp;percent in PLFS 2020-21.&nbsp;</p><p style="text-align:justify"><span style="background-color:#ffcc00">In contrast to male workers, the proportion of usual status female workers as household enterprise helpers in rural areas increased over various rounds of annual PLFS, from 9.1 percent in PLFS 2017-18 to 15.3 percent in PLFS 2020-21. Between PLFS 2018-19 and PLFS 2019-20, there was a noticeable jump in the proportion of usual status female workers as household enterprise helpers in such areas. In rural areas, compared to its male counterpart, a higher proportion of usual status female workers worked as household enterprise helpers during each of the annual PLFS rounds, from PLFS 2017-18 to PLFS 2020-21.&nbsp;The gap between the proportion of usual status female workers as household enterprise helpers and that of its male counterpart in rural areas expanded from 2.1 percentage points (p.p.) to 7.1 p.p. between PLFS 2017-18 and PLFS 2020-21. Kindly compare table-1 against table-2.&nbsp;</span></p><p style="text-align:justify">In urban areas, the proportion of usual status female workers as household enterprise helpers increased over various rounds of annual PLFS, from 1.8 percent in PLFS 2018-19 to 2.6 percent in PLFS 2020-21.&nbsp;</p><p style="text-align:justify">In rural areas, the proportion of usual status male workers as regular/salaried workers remained almost the same between PLFS 2017-18 and PLFS 2020-21. However, the proportion of usual status male workers as regular/salaried workers decreased from 33.0 percent to 31.7 percent between PLFS 2019-20 and PLFS 2020-21 in urban areas. Please see table-1.</p><p style="text-align:justify">In rural areas, the proportion of usual status female workers as regular/salaried workers increased over various annual PLFS rounds, from 2.5 percent in PLFS 2017-18 to 3.3 percent in PLFS 2020-21. In urban areas, at first the proportion of usual status female workers as regular/salaried workers grew from 9.5 percent in PLFS 2017-18 to 11.5 percent in PLFS 2019-20, but then it dropped to 10.6 percent in PLFS 2020-21.</p><p style="text-align:justify">In rural areas, the proportion of usual status male workers who worked as casual labour in other types of works <em>(i.e., excluding public works as well as MGNREGA) </em>remained at around 20 percent in various annual PLFS rounds. For the same category of workers in urban areas, this proportion marginally rose from 9.6 percent in PLFS 2018-19 to 9.8 percent in PLFS 2019-20, and further to 10.3 percent in 2020-21. Kindly consult table-1.</p><p style="text-align:justify">In rural areas, the proportion of usual status female workers who worked as casual labour in other types of works <em>(i.e., excluding public works as well as MGNREGA) </em>increased from 6.6 percent to 8.3 percent between PLFS 2018-19 and PLFS 2020-21. For the same category of workers in urban areas, this proportion remained the same in PLFS 2019-20 and PLFS 2020-21.&nbsp;Kindly look at table-2.</p><p style="text-align:justify">Please note&nbsp;that the&nbsp;<a href="https://im4change.org/upload/files/Annual%20Report%20PLFS%202020-21.pdf" title="https://im4change.org/upload/files/Annual%20Report%20PLFS%202020-21.pdf" title="https://im4change.org/upload/files/Annual%20Report%20PLFS%202020-21.pdf" title="https://im4change.org/upload/files/Annual%20Report%20PLFS%202020-21.pdf">Annual Report on PLFS 2020-2021</a>&nbsp;has also covered the period&nbsp;<em>(i.e., April-June, 2021)&nbsp;</em>when the state-wide lockdowns&nbsp;associated with the second wave of COVID-19&nbsp;were imposed. The&nbsp;<a href="https://im4change.org/upload/files/Annual_Report_PLFS_2019_20.pdf" title="https://im4change.org/upload/files/Annual_Report_PLFS_2019_20.pdf" title="https://im4change.org/upload/files/Annual_Report_PLFS_2019_20.pdf" title="https://im4change.org/upload/files/Annual_Report_PLFS_2019_20.pdf">Annual Report on PLFS 2019-20</a>&nbsp;too had covered the period&nbsp;<em>(i.e., April-June, 2020)</em>&nbsp;when the countrywide lockdown&nbsp;<em>(associated with the first year of the COVID-19 pandemic)&nbsp;</em>was imposed.&nbsp;</p><p style="text-align:justify"><em><strong>References</strong></em></p><p style="text-align:justify">Fourth Periodic Labour Force Survey Annual Report (July 2020-June 2021), released in June 2022, National Statistical Office (NSO), Ministry of Statistics and Programme Implementation (MoSPI), <a href="https://im4change.org/upload/files/Annual%20Report%20PLFS%202020-21.pdf" title="https://im4change.org/upload/files/Annual%20Report%20PLFS%202020-21.pdf">click here</a> to access &nbsp;</p><p style="text-align:justify">Third Periodic Labour Force Survey Annual Report (July 2019-June 2020), released in July 2021, National Statistical Office (NSO), Ministry of Statistics and Programme Implementation (MoSPI), please <a href="https://im4change.org/upload/files/Annual_Report_PLFS_2019_20.pdf" title="https://im4change.org/upload/files/Annual_Report_PLFS_2019_20.pdf">click here</a> to access &nbsp;</p><p style="text-align:justify">Second Periodic Labour Force Survey Annual Report (July 2018-June 2019), released in June 2020, National Statistical Office (NSO), Ministry of Statistics and Programme Implementation (MoSPI), please <a href="https://im4change.org/docs/annual-report-on-periodic-labour-force-survey-july-2018-june-2019.pdf" title="https://im4change.org/docs/annual-report-on-periodic-labour-force-survey-july-2018-june-2019.pdf">click here</a> to access &nbsp;</p><p style="text-align:justify">First Periodic Labour Force Survey Annual Report (July 2017-June 2018), released in May 2019, National Statistical Office (NSO), Ministry of Statistics and Programme Implementation (MoSPI), please <a href="https://im4change.org/docs/216Annual_Report_PLFS_2017_18_31052019.pdf" title="https://im4change.org/docs/216Annual_Report_PLFS_2017_18_31052019.pdf">click here</a> to access &nbsp;&nbsp;</p><p style="text-align:justify">News alert: Quality of work matters, and not just job creation, Inclusive Media for Change, Published on: Sep 26, 2022, please <a href="https://im4change.org/news-alerts-57/plfs-unemployment-rate-labour-force-participation-rate-worker-population-ratio-decent-work-social-security-quality-of-work-gainful-employment.html" title="https://im4change.org/news-alerts-57/plfs-unemployment-rate-labour-force-participation-rate-worker-population-ratio-decent-work-social-security-quality-of-work-gainful-employment.html">click here</a> to access</p><p style="text-align:justify">What&rsquo;s behind the &lsquo;improvement&rsquo; in employment situation in labour force survey report -PC Mohanan, ThePrint, 21 August, 2021, please <a href="https://theprint.in/opinion/what-is-behind-the-improvement-in-employment-situation/719674/" title="https://theprint.in/opinion/what-is-behind-the-improvement-in-employment-situation/719674/">click here</a> to access&nbsp;</p><p style="text-align:justify"><br /><strong>Image Courtesy: Inclusive Media for Change/ Himanshu Joshi</strong></p>',
'lang' => 'English',
'SITE_URL' => 'https://im4change.in/',
'site_title' => 'im4change',
'adminprix' => 'admin'
]
$article_current = object(App\Model\Entity\Article) {
'id' => (int) 63956,
'title' => 'How well did the women workers fare during the pandemic years? The yearly PLFS reports provide some mixed answers.',
'subheading' => null,
'description' => '<p style="text-align:justify">Do you want a job that does not pay you at all? The answer will be surely &#39;no&#39; for most of us. And yet, in our <a href="https://im4change.org/news-alerts-57/plfs-unemployment-rate-labour-force-participation-rate-worker-population-ratio-decent-work-social-security-quality-of-work-gainful-employment.html">previous analysis</a>, it was found that the proportion of &#39;helpers in household enterprises&#39; among the total number of workers grew over various rounds of annual PLFS <em>(Periodic Labour Force Survey)</em>, from 13.3 percent to 15.9 percent between PLFS 2018-19 and PLFS 2019-20, and then soared further to 17.3 percent in PLFS 2020-21.&nbsp;</p>
<p style="text-align:justify">The most elemental question that comes to one&rsquo;s mind is which gender took up such unpaid, low-quality jobs during the pandemic years and whether there was a rural-urban divide noticed in that trend.&nbsp;</p>
<p style="text-align:justify">Without further ado, it needs to be mentioned here that from table-15 of each of the annual PLFS reports <em>(please click <a href="https://im4change.org/upload/files/Annual%20Report%20PLFS%202020-21.pdf">here</a>, <a href="https://im4change.org/upload/files/Annual_Report_PLFS_2019_20.pdf">here</a>, <a href="https://im4change.org/docs/annual-report-on-periodic-labour-force-survey-july-2018-june-2019.pdf">here</a> and <a href="https://im4change.org/docs/216Annual_Report_PLFS_2017_18_31052019.pdf">here</a> to access)</em>, the proportion of male and female workers for various categories of work is extracted, and the data is presented as table-1 and table-2 in this analysis.</p>
<p style="text-align:justify">The categories of workers, which have been considered in the present news alert, are as follows:&nbsp;</p>
<p style="text-align:justify"><strong>Self-employed&nbsp;</strong></p>
<p style="text-align:justify">- Code 11: worked in household enterprises <em>(self-employed) </em>as own-account worker&nbsp;<br />
- Code 12: worked in household enterprises <em>(self-employed) </em>as an employer<br />
- Code 21: worked in household enterprises <em>(self-employed) </em>as helper&nbsp;</p>
<p style="text-align:justify"><strong>Regular/salaried&nbsp;</strong></p>
<p style="text-align:justify">- Code 31: worked as regular wage/salaried employee&nbsp;</p>
<p style="text-align:justify"><strong>Casual Workers&nbsp;</strong></p>
<p style="text-align:justify">- Code 41: worked as casual labour in public works other than MGNREG public works<br />
- Code 51: worked as casual labour in other types of works</p>
<p style="text-align:justify"><strong>Not working but seeking/available for work <em>(or unemployed)</em></strong></p>
<p style="text-align:justify">- Code 81: sought work or did not seek but was available for work <em>(for usual status approach)</em>&nbsp;</p>
<p style="text-align:justify"><strong>Neither working nor available for work <em>(or not in labour force)</em>&nbsp;</strong></p>
<p style="text-align:justify">- Code 97: others <em>(including beggars, prostitutes, etc.)</em></p>
<p style="text-align:justify"><strong>---</strong></p>
<p style="text-align:justify">In rural areas, the proportion of usual status male workers as self-employed <em>(sum of own-account workers and employers in household enterprises) </em>increased over various rounds of annual PLFS, from 34.7&nbsp;percent in PLFS 2017-18 to 36.6 percent in PLFS 2020-21. In urban areas too, for the same category of self-employed, this proportion went up between PLFS 2018-19 and PLFS 2020-21. Please see table-1.</p>
<p style="text-align:justify"><strong>Table 1: Percentage of usual status workers in different categories of 15 years plus population: Male</strong></p>
<p style="text-align:justify"><img alt="" src="/upload/images/Table%201%20Percentage%20of%20usual%20status%20workers%20in%20different%20categories%20of%2015%20plus%20population%20Male.png" style="height:295px; width:860px" /></p>
<p style="text-align:justify"><em><strong>Source: </strong>Fourth Periodic Labour Force Survey Annual Report (July 2020-June 2021), please <a href="https://im4change.org/upload/files/Annual%20Report%20PLFS%202020-21.pdf">click here</a> to access &nbsp;</em></p>
<p style="text-align:justify"><em>Third Periodic Labour Force Survey Annual Report (July 2019-June 2020), please <a href="https://im4change.org/upload/files/Annual_Report_PLFS_2019_20.pdf ">click here</a> to access &nbsp;</em></p>
<p style="text-align:justify"><em>Second Periodic Labour Force Survey Annual Report (July 2018-June 2019), please <a href="https://im4change.org/docs/annual-report-on-periodic-labour-force-survey-july-2018-june-2019.pdf ">click here</a> to access &nbsp;</em></p>
<p style="text-align:justify"><em>First Periodic Labour Force Survey Annual Report (July 2017-June 2018), please <a href="https://im4change.org/docs/216Annual_Report_PLFS_2017_18_31052019.pdf ">click here</a> to access &nbsp;</em></p>
<p style="text-align:justify"><strong>---</strong></p>
<p style="text-align:justify">The proportion of usual status female workers as self-employed <em>(sum of own-account workers and employers in household enterprises) </em>climbed up over various rounds of annual PLFS, from 4.5 percent in PLFS 2017-18 to 7.9 percent in PLFS 2020-21. In urban areas too, for the same category of self-employed, this proportion went up between PLFS 2017-18 and PLFS 2020-21. Kindly take a look at table-2.</p>
<p style="text-align:justify"><strong>Table 2: Percentage of usual status workers in different categories of 15 years plus population: Female</strong></p>
<p style="text-align:justify"><img alt="" src="/upload/images/Table%202%20Percentage%20of%20usual%20status%20workers%20in%20different%20categories%20of%2015%20plus%20population%20Female.png" style="height:295px; width:861px" /></p>
<p style="text-align:justify"><em><strong>Source: </strong>Same as table-1</em><br />
<strong>---</strong></p>
<p style="text-align:justify">As can be seen from table-1 of this analysis, although the proportion of usual status male workers as household enterprise helpers in rural areas came down slightly between PLFS 2017-18 and PLFS 2018-19, it gradually went up to 7.7&nbsp;percent in PLFS 2019-20, and further to 8.2&nbsp;percent in PLFS 2020-21.&nbsp;</p>
<p style="text-align:justify">In urban areas, after remaining unchanged for two successive rounds of annual PLFS, the proportion of usual status male workers as household enterprise helpers increased marginally to 3.1&nbsp;percent in PLFS 2020-21.&nbsp;</p>
<p style="text-align:justify"><span style="background-color:#ffcc00">In contrast to male workers, the proportion of usual status female workers as household enterprise helpers in rural areas increased over various rounds of annual PLFS, from 9.1 percent in PLFS 2017-18 to 15.3 percent in PLFS 2020-21. Between PLFS 2018-19 and PLFS 2019-20, there was a noticeable jump in the proportion of usual status female workers as household enterprise helpers in such areas. In rural areas, compared to its male counterpart, a higher proportion of usual status female workers worked as household enterprise helpers during each of the annual PLFS rounds, from PLFS 2017-18 to PLFS 2020-21.&nbsp;The gap between the proportion of usual status female workers as household enterprise helpers and that of its male counterpart in rural areas expanded from 2.1 percentage points (p.p.) to 7.1 p.p. between PLFS 2017-18 and PLFS 2020-21. Kindly compare table-1 against table-2.&nbsp;</span></p>
<p style="text-align:justify">In urban areas, the proportion of usual status female workers as household enterprise helpers increased over various rounds of annual PLFS, from 1.8 percent in PLFS 2018-19 to 2.6 percent in PLFS 2020-21.&nbsp;</p>
<p style="text-align:justify">In rural areas, the proportion of usual status male workers as regular/salaried workers remained almost the same between PLFS 2017-18 and PLFS 2020-21. However, the proportion of usual status male workers as regular/salaried workers decreased from 33.0 percent to 31.7 percent between PLFS 2019-20 and PLFS 2020-21 in urban areas. Please see table-1.</p>
<p style="text-align:justify">In rural areas, the proportion of usual status female workers as regular/salaried workers increased over various annual PLFS rounds, from 2.5 percent in PLFS 2017-18 to 3.3 percent in PLFS 2020-21. In urban areas, at first the proportion of usual status female workers as regular/salaried workers grew from 9.5 percent in PLFS 2017-18 to 11.5 percent in PLFS 2019-20, but then it dropped to 10.6 percent in PLFS 2020-21.</p>
<p style="text-align:justify">In rural areas, the proportion of usual status male workers who worked as casual labour in other types of works <em>(i.e., excluding public works as well as MGNREGA) </em>remained at around 20 percent in various annual PLFS rounds. For the same category of workers in urban areas, this proportion marginally rose from 9.6 percent in PLFS 2018-19 to 9.8 percent in PLFS 2019-20, and further to 10.3 percent in 2020-21. Kindly consult table-1.</p>
<p style="text-align:justify">In rural areas, the proportion of usual status female workers who worked as casual labour in other types of works <em>(i.e., excluding public works as well as MGNREGA) </em>increased from 6.6 percent to 8.3 percent between PLFS 2018-19 and PLFS 2020-21. For the same category of workers in urban areas, this proportion remained the same in PLFS 2019-20 and PLFS 2020-21.&nbsp;Kindly look at table-2.</p>
<p style="text-align:justify">Please note&nbsp;that the&nbsp;<a href="https://im4change.org/upload/files/Annual%20Report%20PLFS%202020-21.pdf" title="https://im4change.org/upload/files/Annual%20Report%20PLFS%202020-21.pdf">Annual Report on PLFS 2020-2021</a>&nbsp;has also covered the period&nbsp;<em>(i.e., April-June, 2021)&nbsp;</em>when the state-wide lockdowns&nbsp;associated with the second wave of COVID-19&nbsp;were imposed. The&nbsp;<a href="https://im4change.org/upload/files/Annual_Report_PLFS_2019_20.pdf" title="https://im4change.org/upload/files/Annual_Report_PLFS_2019_20.pdf">Annual Report on PLFS 2019-20</a>&nbsp;too had covered the period&nbsp;<em>(i.e., April-June, 2020)</em>&nbsp;when the countrywide lockdown&nbsp;<em>(associated with the first year of the COVID-19 pandemic)&nbsp;</em>was imposed.&nbsp;</p>
<p style="text-align:justify"><em><strong>References</strong></em></p>
<p style="text-align:justify">Fourth Periodic Labour Force Survey Annual Report (July 2020-June 2021), released in June 2022, National Statistical Office (NSO), Ministry of Statistics and Programme Implementation (MoSPI), <a href="https://im4change.org/upload/files/Annual%20Report%20PLFS%202020-21.pdf">click here</a> to access &nbsp;</p>
<p style="text-align:justify">Third Periodic Labour Force Survey Annual Report (July 2019-June 2020), released in July 2021, National Statistical Office (NSO), Ministry of Statistics and Programme Implementation (MoSPI), please <a href="https://im4change.org/upload/files/Annual_Report_PLFS_2019_20.pdf ">click here</a> to access &nbsp;</p>
<p style="text-align:justify">Second Periodic Labour Force Survey Annual Report (July 2018-June 2019), released in June 2020, National Statistical Office (NSO), Ministry of Statistics and Programme Implementation (MoSPI), please <a href="https://im4change.org/docs/annual-report-on-periodic-labour-force-survey-july-2018-june-2019.pdf ">click here</a> to access &nbsp;</p>
<p style="text-align:justify">First Periodic Labour Force Survey Annual Report (July 2017-June 2018), released in May 2019, National Statistical Office (NSO), Ministry of Statistics and Programme Implementation (MoSPI), please <a href="https://im4change.org/docs/216Annual_Report_PLFS_2017_18_31052019.pdf ">click here</a> to access &nbsp;&nbsp;</p>
<p style="text-align:justify">News alert: Quality of work matters, and not just job creation, Inclusive Media for Change, Published on: Sep 26, 2022, please <a href="https://im4change.org/news-alerts-57/plfs-unemployment-rate-labour-force-participation-rate-worker-population-ratio-decent-work-social-security-quality-of-work-gainful-employment.html">click here</a> to access</p>
<p style="text-align:justify">What&rsquo;s behind the &lsquo;improvement&rsquo; in employment situation in labour force survey report -PC Mohanan, ThePrint, 21 August, 2021, please <a href="https://theprint.in/opinion/what-is-behind-the-improvement-in-employment-situation/719674/ ">click here</a> to access&nbsp;</p>
<p style="text-align:justify"><br />
<strong>Image Courtesy: Inclusive Media for Change/ Himanshu Joshi</strong></p>
',
'credit_writer' => '',
'article_img' => 'Image Employment dated 7 Oct 2022.jpg',
'article_img_thumb' => 'Image Employment dated 7 Oct 2022.jpg',
'status' => (int) 1,
'show_on_home' => (int) 1,
'lang' => 'EN',
'category_id' => (int) 4,
'tag_keyword' => '',
'seo_url' => 'how-well-did-the-women-worker-fare-during-the-pandemic-years-plfs-reports-provide-some-mixed-answers-casual-workers-self-employed-unpaid-helpers-family-enterprises-regular-wage-salaried',
'meta_title' => '',
'meta_keywords' => '',
'meta_description' => '',
'noindex' => (int) 1,
'publish_date' => object(Cake\I18n\FrozenDate) {},
'most_visit_section_id' => null,
'article_big_img' => null,
'liveid' => null,
'created' => object(Cake\I18n\FrozenTime) {},
'modified' => object(Cake\I18n\FrozenTime) {},
'edate' => '',
'tags' => [
(int) 0 => object(Cake\ORM\Entity) {},
(int) 1 => object(Cake\ORM\Entity) {},
(int) 2 => object(Cake\ORM\Entity) {},
(int) 3 => object(Cake\ORM\Entity) {},
(int) 4 => object(Cake\ORM\Entity) {},
(int) 5 => object(Cake\ORM\Entity) {},
(int) 6 => object(Cake\ORM\Entity) {},
(int) 7 => object(Cake\ORM\Entity) {},
(int) 8 => object(Cake\ORM\Entity) {},
(int) 9 => object(Cake\ORM\Entity) {},
(int) 10 => object(Cake\ORM\Entity) {}
],
'category' => object(App\Model\Entity\Category) {},
'[new]' => false,
'[accessible]' => [
'*' => true,
'id' => false
],
'[dirty]' => [],
'[original]' => [],
'[virtual]' => [],
'[hasErrors]' => false,
'[errors]' => [],
'[invalid]' => [],
'[repository]' => 'Articles'
}
$articleid = (int) 63956
$metaTitle = 'NEWS ALERTS | How well did the women workers fare during the pandemic years? The yearly PLFS reports provide some mixed answers.'
$metaKeywords = 'Casual Workers,Female workers,Household Enterprises,Male workers,Periodic Labour Force Survey,PLFS,regular wage/salaried employee,Self Employed,Self-employed,Unpaid Helpers,Women workers'
$metaDesc = 'Do you want a job that does not pay you at all? The answer will be surely &#39;no&#39; for most of us. And yet, in our previous analysis, it was found that the proportion of &#39;helpers in household enterprises&#39; among...'
$disp = '<p style="text-align:justify">Do you want a job that does not pay you at all? The answer will be surely &#39;no&#39; for most of us. And yet, in our <a href="https://im4change.org/news-alerts-57/plfs-unemployment-rate-labour-force-participation-rate-worker-population-ratio-decent-work-social-security-quality-of-work-gainful-employment.html" title="https://im4change.org/news-alerts-57/plfs-unemployment-rate-labour-force-participation-rate-worker-population-ratio-decent-work-social-security-quality-of-work-gainful-employment.html">previous analysis</a>, it was found that the proportion of &#39;helpers in household enterprises&#39; among the total number of workers grew over various rounds of annual PLFS <em>(Periodic Labour Force Survey)</em>, from 13.3 percent to 15.9 percent between PLFS 2018-19 and PLFS 2019-20, and then soared further to 17.3 percent in PLFS 2020-21.&nbsp;</p><p style="text-align:justify">The most elemental question that comes to one&rsquo;s mind is which gender took up such unpaid, low-quality jobs during the pandemic years and whether there was a rural-urban divide noticed in that trend.&nbsp;</p><p style="text-align:justify">Without further ado, it needs to be mentioned here that from table-15 of each of the annual PLFS reports <em>(please click <a href="https://im4change.org/upload/files/Annual%20Report%20PLFS%202020-21.pdf" title="https://im4change.org/upload/files/Annual%20Report%20PLFS%202020-21.pdf">here</a>, <a href="https://im4change.org/upload/files/Annual_Report_PLFS_2019_20.pdf" title="https://im4change.org/upload/files/Annual_Report_PLFS_2019_20.pdf">here</a>, <a href="https://im4change.org/docs/annual-report-on-periodic-labour-force-survey-july-2018-june-2019.pdf" title="https://im4change.org/docs/annual-report-on-periodic-labour-force-survey-july-2018-june-2019.pdf">here</a> and <a href="https://im4change.org/docs/216Annual_Report_PLFS_2017_18_31052019.pdf" title="https://im4change.org/docs/216Annual_Report_PLFS_2017_18_31052019.pdf">here</a> to access)</em>, the proportion of male and female workers for various categories of work is extracted, and the data is presented as table-1 and table-2 in this analysis.</p><p style="text-align:justify">The categories of workers, which have been considered in the present news alert, are as follows:&nbsp;</p><p style="text-align:justify"><strong>Self-employed&nbsp;</strong></p><p style="text-align:justify">- Code 11: worked in household enterprises <em>(self-employed) </em>as own-account worker&nbsp;<br />- Code 12: worked in household enterprises <em>(self-employed) </em>as an employer<br />- Code 21: worked in household enterprises <em>(self-employed) </em>as helper&nbsp;</p><p style="text-align:justify"><strong>Regular/salaried&nbsp;</strong></p><p style="text-align:justify">- Code 31: worked as regular wage/salaried employee&nbsp;</p><p style="text-align:justify"><strong>Casual Workers&nbsp;</strong></p><p style="text-align:justify">- Code 41: worked as casual labour in public works other than MGNREG public works<br />- Code 51: worked as casual labour in other types of works</p><p style="text-align:justify"><strong>Not working but seeking/available for work <em>(or unemployed)</em></strong></p><p style="text-align:justify">- Code 81: sought work or did not seek but was available for work <em>(for usual status approach)</em>&nbsp;</p><p style="text-align:justify"><strong>Neither working nor available for work <em>(or not in labour force)</em>&nbsp;</strong></p><p style="text-align:justify">- Code 97: others <em>(including beggars, prostitutes, etc.)</em></p><p style="text-align:justify"><strong>---</strong></p><p style="text-align:justify">In rural areas, the proportion of usual status male workers as self-employed <em>(sum of own-account workers and employers in household enterprises) </em>increased over various rounds of annual PLFS, from 34.7&nbsp;percent in PLFS 2017-18 to 36.6 percent in PLFS 2020-21. In urban areas too, for the same category of self-employed, this proportion went up between PLFS 2018-19 and PLFS 2020-21. Please see table-1.</p><p style="text-align:justify"><strong>Table 1: Percentage of usual status workers in different categories of 15 years plus population: Male</strong></p><p style="text-align:justify"><img alt="" src="/upload/images/Table%201%20Percentage%20of%20usual%20status%20workers%20in%20different%20categories%20of%2015%20plus%20population%20Male.png" style="height:295px; width:860px" /></p><p style="text-align:justify"><em><strong>Source: </strong>Fourth Periodic Labour Force Survey Annual Report (July 2020-June 2021), please <a href="https://im4change.org/upload/files/Annual%20Report%20PLFS%202020-21.pdf" title="https://im4change.org/upload/files/Annual%20Report%20PLFS%202020-21.pdf">click here</a> to access &nbsp;</em></p><p style="text-align:justify"><em>Third Periodic Labour Force Survey Annual Report (July 2019-June 2020), please <a href="https://im4change.org/upload/files/Annual_Report_PLFS_2019_20.pdf" title="https://im4change.org/upload/files/Annual_Report_PLFS_2019_20.pdf">click here</a> to access &nbsp;</em></p><p style="text-align:justify"><em>Second Periodic Labour Force Survey Annual Report (July 2018-June 2019), please <a href="https://im4change.org/docs/annual-report-on-periodic-labour-force-survey-july-2018-june-2019.pdf" title="https://im4change.org/docs/annual-report-on-periodic-labour-force-survey-july-2018-june-2019.pdf">click here</a> to access &nbsp;</em></p><p style="text-align:justify"><em>First Periodic Labour Force Survey Annual Report (July 2017-June 2018), please <a href="https://im4change.org/docs/216Annual_Report_PLFS_2017_18_31052019.pdf" title="https://im4change.org/docs/216Annual_Report_PLFS_2017_18_31052019.pdf">click here</a> to access &nbsp;</em></p><p style="text-align:justify"><strong>---</strong></p><p style="text-align:justify">The proportion of usual status female workers as self-employed <em>(sum of own-account workers and employers in household enterprises) </em>climbed up over various rounds of annual PLFS, from 4.5 percent in PLFS 2017-18 to 7.9 percent in PLFS 2020-21. In urban areas too, for the same category of self-employed, this proportion went up between PLFS 2017-18 and PLFS 2020-21. Kindly take a look at table-2.</p><p style="text-align:justify"><strong>Table 2: Percentage of usual status workers in different categories of 15 years plus population: Female</strong></p><p style="text-align:justify"><img alt="" src="/upload/images/Table%202%20Percentage%20of%20usual%20status%20workers%20in%20different%20categories%20of%2015%20plus%20population%20Female.png" style="height:295px; width:861px" /></p><p style="text-align:justify"><em><strong>Source: </strong>Same as table-1</em><br /><strong>---</strong></p><p style="text-align:justify">As can be seen from table-1 of this analysis, although the proportion of usual status male workers as household enterprise helpers in rural areas came down slightly between PLFS 2017-18 and PLFS 2018-19, it gradually went up to 7.7&nbsp;percent in PLFS 2019-20, and further to 8.2&nbsp;percent in PLFS 2020-21.&nbsp;</p><p style="text-align:justify">In urban areas, after remaining unchanged for two successive rounds of annual PLFS, the proportion of usual status male workers as household enterprise helpers increased marginally to 3.1&nbsp;percent in PLFS 2020-21.&nbsp;</p><p style="text-align:justify"><span style="background-color:#ffcc00">In contrast to male workers, the proportion of usual status female workers as household enterprise helpers in rural areas increased over various rounds of annual PLFS, from 9.1 percent in PLFS 2017-18 to 15.3 percent in PLFS 2020-21. Between PLFS 2018-19 and PLFS 2019-20, there was a noticeable jump in the proportion of usual status female workers as household enterprise helpers in such areas. In rural areas, compared to its male counterpart, a higher proportion of usual status female workers worked as household enterprise helpers during each of the annual PLFS rounds, from PLFS 2017-18 to PLFS 2020-21.&nbsp;The gap between the proportion of usual status female workers as household enterprise helpers and that of its male counterpart in rural areas expanded from 2.1 percentage points (p.p.) to 7.1 p.p. between PLFS 2017-18 and PLFS 2020-21. Kindly compare table-1 against table-2.&nbsp;</span></p><p style="text-align:justify">In urban areas, the proportion of usual status female workers as household enterprise helpers increased over various rounds of annual PLFS, from 1.8 percent in PLFS 2018-19 to 2.6 percent in PLFS 2020-21.&nbsp;</p><p style="text-align:justify">In rural areas, the proportion of usual status male workers as regular/salaried workers remained almost the same between PLFS 2017-18 and PLFS 2020-21. However, the proportion of usual status male workers as regular/salaried workers decreased from 33.0 percent to 31.7 percent between PLFS 2019-20 and PLFS 2020-21 in urban areas. Please see table-1.</p><p style="text-align:justify">In rural areas, the proportion of usual status female workers as regular/salaried workers increased over various annual PLFS rounds, from 2.5 percent in PLFS 2017-18 to 3.3 percent in PLFS 2020-21. In urban areas, at first the proportion of usual status female workers as regular/salaried workers grew from 9.5 percent in PLFS 2017-18 to 11.5 percent in PLFS 2019-20, but then it dropped to 10.6 percent in PLFS 2020-21.</p><p style="text-align:justify">In rural areas, the proportion of usual status male workers who worked as casual labour in other types of works <em>(i.e., excluding public works as well as MGNREGA) </em>remained at around 20 percent in various annual PLFS rounds. For the same category of workers in urban areas, this proportion marginally rose from 9.6 percent in PLFS 2018-19 to 9.8 percent in PLFS 2019-20, and further to 10.3 percent in 2020-21. Kindly consult table-1.</p><p style="text-align:justify">In rural areas, the proportion of usual status female workers who worked as casual labour in other types of works <em>(i.e., excluding public works as well as MGNREGA) </em>increased from 6.6 percent to 8.3 percent between PLFS 2018-19 and PLFS 2020-21. For the same category of workers in urban areas, this proportion remained the same in PLFS 2019-20 and PLFS 2020-21.&nbsp;Kindly look at table-2.</p><p style="text-align:justify">Please note&nbsp;that the&nbsp;<a href="https://im4change.org/upload/files/Annual%20Report%20PLFS%202020-21.pdf" title="https://im4change.org/upload/files/Annual%20Report%20PLFS%202020-21.pdf" title="https://im4change.org/upload/files/Annual%20Report%20PLFS%202020-21.pdf" title="https://im4change.org/upload/files/Annual%20Report%20PLFS%202020-21.pdf">Annual Report on PLFS 2020-2021</a>&nbsp;has also covered the period&nbsp;<em>(i.e., April-June, 2021)&nbsp;</em>when the state-wide lockdowns&nbsp;associated with the second wave of COVID-19&nbsp;were imposed. The&nbsp;<a href="https://im4change.org/upload/files/Annual_Report_PLFS_2019_20.pdf" title="https://im4change.org/upload/files/Annual_Report_PLFS_2019_20.pdf" title="https://im4change.org/upload/files/Annual_Report_PLFS_2019_20.pdf" title="https://im4change.org/upload/files/Annual_Report_PLFS_2019_20.pdf">Annual Report on PLFS 2019-20</a>&nbsp;too had covered the period&nbsp;<em>(i.e., April-June, 2020)</em>&nbsp;when the countrywide lockdown&nbsp;<em>(associated with the first year of the COVID-19 pandemic)&nbsp;</em>was imposed.&nbsp;</p><p style="text-align:justify"><em><strong>References</strong></em></p><p style="text-align:justify">Fourth Periodic Labour Force Survey Annual Report (July 2020-June 2021), released in June 2022, National Statistical Office (NSO), Ministry of Statistics and Programme Implementation (MoSPI), <a href="https://im4change.org/upload/files/Annual%20Report%20PLFS%202020-21.pdf" title="https://im4change.org/upload/files/Annual%20Report%20PLFS%202020-21.pdf">click here</a> to access &nbsp;</p><p style="text-align:justify">Third Periodic Labour Force Survey Annual Report (July 2019-June 2020), released in July 2021, National Statistical Office (NSO), Ministry of Statistics and Programme Implementation (MoSPI), please <a href="https://im4change.org/upload/files/Annual_Report_PLFS_2019_20.pdf" title="https://im4change.org/upload/files/Annual_Report_PLFS_2019_20.pdf">click here</a> to access &nbsp;</p><p style="text-align:justify">Second Periodic Labour Force Survey Annual Report (July 2018-June 2019), released in June 2020, National Statistical Office (NSO), Ministry of Statistics and Programme Implementation (MoSPI), please <a href="https://im4change.org/docs/annual-report-on-periodic-labour-force-survey-july-2018-june-2019.pdf" title="https://im4change.org/docs/annual-report-on-periodic-labour-force-survey-july-2018-june-2019.pdf">click here</a> to access &nbsp;</p><p style="text-align:justify">First Periodic Labour Force Survey Annual Report (July 2017-June 2018), released in May 2019, National Statistical Office (NSO), Ministry of Statistics and Programme Implementation (MoSPI), please <a href="https://im4change.org/docs/216Annual_Report_PLFS_2017_18_31052019.pdf" title="https://im4change.org/docs/216Annual_Report_PLFS_2017_18_31052019.pdf">click here</a> to access &nbsp;&nbsp;</p><p style="text-align:justify">News alert: Quality of work matters, and not just job creation, Inclusive Media for Change, Published on: Sep 26, 2022, please <a href="https://im4change.org/news-alerts-57/plfs-unemployment-rate-labour-force-participation-rate-worker-population-ratio-decent-work-social-security-quality-of-work-gainful-employment.html" title="https://im4change.org/news-alerts-57/plfs-unemployment-rate-labour-force-participation-rate-worker-population-ratio-decent-work-social-security-quality-of-work-gainful-employment.html">click here</a> to access</p><p style="text-align:justify">What&rsquo;s behind the &lsquo;improvement&rsquo; in employment situation in labour force survey report -PC Mohanan, ThePrint, 21 August, 2021, please <a href="https://theprint.in/opinion/what-is-behind-the-improvement-in-employment-situation/719674/" title="https://theprint.in/opinion/what-is-behind-the-improvement-in-employment-situation/719674/">click here</a> to access&nbsp;</p><p style="text-align:justify"><br /><strong>Image Courtesy: Inclusive Media for Change/ Himanshu Joshi</strong></p>'
$lang = 'English'
$SITE_URL = 'https://im4change.in/'
$site_title = 'im4change'
$adminprix = 'admin'</pre><pre class="stack-trace">include - APP/Template/Layout/printlayout.ctp, line 8
Cake\View\View::_evaluate() - CORE/src/View/View.php, line 1413
Cake\View\View::_render() - CORE/src/View/View.php, line 1374
Cake\View\View::renderLayout() - CORE/src/View/View.php, line 927
Cake\View\View::render() - CORE/src/View/View.php, line 885
Cake\Controller\Controller::render() - CORE/src/Controller/Controller.php, line 791
Cake\Http\ActionDispatcher::_invoke() - CORE/src/Http/ActionDispatcher.php, line 126
Cake\Http\ActionDispatcher::dispatch() - CORE/src/Http/ActionDispatcher.php, line 94
Cake\Http\BaseApplication::__invoke() - CORE/src/Http/BaseApplication.php, line 235
Cake\Http\Runner::__invoke() - CORE/src/Http/Runner.php, line 65
Cake\Routing\Middleware\RoutingMiddleware::__invoke() - CORE/src/Routing/Middleware/RoutingMiddleware.php, line 162
Cake\Http\Runner::__invoke() - CORE/src/Http/Runner.php, line 65
Cake\Routing\Middleware\AssetMiddleware::__invoke() - CORE/src/Routing/Middleware/AssetMiddleware.php, line 88
Cake\Http\Runner::__invoke() - CORE/src/Http/Runner.php, line 65
Cake\Error\Middleware\ErrorHandlerMiddleware::__invoke() - CORE/src/Error/Middleware/ErrorHandlerMiddleware.php, line 96
Cake\Http\Runner::__invoke() - CORE/src/Http/Runner.php, line 65
Cake\Http\Runner::run() - CORE/src/Http/Runner.php, line 51</pre></div></pre>news-alerts-57/how-well-did-the-women-worker-fare-during-the-pandemic-years-plfs-reports-provide-some-mixed-answers-casual-workers-self-employed-unpaid-helpers-family-enterprises-regular-wage-salaried.html"/>
<meta http-equiv="Content-Type" content="text/html; charset=utf-8"/>
<link href="https://im4change.in/css/control.css" rel="stylesheet" type="text/css"
media="all"/>
<title>NEWS ALERTS | How well did the women workers fare during the pandemic years? The yearly PLFS reports provide some mixed answers. | Im4change.org</title>
<meta name="description" content="Do you want a job that does not pay you at all? The answer will be surely 'no' for most of us. And yet, in our previous analysis, it was found that the proportion of 'helpers in household enterprises' among..."/>
<script src="https://im4change.in/js/jquery-1.10.2.js"></script>
<script type="text/javascript" src="https://im4change.in/js/jquery-migrate.min.js"></script>
<script language="javascript" type="text/javascript">
$(document).ready(function () {
var img = $("img")[0]; // Get my img elem
var pic_real_width, pic_real_height;
$("<img/>") // Make in memory copy of image to avoid css issues
.attr("src", $(img).attr("src"))
.load(function () {
pic_real_width = this.width; // Note: $(this).width() will not
pic_real_height = this.height; // work for in memory images.
});
});
</script>
<style type="text/css">
@media screen {
div.divFooter {
display: block;
}
}
@media print {
.printbutton {
display: none !important;
}
}
</style>
</head>
<body>
<table cellpadding="0" cellspacing="0" border="0" width="98%" align="center">
<tr>
<td class="top_bg">
<div class="divFooter">
<img src="https://im4change.in/images/logo1.jpg" height="59" border="0"
alt="Resource centre on India's rural distress" style="padding-top:14px;"/>
</div>
</td>
</tr>
<tr>
<td id="topspace"> </td>
</tr>
<tr id="topspace">
<td> </td>
</tr>
<tr>
<td height="50" style="border-bottom:1px solid #000; padding-top:10px;" class="printbutton">
<form><input type="button" value=" Print this page "
onclick="window.print();return false;"/></form>
</td>
</tr>
<tr>
<td width="100%">
<h1 class="news_headlines" style="font-style:normal">
<strong>How well did the women workers fare during the pandemic years? The yearly PLFS reports provide some mixed answers.</strong></h1>
</td>
</tr>
<tr>
<td width="100%" style="font-family:Arial, 'Segoe Script', 'Segoe UI', sans-serif, serif"><font size="3">
<p style="text-align:justify">Do you want a job that does not pay you at all? The answer will be surely 'no' for most of us. And yet, in our <a href="https://im4change.org/news-alerts-57/plfs-unemployment-rate-labour-force-participation-rate-worker-population-ratio-decent-work-social-security-quality-of-work-gainful-employment.html" title="https://im4change.org/news-alerts-57/plfs-unemployment-rate-labour-force-participation-rate-worker-population-ratio-decent-work-social-security-quality-of-work-gainful-employment.html">previous analysis</a>, it was found that the proportion of 'helpers in household enterprises' among the total number of workers grew over various rounds of annual PLFS <em>(Periodic Labour Force Survey)</em>, from 13.3 percent to 15.9 percent between PLFS 2018-19 and PLFS 2019-20, and then soared further to 17.3 percent in PLFS 2020-21. </p><p style="text-align:justify">The most elemental question that comes to one’s mind is which gender took up such unpaid, low-quality jobs during the pandemic years and whether there was a rural-urban divide noticed in that trend. </p><p style="text-align:justify">Without further ado, it needs to be mentioned here that from table-15 of each of the annual PLFS reports <em>(please click <a href="https://im4change.org/upload/files/Annual%20Report%20PLFS%202020-21.pdf" title="https://im4change.org/upload/files/Annual%20Report%20PLFS%202020-21.pdf">here</a>, <a href="https://im4change.org/upload/files/Annual_Report_PLFS_2019_20.pdf" title="https://im4change.org/upload/files/Annual_Report_PLFS_2019_20.pdf">here</a>, <a href="https://im4change.org/docs/annual-report-on-periodic-labour-force-survey-july-2018-june-2019.pdf" title="https://im4change.org/docs/annual-report-on-periodic-labour-force-survey-july-2018-june-2019.pdf">here</a> and <a href="https://im4change.org/docs/216Annual_Report_PLFS_2017_18_31052019.pdf" title="https://im4change.org/docs/216Annual_Report_PLFS_2017_18_31052019.pdf">here</a> to access)</em>, the proportion of male and female workers for various categories of work is extracted, and the data is presented as table-1 and table-2 in this analysis.</p><p style="text-align:justify">The categories of workers, which have been considered in the present news alert, are as follows: </p><p style="text-align:justify"><strong>Self-employed </strong></p><p style="text-align:justify">- Code 11: worked in household enterprises <em>(self-employed) </em>as own-account worker <br />- Code 12: worked in household enterprises <em>(self-employed) </em>as an employer<br />- Code 21: worked in household enterprises <em>(self-employed) </em>as helper </p><p style="text-align:justify"><strong>Regular/salaried </strong></p><p style="text-align:justify">- Code 31: worked as regular wage/salaried employee </p><p style="text-align:justify"><strong>Casual Workers </strong></p><p style="text-align:justify">- Code 41: worked as casual labour in public works other than MGNREG public works<br />- Code 51: worked as casual labour in other types of works</p><p style="text-align:justify"><strong>Not working but seeking/available for work <em>(or unemployed)</em></strong></p><p style="text-align:justify">- Code 81: sought work or did not seek but was available for work <em>(for usual status approach)</em> </p><p style="text-align:justify"><strong>Neither working nor available for work <em>(or not in labour force)</em> </strong></p><p style="text-align:justify">- Code 97: others <em>(including beggars, prostitutes, etc.)</em></p><p style="text-align:justify"><strong>---</strong></p><p style="text-align:justify">In rural areas, the proportion of usual status male workers as self-employed <em>(sum of own-account workers and employers in household enterprises) </em>increased over various rounds of annual PLFS, from 34.7 percent in PLFS 2017-18 to 36.6 percent in PLFS 2020-21. In urban areas too, for the same category of self-employed, this proportion went up between PLFS 2018-19 and PLFS 2020-21. Please see table-1.</p><p style="text-align:justify"><strong>Table 1: Percentage of usual status workers in different categories of 15 years plus population: Male</strong></p><p style="text-align:justify"><img alt="" src="/upload/images/Table%201%20Percentage%20of%20usual%20status%20workers%20in%20different%20categories%20of%2015%20plus%20population%20Male.png" style="height:295px; width:860px" /></p><p style="text-align:justify"><em><strong>Source: </strong>Fourth Periodic Labour Force Survey Annual Report (July 2020-June 2021), please <a href="https://im4change.org/upload/files/Annual%20Report%20PLFS%202020-21.pdf" title="https://im4change.org/upload/files/Annual%20Report%20PLFS%202020-21.pdf">click here</a> to access </em></p><p style="text-align:justify"><em>Third Periodic Labour Force Survey Annual Report (July 2019-June 2020), please <a href="https://im4change.org/upload/files/Annual_Report_PLFS_2019_20.pdf" title="https://im4change.org/upload/files/Annual_Report_PLFS_2019_20.pdf">click here</a> to access </em></p><p style="text-align:justify"><em>Second Periodic Labour Force Survey Annual Report (July 2018-June 2019), please <a href="https://im4change.org/docs/annual-report-on-periodic-labour-force-survey-july-2018-june-2019.pdf" title="https://im4change.org/docs/annual-report-on-periodic-labour-force-survey-july-2018-june-2019.pdf">click here</a> to access </em></p><p style="text-align:justify"><em>First Periodic Labour Force Survey Annual Report (July 2017-June 2018), please <a href="https://im4change.org/docs/216Annual_Report_PLFS_2017_18_31052019.pdf" title="https://im4change.org/docs/216Annual_Report_PLFS_2017_18_31052019.pdf">click here</a> to access </em></p><p style="text-align:justify"><strong>---</strong></p><p style="text-align:justify">The proportion of usual status female workers as self-employed <em>(sum of own-account workers and employers in household enterprises) </em>climbed up over various rounds of annual PLFS, from 4.5 percent in PLFS 2017-18 to 7.9 percent in PLFS 2020-21. In urban areas too, for the same category of self-employed, this proportion went up between PLFS 2017-18 and PLFS 2020-21. Kindly take a look at table-2.</p><p style="text-align:justify"><strong>Table 2: Percentage of usual status workers in different categories of 15 years plus population: Female</strong></p><p style="text-align:justify"><img alt="" src="/upload/images/Table%202%20Percentage%20of%20usual%20status%20workers%20in%20different%20categories%20of%2015%20plus%20population%20Female.png" style="height:295px; width:861px" /></p><p style="text-align:justify"><em><strong>Source: </strong>Same as table-1</em><br /><strong>---</strong></p><p style="text-align:justify">As can be seen from table-1 of this analysis, although the proportion of usual status male workers as household enterprise helpers in rural areas came down slightly between PLFS 2017-18 and PLFS 2018-19, it gradually went up to 7.7 percent in PLFS 2019-20, and further to 8.2 percent in PLFS 2020-21. </p><p style="text-align:justify">In urban areas, after remaining unchanged for two successive rounds of annual PLFS, the proportion of usual status male workers as household enterprise helpers increased marginally to 3.1 percent in PLFS 2020-21. </p><p style="text-align:justify"><span style="background-color:#ffcc00">In contrast to male workers, the proportion of usual status female workers as household enterprise helpers in rural areas increased over various rounds of annual PLFS, from 9.1 percent in PLFS 2017-18 to 15.3 percent in PLFS 2020-21. Between PLFS 2018-19 and PLFS 2019-20, there was a noticeable jump in the proportion of usual status female workers as household enterprise helpers in such areas. In rural areas, compared to its male counterpart, a higher proportion of usual status female workers worked as household enterprise helpers during each of the annual PLFS rounds, from PLFS 2017-18 to PLFS 2020-21. The gap between the proportion of usual status female workers as household enterprise helpers and that of its male counterpart in rural areas expanded from 2.1 percentage points (p.p.) to 7.1 p.p. between PLFS 2017-18 and PLFS 2020-21. Kindly compare table-1 against table-2. </span></p><p style="text-align:justify">In urban areas, the proportion of usual status female workers as household enterprise helpers increased over various rounds of annual PLFS, from 1.8 percent in PLFS 2018-19 to 2.6 percent in PLFS 2020-21. </p><p style="text-align:justify">In rural areas, the proportion of usual status male workers as regular/salaried workers remained almost the same between PLFS 2017-18 and PLFS 2020-21. However, the proportion of usual status male workers as regular/salaried workers decreased from 33.0 percent to 31.7 percent between PLFS 2019-20 and PLFS 2020-21 in urban areas. Please see table-1.</p><p style="text-align:justify">In rural areas, the proportion of usual status female workers as regular/salaried workers increased over various annual PLFS rounds, from 2.5 percent in PLFS 2017-18 to 3.3 percent in PLFS 2020-21. In urban areas, at first the proportion of usual status female workers as regular/salaried workers grew from 9.5 percent in PLFS 2017-18 to 11.5 percent in PLFS 2019-20, but then it dropped to 10.6 percent in PLFS 2020-21.</p><p style="text-align:justify">In rural areas, the proportion of usual status male workers who worked as casual labour in other types of works <em>(i.e., excluding public works as well as MGNREGA) </em>remained at around 20 percent in various annual PLFS rounds. For the same category of workers in urban areas, this proportion marginally rose from 9.6 percent in PLFS 2018-19 to 9.8 percent in PLFS 2019-20, and further to 10.3 percent in 2020-21. Kindly consult table-1.</p><p style="text-align:justify">In rural areas, the proportion of usual status female workers who worked as casual labour in other types of works <em>(i.e., excluding public works as well as MGNREGA) </em>increased from 6.6 percent to 8.3 percent between PLFS 2018-19 and PLFS 2020-21. For the same category of workers in urban areas, this proportion remained the same in PLFS 2019-20 and PLFS 2020-21. Kindly look at table-2.</p><p style="text-align:justify">Please note that the <a href="https://im4change.org/upload/files/Annual%20Report%20PLFS%202020-21.pdf" title="https://im4change.org/upload/files/Annual%20Report%20PLFS%202020-21.pdf" title="https://im4change.org/upload/files/Annual%20Report%20PLFS%202020-21.pdf" title="https://im4change.org/upload/files/Annual%20Report%20PLFS%202020-21.pdf">Annual Report on PLFS 2020-2021</a> has also covered the period <em>(i.e., April-June, 2021) </em>when the state-wide lockdowns associated with the second wave of COVID-19 were imposed. The <a href="https://im4change.org/upload/files/Annual_Report_PLFS_2019_20.pdf" title="https://im4change.org/upload/files/Annual_Report_PLFS_2019_20.pdf" title="https://im4change.org/upload/files/Annual_Report_PLFS_2019_20.pdf" title="https://im4change.org/upload/files/Annual_Report_PLFS_2019_20.pdf">Annual Report on PLFS 2019-20</a> too had covered the period <em>(i.e., April-June, 2020)</em> when the countrywide lockdown <em>(associated with the first year of the COVID-19 pandemic) </em>was imposed. </p><p style="text-align:justify"><em><strong>References</strong></em></p><p style="text-align:justify">Fourth Periodic Labour Force Survey Annual Report (July 2020-June 2021), released in June 2022, National Statistical Office (NSO), Ministry of Statistics and Programme Implementation (MoSPI), <a href="https://im4change.org/upload/files/Annual%20Report%20PLFS%202020-21.pdf" title="https://im4change.org/upload/files/Annual%20Report%20PLFS%202020-21.pdf">click here</a> to access </p><p style="text-align:justify">Third Periodic Labour Force Survey Annual Report (July 2019-June 2020), released in July 2021, National Statistical Office (NSO), Ministry of Statistics and Programme Implementation (MoSPI), please <a href="https://im4change.org/upload/files/Annual_Report_PLFS_2019_20.pdf" title="https://im4change.org/upload/files/Annual_Report_PLFS_2019_20.pdf">click here</a> to access </p><p style="text-align:justify">Second Periodic Labour Force Survey Annual Report (July 2018-June 2019), released in June 2020, National Statistical Office (NSO), Ministry of Statistics and Programme Implementation (MoSPI), please <a href="https://im4change.org/docs/annual-report-on-periodic-labour-force-survey-july-2018-june-2019.pdf" title="https://im4change.org/docs/annual-report-on-periodic-labour-force-survey-july-2018-june-2019.pdf">click here</a> to access </p><p style="text-align:justify">First Periodic Labour Force Survey Annual Report (July 2017-June 2018), released in May 2019, National Statistical Office (NSO), Ministry of Statistics and Programme Implementation (MoSPI), please <a href="https://im4change.org/docs/216Annual_Report_PLFS_2017_18_31052019.pdf" title="https://im4change.org/docs/216Annual_Report_PLFS_2017_18_31052019.pdf">click here</a> to access </p><p style="text-align:justify">News alert: Quality of work matters, and not just job creation, Inclusive Media for Change, Published on: Sep 26, 2022, please <a href="https://im4change.org/news-alerts-57/plfs-unemployment-rate-labour-force-participation-rate-worker-population-ratio-decent-work-social-security-quality-of-work-gainful-employment.html" title="https://im4change.org/news-alerts-57/plfs-unemployment-rate-labour-force-participation-rate-worker-population-ratio-decent-work-social-security-quality-of-work-gainful-employment.html">click here</a> to access</p><p style="text-align:justify">What’s behind the ‘improvement’ in employment situation in labour force survey report -PC Mohanan, ThePrint, 21 August, 2021, please <a href="https://theprint.in/opinion/what-is-behind-the-improvement-in-employment-situation/719674/" title="https://theprint.in/opinion/what-is-behind-the-improvement-in-employment-situation/719674/">click here</a> to access </p><p style="text-align:justify"><br /><strong>Image Courtesy: Inclusive Media for Change/ Himanshu Joshi</strong></p> </font>
</td>
</tr>
<tr>
<td> </td>
</tr>
<tr>
<td height="50" style="border-top:1px solid #000; border-bottom:1px solid #000;padding-top:10px;">
<form><input type="button" value=" Print this page "
onclick="window.print();return false;"/></form>
</td>
</tr>
</table></body>
</html>'
}
$reasonPhrase = 'OK'
header - [internal], line ??
Cake\Http\ResponseEmitter::emitStatusLine() - CORE/src/Http/ResponseEmitter.php, line 148
Cake\Http\ResponseEmitter::emit() - CORE/src/Http/ResponseEmitter.php, line 54
Cake\Http\Server::emit() - CORE/src/Http/Server.php, line 141
[main] - ROOT/webroot/index.php, line 39
Warning (2): Cannot modify header information - headers already sent by (output started at /home/brlfuser/public_html/vendor/cakephp/cakephp/src/Error/Debugger.php:853) [CORE/src/Http/ResponseEmitter.php, line 181]
$response = object(Cake\Http\Response) {
'status' => (int) 200,
'contentType' => 'text/html',
'headers' => [
'Content-Type' => [
[maximum depth reached]
]
],
'file' => null,
'fileRange' => [],
'cookies' => object(Cake\Http\Cookie\CookieCollection) {},
'cacheDirectives' => [],
'body' => '<!DOCTYPE html PUBLIC "-//W3C//DTD XHTML 1.0 Transitional//EN"
"http://www.w3.org/TR/xhtml1/DTD/xhtml1-transitional.dtd">
<html xmlns="http://www.w3.org/1999/xhtml">
<head>
<link rel="canonical" href="https://im4change.in/<pre class="cake-error"><a href="javascript:void(0);" onclick="document.getElementById('cakeErr67f4892922ad8-trace').style.display = (document.getElementById('cakeErr67f4892922ad8-trace').style.display == 'none' ? '' : 'none');"><b>Notice</b> (8)</a>: Undefined variable: urlPrefix [<b>APP/Template/Layout/printlayout.ctp</b>, line <b>8</b>]<div id="cakeErr67f4892922ad8-trace" class="cake-stack-trace" style="display: none;"><a href="javascript:void(0);" onclick="document.getElementById('cakeErr67f4892922ad8-code').style.display = (document.getElementById('cakeErr67f4892922ad8-code').style.display == 'none' ? '' : 'none')">Code</a> <a href="javascript:void(0);" onclick="document.getElementById('cakeErr67f4892922ad8-context').style.display = (document.getElementById('cakeErr67f4892922ad8-context').style.display == 'none' ? '' : 'none')">Context</a><pre id="cakeErr67f4892922ad8-code" class="cake-code-dump" style="display: none;"><code><span style="color: #000000"><span style="color: #0000BB"></span><span style="color: #007700"><</span><span style="color: #0000BB">head</span><span style="color: #007700">>
</span></span></code>
<span class="code-highlight"><code><span style="color: #000000"> <link rel="canonical" href="<span style="color: #0000BB"><?php </span><span style="color: #007700">echo </span><span style="color: #0000BB">Configure</span><span style="color: #007700">::</span><span style="color: #0000BB">read</span><span style="color: #007700">(</span><span style="color: #DD0000">'SITE_URL'</span><span style="color: #007700">); </span><span style="color: #0000BB">?><?php </span><span style="color: #007700">echo </span><span style="color: #0000BB">$urlPrefix</span><span style="color: #007700">;</span><span style="color: #0000BB">?><?php </span><span style="color: #007700">echo </span><span style="color: #0000BB">$article_current</span><span style="color: #007700">-></span><span style="color: #0000BB">category</span><span style="color: #007700">-></span><span style="color: #0000BB">slug</span><span style="color: #007700">; </span><span style="color: #0000BB">?></span>/<span style="color: #0000BB"><?php </span><span style="color: #007700">echo </span><span style="color: #0000BB">$article_current</span><span style="color: #007700">-></span><span style="color: #0000BB">seo_url</span><span style="color: #007700">; </span><span style="color: #0000BB">?></span>.html"/>
</span></code></span>
<code><span style="color: #000000"><span style="color: #0000BB"> </span><span style="color: #007700"><</span><span style="color: #0000BB">meta http</span><span style="color: #007700">-</span><span style="color: #0000BB">equiv</span><span style="color: #007700">=</span><span style="color: #DD0000">"Content-Type" </span><span style="color: #0000BB">content</span><span style="color: #007700">=</span><span style="color: #DD0000">"text/html; charset=utf-8"</span><span style="color: #007700">/>
</span></span></code></pre><pre id="cakeErr67f4892922ad8-context" class="cake-context" style="display: none;">$viewFile = '/home/brlfuser/public_html/src/Template/Layout/printlayout.ctp'
$dataForView = [
'article_current' => object(App\Model\Entity\Article) {
'id' => (int) 63956,
'title' => 'How well did the women workers fare during the pandemic years? The yearly PLFS reports provide some mixed answers.',
'subheading' => null,
'description' => '<p style="text-align:justify">Do you want a job that does not pay you at all? The answer will be surely &#39;no&#39; for most of us. And yet, in our <a href="https://im4change.org/news-alerts-57/plfs-unemployment-rate-labour-force-participation-rate-worker-population-ratio-decent-work-social-security-quality-of-work-gainful-employment.html">previous analysis</a>, it was found that the proportion of &#39;helpers in household enterprises&#39; among the total number of workers grew over various rounds of annual PLFS <em>(Periodic Labour Force Survey)</em>, from 13.3 percent to 15.9 percent between PLFS 2018-19 and PLFS 2019-20, and then soared further to 17.3 percent in PLFS 2020-21.&nbsp;</p>
<p style="text-align:justify">The most elemental question that comes to one&rsquo;s mind is which gender took up such unpaid, low-quality jobs during the pandemic years and whether there was a rural-urban divide noticed in that trend.&nbsp;</p>
<p style="text-align:justify">Without further ado, it needs to be mentioned here that from table-15 of each of the annual PLFS reports <em>(please click <a href="https://im4change.org/upload/files/Annual%20Report%20PLFS%202020-21.pdf">here</a>, <a href="https://im4change.org/upload/files/Annual_Report_PLFS_2019_20.pdf">here</a>, <a href="https://im4change.org/docs/annual-report-on-periodic-labour-force-survey-july-2018-june-2019.pdf">here</a> and <a href="https://im4change.org/docs/216Annual_Report_PLFS_2017_18_31052019.pdf">here</a> to access)</em>, the proportion of male and female workers for various categories of work is extracted, and the data is presented as table-1 and table-2 in this analysis.</p>
<p style="text-align:justify">The categories of workers, which have been considered in the present news alert, are as follows:&nbsp;</p>
<p style="text-align:justify"><strong>Self-employed&nbsp;</strong></p>
<p style="text-align:justify">- Code 11: worked in household enterprises <em>(self-employed) </em>as own-account worker&nbsp;<br />
- Code 12: worked in household enterprises <em>(self-employed) </em>as an employer<br />
- Code 21: worked in household enterprises <em>(self-employed) </em>as helper&nbsp;</p>
<p style="text-align:justify"><strong>Regular/salaried&nbsp;</strong></p>
<p style="text-align:justify">- Code 31: worked as regular wage/salaried employee&nbsp;</p>
<p style="text-align:justify"><strong>Casual Workers&nbsp;</strong></p>
<p style="text-align:justify">- Code 41: worked as casual labour in public works other than MGNREG public works<br />
- Code 51: worked as casual labour in other types of works</p>
<p style="text-align:justify"><strong>Not working but seeking/available for work <em>(or unemployed)</em></strong></p>
<p style="text-align:justify">- Code 81: sought work or did not seek but was available for work <em>(for usual status approach)</em>&nbsp;</p>
<p style="text-align:justify"><strong>Neither working nor available for work <em>(or not in labour force)</em>&nbsp;</strong></p>
<p style="text-align:justify">- Code 97: others <em>(including beggars, prostitutes, etc.)</em></p>
<p style="text-align:justify"><strong>---</strong></p>
<p style="text-align:justify">In rural areas, the proportion of usual status male workers as self-employed <em>(sum of own-account workers and employers in household enterprises) </em>increased over various rounds of annual PLFS, from 34.7&nbsp;percent in PLFS 2017-18 to 36.6 percent in PLFS 2020-21. In urban areas too, for the same category of self-employed, this proportion went up between PLFS 2018-19 and PLFS 2020-21. Please see table-1.</p>
<p style="text-align:justify"><strong>Table 1: Percentage of usual status workers in different categories of 15 years plus population: Male</strong></p>
<p style="text-align:justify"><img alt="" src="/upload/images/Table%201%20Percentage%20of%20usual%20status%20workers%20in%20different%20categories%20of%2015%20plus%20population%20Male.png" style="height:295px; width:860px" /></p>
<p style="text-align:justify"><em><strong>Source: </strong>Fourth Periodic Labour Force Survey Annual Report (July 2020-June 2021), please <a href="https://im4change.org/upload/files/Annual%20Report%20PLFS%202020-21.pdf">click here</a> to access &nbsp;</em></p>
<p style="text-align:justify"><em>Third Periodic Labour Force Survey Annual Report (July 2019-June 2020), please <a href="https://im4change.org/upload/files/Annual_Report_PLFS_2019_20.pdf ">click here</a> to access &nbsp;</em></p>
<p style="text-align:justify"><em>Second Periodic Labour Force Survey Annual Report (July 2018-June 2019), please <a href="https://im4change.org/docs/annual-report-on-periodic-labour-force-survey-july-2018-june-2019.pdf ">click here</a> to access &nbsp;</em></p>
<p style="text-align:justify"><em>First Periodic Labour Force Survey Annual Report (July 2017-June 2018), please <a href="https://im4change.org/docs/216Annual_Report_PLFS_2017_18_31052019.pdf ">click here</a> to access &nbsp;</em></p>
<p style="text-align:justify"><strong>---</strong></p>
<p style="text-align:justify">The proportion of usual status female workers as self-employed <em>(sum of own-account workers and employers in household enterprises) </em>climbed up over various rounds of annual PLFS, from 4.5 percent in PLFS 2017-18 to 7.9 percent in PLFS 2020-21. In urban areas too, for the same category of self-employed, this proportion went up between PLFS 2017-18 and PLFS 2020-21. Kindly take a look at table-2.</p>
<p style="text-align:justify"><strong>Table 2: Percentage of usual status workers in different categories of 15 years plus population: Female</strong></p>
<p style="text-align:justify"><img alt="" src="/upload/images/Table%202%20Percentage%20of%20usual%20status%20workers%20in%20different%20categories%20of%2015%20plus%20population%20Female.png" style="height:295px; width:861px" /></p>
<p style="text-align:justify"><em><strong>Source: </strong>Same as table-1</em><br />
<strong>---</strong></p>
<p style="text-align:justify">As can be seen from table-1 of this analysis, although the proportion of usual status male workers as household enterprise helpers in rural areas came down slightly between PLFS 2017-18 and PLFS 2018-19, it gradually went up to 7.7&nbsp;percent in PLFS 2019-20, and further to 8.2&nbsp;percent in PLFS 2020-21.&nbsp;</p>
<p style="text-align:justify">In urban areas, after remaining unchanged for two successive rounds of annual PLFS, the proportion of usual status male workers as household enterprise helpers increased marginally to 3.1&nbsp;percent in PLFS 2020-21.&nbsp;</p>
<p style="text-align:justify"><span style="background-color:#ffcc00">In contrast to male workers, the proportion of usual status female workers as household enterprise helpers in rural areas increased over various rounds of annual PLFS, from 9.1 percent in PLFS 2017-18 to 15.3 percent in PLFS 2020-21. Between PLFS 2018-19 and PLFS 2019-20, there was a noticeable jump in the proportion of usual status female workers as household enterprise helpers in such areas. In rural areas, compared to its male counterpart, a higher proportion of usual status female workers worked as household enterprise helpers during each of the annual PLFS rounds, from PLFS 2017-18 to PLFS 2020-21.&nbsp;The gap between the proportion of usual status female workers as household enterprise helpers and that of its male counterpart in rural areas expanded from 2.1 percentage points (p.p.) to 7.1 p.p. between PLFS 2017-18 and PLFS 2020-21. Kindly compare table-1 against table-2.&nbsp;</span></p>
<p style="text-align:justify">In urban areas, the proportion of usual status female workers as household enterprise helpers increased over various rounds of annual PLFS, from 1.8 percent in PLFS 2018-19 to 2.6 percent in PLFS 2020-21.&nbsp;</p>
<p style="text-align:justify">In rural areas, the proportion of usual status male workers as regular/salaried workers remained almost the same between PLFS 2017-18 and PLFS 2020-21. However, the proportion of usual status male workers as regular/salaried workers decreased from 33.0 percent to 31.7 percent between PLFS 2019-20 and PLFS 2020-21 in urban areas. Please see table-1.</p>
<p style="text-align:justify">In rural areas, the proportion of usual status female workers as regular/salaried workers increased over various annual PLFS rounds, from 2.5 percent in PLFS 2017-18 to 3.3 percent in PLFS 2020-21. In urban areas, at first the proportion of usual status female workers as regular/salaried workers grew from 9.5 percent in PLFS 2017-18 to 11.5 percent in PLFS 2019-20, but then it dropped to 10.6 percent in PLFS 2020-21.</p>
<p style="text-align:justify">In rural areas, the proportion of usual status male workers who worked as casual labour in other types of works <em>(i.e., excluding public works as well as MGNREGA) </em>remained at around 20 percent in various annual PLFS rounds. For the same category of workers in urban areas, this proportion marginally rose from 9.6 percent in PLFS 2018-19 to 9.8 percent in PLFS 2019-20, and further to 10.3 percent in 2020-21. Kindly consult table-1.</p>
<p style="text-align:justify">In rural areas, the proportion of usual status female workers who worked as casual labour in other types of works <em>(i.e., excluding public works as well as MGNREGA) </em>increased from 6.6 percent to 8.3 percent between PLFS 2018-19 and PLFS 2020-21. For the same category of workers in urban areas, this proportion remained the same in PLFS 2019-20 and PLFS 2020-21.&nbsp;Kindly look at table-2.</p>
<p style="text-align:justify">Please note&nbsp;that the&nbsp;<a href="https://im4change.org/upload/files/Annual%20Report%20PLFS%202020-21.pdf" title="https://im4change.org/upload/files/Annual%20Report%20PLFS%202020-21.pdf">Annual Report on PLFS 2020-2021</a>&nbsp;has also covered the period&nbsp;<em>(i.e., April-June, 2021)&nbsp;</em>when the state-wide lockdowns&nbsp;associated with the second wave of COVID-19&nbsp;were imposed. The&nbsp;<a href="https://im4change.org/upload/files/Annual_Report_PLFS_2019_20.pdf" title="https://im4change.org/upload/files/Annual_Report_PLFS_2019_20.pdf">Annual Report on PLFS 2019-20</a>&nbsp;too had covered the period&nbsp;<em>(i.e., April-June, 2020)</em>&nbsp;when the countrywide lockdown&nbsp;<em>(associated with the first year of the COVID-19 pandemic)&nbsp;</em>was imposed.&nbsp;</p>
<p style="text-align:justify"><em><strong>References</strong></em></p>
<p style="text-align:justify">Fourth Periodic Labour Force Survey Annual Report (July 2020-June 2021), released in June 2022, National Statistical Office (NSO), Ministry of Statistics and Programme Implementation (MoSPI), <a href="https://im4change.org/upload/files/Annual%20Report%20PLFS%202020-21.pdf">click here</a> to access &nbsp;</p>
<p style="text-align:justify">Third Periodic Labour Force Survey Annual Report (July 2019-June 2020), released in July 2021, National Statistical Office (NSO), Ministry of Statistics and Programme Implementation (MoSPI), please <a href="https://im4change.org/upload/files/Annual_Report_PLFS_2019_20.pdf ">click here</a> to access &nbsp;</p>
<p style="text-align:justify">Second Periodic Labour Force Survey Annual Report (July 2018-June 2019), released in June 2020, National Statistical Office (NSO), Ministry of Statistics and Programme Implementation (MoSPI), please <a href="https://im4change.org/docs/annual-report-on-periodic-labour-force-survey-july-2018-june-2019.pdf ">click here</a> to access &nbsp;</p>
<p style="text-align:justify">First Periodic Labour Force Survey Annual Report (July 2017-June 2018), released in May 2019, National Statistical Office (NSO), Ministry of Statistics and Programme Implementation (MoSPI), please <a href="https://im4change.org/docs/216Annual_Report_PLFS_2017_18_31052019.pdf ">click here</a> to access &nbsp;&nbsp;</p>
<p style="text-align:justify">News alert: Quality of work matters, and not just job creation, Inclusive Media for Change, Published on: Sep 26, 2022, please <a href="https://im4change.org/news-alerts-57/plfs-unemployment-rate-labour-force-participation-rate-worker-population-ratio-decent-work-social-security-quality-of-work-gainful-employment.html">click here</a> to access</p>
<p style="text-align:justify">What&rsquo;s behind the &lsquo;improvement&rsquo; in employment situation in labour force survey report -PC Mohanan, ThePrint, 21 August, 2021, please <a href="https://theprint.in/opinion/what-is-behind-the-improvement-in-employment-situation/719674/ ">click here</a> to access&nbsp;</p>
<p style="text-align:justify"><br />
<strong>Image Courtesy: Inclusive Media for Change/ Himanshu Joshi</strong></p>
',
'credit_writer' => '',
'article_img' => 'Image Employment dated 7 Oct 2022.jpg',
'article_img_thumb' => 'Image Employment dated 7 Oct 2022.jpg',
'status' => (int) 1,
'show_on_home' => (int) 1,
'lang' => 'EN',
'category_id' => (int) 4,
'tag_keyword' => '',
'seo_url' => 'how-well-did-the-women-worker-fare-during-the-pandemic-years-plfs-reports-provide-some-mixed-answers-casual-workers-self-employed-unpaid-helpers-family-enterprises-regular-wage-salaried',
'meta_title' => '',
'meta_keywords' => '',
'meta_description' => '',
'noindex' => (int) 1,
'publish_date' => object(Cake\I18n\FrozenDate) {},
'most_visit_section_id' => null,
'article_big_img' => null,
'liveid' => null,
'created' => object(Cake\I18n\FrozenTime) {},
'modified' => object(Cake\I18n\FrozenTime) {},
'edate' => '',
'tags' => [
[maximum depth reached]
],
'category' => object(App\Model\Entity\Category) {},
'[new]' => false,
'[accessible]' => [
[maximum depth reached]
],
'[dirty]' => [[maximum depth reached]],
'[original]' => [[maximum depth reached]],
'[virtual]' => [[maximum depth reached]],
'[hasErrors]' => false,
'[errors]' => [[maximum depth reached]],
'[invalid]' => [[maximum depth reached]],
'[repository]' => 'Articles'
},
'articleid' => (int) 63956,
'metaTitle' => 'NEWS ALERTS | How well did the women workers fare during the pandemic years? The yearly PLFS reports provide some mixed answers.',
'metaKeywords' => 'Casual Workers,Female workers,Household Enterprises,Male workers,Periodic Labour Force Survey,PLFS,regular wage/salaried employee,Self Employed,Self-employed,Unpaid Helpers,Women workers',
'metaDesc' => 'Do you want a job that does not pay you at all? The answer will be surely &#39;no&#39; for most of us. And yet, in our previous analysis, it was found that the proportion of &#39;helpers in household enterprises&#39; among...',
'disp' => '<p style="text-align:justify">Do you want a job that does not pay you at all? The answer will be surely &#39;no&#39; for most of us. And yet, in our <a href="https://im4change.org/news-alerts-57/plfs-unemployment-rate-labour-force-participation-rate-worker-population-ratio-decent-work-social-security-quality-of-work-gainful-employment.html" title="https://im4change.org/news-alerts-57/plfs-unemployment-rate-labour-force-participation-rate-worker-population-ratio-decent-work-social-security-quality-of-work-gainful-employment.html">previous analysis</a>, it was found that the proportion of &#39;helpers in household enterprises&#39; among the total number of workers grew over various rounds of annual PLFS <em>(Periodic Labour Force Survey)</em>, from 13.3 percent to 15.9 percent between PLFS 2018-19 and PLFS 2019-20, and then soared further to 17.3 percent in PLFS 2020-21.&nbsp;</p><p style="text-align:justify">The most elemental question that comes to one&rsquo;s mind is which gender took up such unpaid, low-quality jobs during the pandemic years and whether there was a rural-urban divide noticed in that trend.&nbsp;</p><p style="text-align:justify">Without further ado, it needs to be mentioned here that from table-15 of each of the annual PLFS reports <em>(please click <a href="https://im4change.org/upload/files/Annual%20Report%20PLFS%202020-21.pdf" title="https://im4change.org/upload/files/Annual%20Report%20PLFS%202020-21.pdf">here</a>, <a href="https://im4change.org/upload/files/Annual_Report_PLFS_2019_20.pdf" title="https://im4change.org/upload/files/Annual_Report_PLFS_2019_20.pdf">here</a>, <a href="https://im4change.org/docs/annual-report-on-periodic-labour-force-survey-july-2018-june-2019.pdf" title="https://im4change.org/docs/annual-report-on-periodic-labour-force-survey-july-2018-june-2019.pdf">here</a> and <a href="https://im4change.org/docs/216Annual_Report_PLFS_2017_18_31052019.pdf" title="https://im4change.org/docs/216Annual_Report_PLFS_2017_18_31052019.pdf">here</a> to access)</em>, the proportion of male and female workers for various categories of work is extracted, and the data is presented as table-1 and table-2 in this analysis.</p><p style="text-align:justify">The categories of workers, which have been considered in the present news alert, are as follows:&nbsp;</p><p style="text-align:justify"><strong>Self-employed&nbsp;</strong></p><p style="text-align:justify">- Code 11: worked in household enterprises <em>(self-employed) </em>as own-account worker&nbsp;<br />- Code 12: worked in household enterprises <em>(self-employed) </em>as an employer<br />- Code 21: worked in household enterprises <em>(self-employed) </em>as helper&nbsp;</p><p style="text-align:justify"><strong>Regular/salaried&nbsp;</strong></p><p style="text-align:justify">- Code 31: worked as regular wage/salaried employee&nbsp;</p><p style="text-align:justify"><strong>Casual Workers&nbsp;</strong></p><p style="text-align:justify">- Code 41: worked as casual labour in public works other than MGNREG public works<br />- Code 51: worked as casual labour in other types of works</p><p style="text-align:justify"><strong>Not working but seeking/available for work <em>(or unemployed)</em></strong></p><p style="text-align:justify">- Code 81: sought work or did not seek but was available for work <em>(for usual status approach)</em>&nbsp;</p><p style="text-align:justify"><strong>Neither working nor available for work <em>(or not in labour force)</em>&nbsp;</strong></p><p style="text-align:justify">- Code 97: others <em>(including beggars, prostitutes, etc.)</em></p><p style="text-align:justify"><strong>---</strong></p><p style="text-align:justify">In rural areas, the proportion of usual status male workers as self-employed <em>(sum of own-account workers and employers in household enterprises) </em>increased over various rounds of annual PLFS, from 34.7&nbsp;percent in PLFS 2017-18 to 36.6 percent in PLFS 2020-21. In urban areas too, for the same category of self-employed, this proportion went up between PLFS 2018-19 and PLFS 2020-21. Please see table-1.</p><p style="text-align:justify"><strong>Table 1: Percentage of usual status workers in different categories of 15 years plus population: Male</strong></p><p style="text-align:justify"><img alt="" src="/upload/images/Table%201%20Percentage%20of%20usual%20status%20workers%20in%20different%20categories%20of%2015%20plus%20population%20Male.png" style="height:295px; width:860px" /></p><p style="text-align:justify"><em><strong>Source: </strong>Fourth Periodic Labour Force Survey Annual Report (July 2020-June 2021), please <a href="https://im4change.org/upload/files/Annual%20Report%20PLFS%202020-21.pdf" title="https://im4change.org/upload/files/Annual%20Report%20PLFS%202020-21.pdf">click here</a> to access &nbsp;</em></p><p style="text-align:justify"><em>Third Periodic Labour Force Survey Annual Report (July 2019-June 2020), please <a href="https://im4change.org/upload/files/Annual_Report_PLFS_2019_20.pdf" title="https://im4change.org/upload/files/Annual_Report_PLFS_2019_20.pdf">click here</a> to access &nbsp;</em></p><p style="text-align:justify"><em>Second Periodic Labour Force Survey Annual Report (July 2018-June 2019), please <a href="https://im4change.org/docs/annual-report-on-periodic-labour-force-survey-july-2018-june-2019.pdf" title="https://im4change.org/docs/annual-report-on-periodic-labour-force-survey-july-2018-june-2019.pdf">click here</a> to access &nbsp;</em></p><p style="text-align:justify"><em>First Periodic Labour Force Survey Annual Report (July 2017-June 2018), please <a href="https://im4change.org/docs/216Annual_Report_PLFS_2017_18_31052019.pdf" title="https://im4change.org/docs/216Annual_Report_PLFS_2017_18_31052019.pdf">click here</a> to access &nbsp;</em></p><p style="text-align:justify"><strong>---</strong></p><p style="text-align:justify">The proportion of usual status female workers as self-employed <em>(sum of own-account workers and employers in household enterprises) </em>climbed up over various rounds of annual PLFS, from 4.5 percent in PLFS 2017-18 to 7.9 percent in PLFS 2020-21. In urban areas too, for the same category of self-employed, this proportion went up between PLFS 2017-18 and PLFS 2020-21. Kindly take a look at table-2.</p><p style="text-align:justify"><strong>Table 2: Percentage of usual status workers in different categories of 15 years plus population: Female</strong></p><p style="text-align:justify"><img alt="" src="/upload/images/Table%202%20Percentage%20of%20usual%20status%20workers%20in%20different%20categories%20of%2015%20plus%20population%20Female.png" style="height:295px; width:861px" /></p><p style="text-align:justify"><em><strong>Source: </strong>Same as table-1</em><br /><strong>---</strong></p><p style="text-align:justify">As can be seen from table-1 of this analysis, although the proportion of usual status male workers as household enterprise helpers in rural areas came down slightly between PLFS 2017-18 and PLFS 2018-19, it gradually went up to 7.7&nbsp;percent in PLFS 2019-20, and further to 8.2&nbsp;percent in PLFS 2020-21.&nbsp;</p><p style="text-align:justify">In urban areas, after remaining unchanged for two successive rounds of annual PLFS, the proportion of usual status male workers as household enterprise helpers increased marginally to 3.1&nbsp;percent in PLFS 2020-21.&nbsp;</p><p style="text-align:justify"><span style="background-color:#ffcc00">In contrast to male workers, the proportion of usual status female workers as household enterprise helpers in rural areas increased over various rounds of annual PLFS, from 9.1 percent in PLFS 2017-18 to 15.3 percent in PLFS 2020-21. Between PLFS 2018-19 and PLFS 2019-20, there was a noticeable jump in the proportion of usual status female workers as household enterprise helpers in such areas. In rural areas, compared to its male counterpart, a higher proportion of usual status female workers worked as household enterprise helpers during each of the annual PLFS rounds, from PLFS 2017-18 to PLFS 2020-21.&nbsp;The gap between the proportion of usual status female workers as household enterprise helpers and that of its male counterpart in rural areas expanded from 2.1 percentage points (p.p.) to 7.1 p.p. between PLFS 2017-18 and PLFS 2020-21. Kindly compare table-1 against table-2.&nbsp;</span></p><p style="text-align:justify">In urban areas, the proportion of usual status female workers as household enterprise helpers increased over various rounds of annual PLFS, from 1.8 percent in PLFS 2018-19 to 2.6 percent in PLFS 2020-21.&nbsp;</p><p style="text-align:justify">In rural areas, the proportion of usual status male workers as regular/salaried workers remained almost the same between PLFS 2017-18 and PLFS 2020-21. However, the proportion of usual status male workers as regular/salaried workers decreased from 33.0 percent to 31.7 percent between PLFS 2019-20 and PLFS 2020-21 in urban areas. Please see table-1.</p><p style="text-align:justify">In rural areas, the proportion of usual status female workers as regular/salaried workers increased over various annual PLFS rounds, from 2.5 percent in PLFS 2017-18 to 3.3 percent in PLFS 2020-21. In urban areas, at first the proportion of usual status female workers as regular/salaried workers grew from 9.5 percent in PLFS 2017-18 to 11.5 percent in PLFS 2019-20, but then it dropped to 10.6 percent in PLFS 2020-21.</p><p style="text-align:justify">In rural areas, the proportion of usual status male workers who worked as casual labour in other types of works <em>(i.e., excluding public works as well as MGNREGA) </em>remained at around 20 percent in various annual PLFS rounds. For the same category of workers in urban areas, this proportion marginally rose from 9.6 percent in PLFS 2018-19 to 9.8 percent in PLFS 2019-20, and further to 10.3 percent in 2020-21. Kindly consult table-1.</p><p style="text-align:justify">In rural areas, the proportion of usual status female workers who worked as casual labour in other types of works <em>(i.e., excluding public works as well as MGNREGA) </em>increased from 6.6 percent to 8.3 percent between PLFS 2018-19 and PLFS 2020-21. For the same category of workers in urban areas, this proportion remained the same in PLFS 2019-20 and PLFS 2020-21.&nbsp;Kindly look at table-2.</p><p style="text-align:justify">Please note&nbsp;that the&nbsp;<a href="https://im4change.org/upload/files/Annual%20Report%20PLFS%202020-21.pdf" title="https://im4change.org/upload/files/Annual%20Report%20PLFS%202020-21.pdf" title="https://im4change.org/upload/files/Annual%20Report%20PLFS%202020-21.pdf" title="https://im4change.org/upload/files/Annual%20Report%20PLFS%202020-21.pdf">Annual Report on PLFS 2020-2021</a>&nbsp;has also covered the period&nbsp;<em>(i.e., April-June, 2021)&nbsp;</em>when the state-wide lockdowns&nbsp;associated with the second wave of COVID-19&nbsp;were imposed. The&nbsp;<a href="https://im4change.org/upload/files/Annual_Report_PLFS_2019_20.pdf" title="https://im4change.org/upload/files/Annual_Report_PLFS_2019_20.pdf" title="https://im4change.org/upload/files/Annual_Report_PLFS_2019_20.pdf" title="https://im4change.org/upload/files/Annual_Report_PLFS_2019_20.pdf">Annual Report on PLFS 2019-20</a>&nbsp;too had covered the period&nbsp;<em>(i.e., April-June, 2020)</em>&nbsp;when the countrywide lockdown&nbsp;<em>(associated with the first year of the COVID-19 pandemic)&nbsp;</em>was imposed.&nbsp;</p><p style="text-align:justify"><em><strong>References</strong></em></p><p style="text-align:justify">Fourth Periodic Labour Force Survey Annual Report (July 2020-June 2021), released in June 2022, National Statistical Office (NSO), Ministry of Statistics and Programme Implementation (MoSPI), <a href="https://im4change.org/upload/files/Annual%20Report%20PLFS%202020-21.pdf" title="https://im4change.org/upload/files/Annual%20Report%20PLFS%202020-21.pdf">click here</a> to access &nbsp;</p><p style="text-align:justify">Third Periodic Labour Force Survey Annual Report (July 2019-June 2020), released in July 2021, National Statistical Office (NSO), Ministry of Statistics and Programme Implementation (MoSPI), please <a href="https://im4change.org/upload/files/Annual_Report_PLFS_2019_20.pdf" title="https://im4change.org/upload/files/Annual_Report_PLFS_2019_20.pdf">click here</a> to access &nbsp;</p><p style="text-align:justify">Second Periodic Labour Force Survey Annual Report (July 2018-June 2019), released in June 2020, National Statistical Office (NSO), Ministry of Statistics and Programme Implementation (MoSPI), please <a href="https://im4change.org/docs/annual-report-on-periodic-labour-force-survey-july-2018-june-2019.pdf" title="https://im4change.org/docs/annual-report-on-periodic-labour-force-survey-july-2018-june-2019.pdf">click here</a> to access &nbsp;</p><p style="text-align:justify">First Periodic Labour Force Survey Annual Report (July 2017-June 2018), released in May 2019, National Statistical Office (NSO), Ministry of Statistics and Programme Implementation (MoSPI), please <a href="https://im4change.org/docs/216Annual_Report_PLFS_2017_18_31052019.pdf" title="https://im4change.org/docs/216Annual_Report_PLFS_2017_18_31052019.pdf">click here</a> to access &nbsp;&nbsp;</p><p style="text-align:justify">News alert: Quality of work matters, and not just job creation, Inclusive Media for Change, Published on: Sep 26, 2022, please <a href="https://im4change.org/news-alerts-57/plfs-unemployment-rate-labour-force-participation-rate-worker-population-ratio-decent-work-social-security-quality-of-work-gainful-employment.html" title="https://im4change.org/news-alerts-57/plfs-unemployment-rate-labour-force-participation-rate-worker-population-ratio-decent-work-social-security-quality-of-work-gainful-employment.html">click here</a> to access</p><p style="text-align:justify">What&rsquo;s behind the &lsquo;improvement&rsquo; in employment situation in labour force survey report -PC Mohanan, ThePrint, 21 August, 2021, please <a href="https://theprint.in/opinion/what-is-behind-the-improvement-in-employment-situation/719674/" title="https://theprint.in/opinion/what-is-behind-the-improvement-in-employment-situation/719674/">click here</a> to access&nbsp;</p><p style="text-align:justify"><br /><strong>Image Courtesy: Inclusive Media for Change/ Himanshu Joshi</strong></p>',
'lang' => 'English',
'SITE_URL' => 'https://im4change.in/',
'site_title' => 'im4change',
'adminprix' => 'admin'
]
$article_current = object(App\Model\Entity\Article) {
'id' => (int) 63956,
'title' => 'How well did the women workers fare during the pandemic years? The yearly PLFS reports provide some mixed answers.',
'subheading' => null,
'description' => '<p style="text-align:justify">Do you want a job that does not pay you at all? The answer will be surely &#39;no&#39; for most of us. And yet, in our <a href="https://im4change.org/news-alerts-57/plfs-unemployment-rate-labour-force-participation-rate-worker-population-ratio-decent-work-social-security-quality-of-work-gainful-employment.html">previous analysis</a>, it was found that the proportion of &#39;helpers in household enterprises&#39; among the total number of workers grew over various rounds of annual PLFS <em>(Periodic Labour Force Survey)</em>, from 13.3 percent to 15.9 percent between PLFS 2018-19 and PLFS 2019-20, and then soared further to 17.3 percent in PLFS 2020-21.&nbsp;</p>
<p style="text-align:justify">The most elemental question that comes to one&rsquo;s mind is which gender took up such unpaid, low-quality jobs during the pandemic years and whether there was a rural-urban divide noticed in that trend.&nbsp;</p>
<p style="text-align:justify">Without further ado, it needs to be mentioned here that from table-15 of each of the annual PLFS reports <em>(please click <a href="https://im4change.org/upload/files/Annual%20Report%20PLFS%202020-21.pdf">here</a>, <a href="https://im4change.org/upload/files/Annual_Report_PLFS_2019_20.pdf">here</a>, <a href="https://im4change.org/docs/annual-report-on-periodic-labour-force-survey-july-2018-june-2019.pdf">here</a> and <a href="https://im4change.org/docs/216Annual_Report_PLFS_2017_18_31052019.pdf">here</a> to access)</em>, the proportion of male and female workers for various categories of work is extracted, and the data is presented as table-1 and table-2 in this analysis.</p>
<p style="text-align:justify">The categories of workers, which have been considered in the present news alert, are as follows:&nbsp;</p>
<p style="text-align:justify"><strong>Self-employed&nbsp;</strong></p>
<p style="text-align:justify">- Code 11: worked in household enterprises <em>(self-employed) </em>as own-account worker&nbsp;<br />
- Code 12: worked in household enterprises <em>(self-employed) </em>as an employer<br />
- Code 21: worked in household enterprises <em>(self-employed) </em>as helper&nbsp;</p>
<p style="text-align:justify"><strong>Regular/salaried&nbsp;</strong></p>
<p style="text-align:justify">- Code 31: worked as regular wage/salaried employee&nbsp;</p>
<p style="text-align:justify"><strong>Casual Workers&nbsp;</strong></p>
<p style="text-align:justify">- Code 41: worked as casual labour in public works other than MGNREG public works<br />
- Code 51: worked as casual labour in other types of works</p>
<p style="text-align:justify"><strong>Not working but seeking/available for work <em>(or unemployed)</em></strong></p>
<p style="text-align:justify">- Code 81: sought work or did not seek but was available for work <em>(for usual status approach)</em>&nbsp;</p>
<p style="text-align:justify"><strong>Neither working nor available for work <em>(or not in labour force)</em>&nbsp;</strong></p>
<p style="text-align:justify">- Code 97: others <em>(including beggars, prostitutes, etc.)</em></p>
<p style="text-align:justify"><strong>---</strong></p>
<p style="text-align:justify">In rural areas, the proportion of usual status male workers as self-employed <em>(sum of own-account workers and employers in household enterprises) </em>increased over various rounds of annual PLFS, from 34.7&nbsp;percent in PLFS 2017-18 to 36.6 percent in PLFS 2020-21. In urban areas too, for the same category of self-employed, this proportion went up between PLFS 2018-19 and PLFS 2020-21. Please see table-1.</p>
<p style="text-align:justify"><strong>Table 1: Percentage of usual status workers in different categories of 15 years plus population: Male</strong></p>
<p style="text-align:justify"><img alt="" src="/upload/images/Table%201%20Percentage%20of%20usual%20status%20workers%20in%20different%20categories%20of%2015%20plus%20population%20Male.png" style="height:295px; width:860px" /></p>
<p style="text-align:justify"><em><strong>Source: </strong>Fourth Periodic Labour Force Survey Annual Report (July 2020-June 2021), please <a href="https://im4change.org/upload/files/Annual%20Report%20PLFS%202020-21.pdf">click here</a> to access &nbsp;</em></p>
<p style="text-align:justify"><em>Third Periodic Labour Force Survey Annual Report (July 2019-June 2020), please <a href="https://im4change.org/upload/files/Annual_Report_PLFS_2019_20.pdf ">click here</a> to access &nbsp;</em></p>
<p style="text-align:justify"><em>Second Periodic Labour Force Survey Annual Report (July 2018-June 2019), please <a href="https://im4change.org/docs/annual-report-on-periodic-labour-force-survey-july-2018-june-2019.pdf ">click here</a> to access &nbsp;</em></p>
<p style="text-align:justify"><em>First Periodic Labour Force Survey Annual Report (July 2017-June 2018), please <a href="https://im4change.org/docs/216Annual_Report_PLFS_2017_18_31052019.pdf ">click here</a> to access &nbsp;</em></p>
<p style="text-align:justify"><strong>---</strong></p>
<p style="text-align:justify">The proportion of usual status female workers as self-employed <em>(sum of own-account workers and employers in household enterprises) </em>climbed up over various rounds of annual PLFS, from 4.5 percent in PLFS 2017-18 to 7.9 percent in PLFS 2020-21. In urban areas too, for the same category of self-employed, this proportion went up between PLFS 2017-18 and PLFS 2020-21. Kindly take a look at table-2.</p>
<p style="text-align:justify"><strong>Table 2: Percentage of usual status workers in different categories of 15 years plus population: Female</strong></p>
<p style="text-align:justify"><img alt="" src="/upload/images/Table%202%20Percentage%20of%20usual%20status%20workers%20in%20different%20categories%20of%2015%20plus%20population%20Female.png" style="height:295px; width:861px" /></p>
<p style="text-align:justify"><em><strong>Source: </strong>Same as table-1</em><br />
<strong>---</strong></p>
<p style="text-align:justify">As can be seen from table-1 of this analysis, although the proportion of usual status male workers as household enterprise helpers in rural areas came down slightly between PLFS 2017-18 and PLFS 2018-19, it gradually went up to 7.7&nbsp;percent in PLFS 2019-20, and further to 8.2&nbsp;percent in PLFS 2020-21.&nbsp;</p>
<p style="text-align:justify">In urban areas, after remaining unchanged for two successive rounds of annual PLFS, the proportion of usual status male workers as household enterprise helpers increased marginally to 3.1&nbsp;percent in PLFS 2020-21.&nbsp;</p>
<p style="text-align:justify"><span style="background-color:#ffcc00">In contrast to male workers, the proportion of usual status female workers as household enterprise helpers in rural areas increased over various rounds of annual PLFS, from 9.1 percent in PLFS 2017-18 to 15.3 percent in PLFS 2020-21. Between PLFS 2018-19 and PLFS 2019-20, there was a noticeable jump in the proportion of usual status female workers as household enterprise helpers in such areas. In rural areas, compared to its male counterpart, a higher proportion of usual status female workers worked as household enterprise helpers during each of the annual PLFS rounds, from PLFS 2017-18 to PLFS 2020-21.&nbsp;The gap between the proportion of usual status female workers as household enterprise helpers and that of its male counterpart in rural areas expanded from 2.1 percentage points (p.p.) to 7.1 p.p. between PLFS 2017-18 and PLFS 2020-21. Kindly compare table-1 against table-2.&nbsp;</span></p>
<p style="text-align:justify">In urban areas, the proportion of usual status female workers as household enterprise helpers increased over various rounds of annual PLFS, from 1.8 percent in PLFS 2018-19 to 2.6 percent in PLFS 2020-21.&nbsp;</p>
<p style="text-align:justify">In rural areas, the proportion of usual status male workers as regular/salaried workers remained almost the same between PLFS 2017-18 and PLFS 2020-21. However, the proportion of usual status male workers as regular/salaried workers decreased from 33.0 percent to 31.7 percent between PLFS 2019-20 and PLFS 2020-21 in urban areas. Please see table-1.</p>
<p style="text-align:justify">In rural areas, the proportion of usual status female workers as regular/salaried workers increased over various annual PLFS rounds, from 2.5 percent in PLFS 2017-18 to 3.3 percent in PLFS 2020-21. In urban areas, at first the proportion of usual status female workers as regular/salaried workers grew from 9.5 percent in PLFS 2017-18 to 11.5 percent in PLFS 2019-20, but then it dropped to 10.6 percent in PLFS 2020-21.</p>
<p style="text-align:justify">In rural areas, the proportion of usual status male workers who worked as casual labour in other types of works <em>(i.e., excluding public works as well as MGNREGA) </em>remained at around 20 percent in various annual PLFS rounds. For the same category of workers in urban areas, this proportion marginally rose from 9.6 percent in PLFS 2018-19 to 9.8 percent in PLFS 2019-20, and further to 10.3 percent in 2020-21. Kindly consult table-1.</p>
<p style="text-align:justify">In rural areas, the proportion of usual status female workers who worked as casual labour in other types of works <em>(i.e., excluding public works as well as MGNREGA) </em>increased from 6.6 percent to 8.3 percent between PLFS 2018-19 and PLFS 2020-21. For the same category of workers in urban areas, this proportion remained the same in PLFS 2019-20 and PLFS 2020-21.&nbsp;Kindly look at table-2.</p>
<p style="text-align:justify">Please note&nbsp;that the&nbsp;<a href="https://im4change.org/upload/files/Annual%20Report%20PLFS%202020-21.pdf" title="https://im4change.org/upload/files/Annual%20Report%20PLFS%202020-21.pdf">Annual Report on PLFS 2020-2021</a>&nbsp;has also covered the period&nbsp;<em>(i.e., April-June, 2021)&nbsp;</em>when the state-wide lockdowns&nbsp;associated with the second wave of COVID-19&nbsp;were imposed. The&nbsp;<a href="https://im4change.org/upload/files/Annual_Report_PLFS_2019_20.pdf" title="https://im4change.org/upload/files/Annual_Report_PLFS_2019_20.pdf">Annual Report on PLFS 2019-20</a>&nbsp;too had covered the period&nbsp;<em>(i.e., April-June, 2020)</em>&nbsp;when the countrywide lockdown&nbsp;<em>(associated with the first year of the COVID-19 pandemic)&nbsp;</em>was imposed.&nbsp;</p>
<p style="text-align:justify"><em><strong>References</strong></em></p>
<p style="text-align:justify">Fourth Periodic Labour Force Survey Annual Report (July 2020-June 2021), released in June 2022, National Statistical Office (NSO), Ministry of Statistics and Programme Implementation (MoSPI), <a href="https://im4change.org/upload/files/Annual%20Report%20PLFS%202020-21.pdf">click here</a> to access &nbsp;</p>
<p style="text-align:justify">Third Periodic Labour Force Survey Annual Report (July 2019-June 2020), released in July 2021, National Statistical Office (NSO), Ministry of Statistics and Programme Implementation (MoSPI), please <a href="https://im4change.org/upload/files/Annual_Report_PLFS_2019_20.pdf ">click here</a> to access &nbsp;</p>
<p style="text-align:justify">Second Periodic Labour Force Survey Annual Report (July 2018-June 2019), released in June 2020, National Statistical Office (NSO), Ministry of Statistics and Programme Implementation (MoSPI), please <a href="https://im4change.org/docs/annual-report-on-periodic-labour-force-survey-july-2018-june-2019.pdf ">click here</a> to access &nbsp;</p>
<p style="text-align:justify">First Periodic Labour Force Survey Annual Report (July 2017-June 2018), released in May 2019, National Statistical Office (NSO), Ministry of Statistics and Programme Implementation (MoSPI), please <a href="https://im4change.org/docs/216Annual_Report_PLFS_2017_18_31052019.pdf ">click here</a> to access &nbsp;&nbsp;</p>
<p style="text-align:justify">News alert: Quality of work matters, and not just job creation, Inclusive Media for Change, Published on: Sep 26, 2022, please <a href="https://im4change.org/news-alerts-57/plfs-unemployment-rate-labour-force-participation-rate-worker-population-ratio-decent-work-social-security-quality-of-work-gainful-employment.html">click here</a> to access</p>
<p style="text-align:justify">What&rsquo;s behind the &lsquo;improvement&rsquo; in employment situation in labour force survey report -PC Mohanan, ThePrint, 21 August, 2021, please <a href="https://theprint.in/opinion/what-is-behind-the-improvement-in-employment-situation/719674/ ">click here</a> to access&nbsp;</p>
<p style="text-align:justify"><br />
<strong>Image Courtesy: Inclusive Media for Change/ Himanshu Joshi</strong></p>
',
'credit_writer' => '',
'article_img' => 'Image Employment dated 7 Oct 2022.jpg',
'article_img_thumb' => 'Image Employment dated 7 Oct 2022.jpg',
'status' => (int) 1,
'show_on_home' => (int) 1,
'lang' => 'EN',
'category_id' => (int) 4,
'tag_keyword' => '',
'seo_url' => 'how-well-did-the-women-worker-fare-during-the-pandemic-years-plfs-reports-provide-some-mixed-answers-casual-workers-self-employed-unpaid-helpers-family-enterprises-regular-wage-salaried',
'meta_title' => '',
'meta_keywords' => '',
'meta_description' => '',
'noindex' => (int) 1,
'publish_date' => object(Cake\I18n\FrozenDate) {},
'most_visit_section_id' => null,
'article_big_img' => null,
'liveid' => null,
'created' => object(Cake\I18n\FrozenTime) {},
'modified' => object(Cake\I18n\FrozenTime) {},
'edate' => '',
'tags' => [
(int) 0 => object(Cake\ORM\Entity) {},
(int) 1 => object(Cake\ORM\Entity) {},
(int) 2 => object(Cake\ORM\Entity) {},
(int) 3 => object(Cake\ORM\Entity) {},
(int) 4 => object(Cake\ORM\Entity) {},
(int) 5 => object(Cake\ORM\Entity) {},
(int) 6 => object(Cake\ORM\Entity) {},
(int) 7 => object(Cake\ORM\Entity) {},
(int) 8 => object(Cake\ORM\Entity) {},
(int) 9 => object(Cake\ORM\Entity) {},
(int) 10 => object(Cake\ORM\Entity) {}
],
'category' => object(App\Model\Entity\Category) {},
'[new]' => false,
'[accessible]' => [
'*' => true,
'id' => false
],
'[dirty]' => [],
'[original]' => [],
'[virtual]' => [],
'[hasErrors]' => false,
'[errors]' => [],
'[invalid]' => [],
'[repository]' => 'Articles'
}
$articleid = (int) 63956
$metaTitle = 'NEWS ALERTS | How well did the women workers fare during the pandemic years? The yearly PLFS reports provide some mixed answers.'
$metaKeywords = 'Casual Workers,Female workers,Household Enterprises,Male workers,Periodic Labour Force Survey,PLFS,regular wage/salaried employee,Self Employed,Self-employed,Unpaid Helpers,Women workers'
$metaDesc = 'Do you want a job that does not pay you at all? The answer will be surely &#39;no&#39; for most of us. And yet, in our previous analysis, it was found that the proportion of &#39;helpers in household enterprises&#39; among...'
$disp = '<p style="text-align:justify">Do you want a job that does not pay you at all? The answer will be surely &#39;no&#39; for most of us. And yet, in our <a href="https://im4change.org/news-alerts-57/plfs-unemployment-rate-labour-force-participation-rate-worker-population-ratio-decent-work-social-security-quality-of-work-gainful-employment.html" title="https://im4change.org/news-alerts-57/plfs-unemployment-rate-labour-force-participation-rate-worker-population-ratio-decent-work-social-security-quality-of-work-gainful-employment.html">previous analysis</a>, it was found that the proportion of &#39;helpers in household enterprises&#39; among the total number of workers grew over various rounds of annual PLFS <em>(Periodic Labour Force Survey)</em>, from 13.3 percent to 15.9 percent between PLFS 2018-19 and PLFS 2019-20, and then soared further to 17.3 percent in PLFS 2020-21.&nbsp;</p><p style="text-align:justify">The most elemental question that comes to one&rsquo;s mind is which gender took up such unpaid, low-quality jobs during the pandemic years and whether there was a rural-urban divide noticed in that trend.&nbsp;</p><p style="text-align:justify">Without further ado, it needs to be mentioned here that from table-15 of each of the annual PLFS reports <em>(please click <a href="https://im4change.org/upload/files/Annual%20Report%20PLFS%202020-21.pdf" title="https://im4change.org/upload/files/Annual%20Report%20PLFS%202020-21.pdf">here</a>, <a href="https://im4change.org/upload/files/Annual_Report_PLFS_2019_20.pdf" title="https://im4change.org/upload/files/Annual_Report_PLFS_2019_20.pdf">here</a>, <a href="https://im4change.org/docs/annual-report-on-periodic-labour-force-survey-july-2018-june-2019.pdf" title="https://im4change.org/docs/annual-report-on-periodic-labour-force-survey-july-2018-june-2019.pdf">here</a> and <a href="https://im4change.org/docs/216Annual_Report_PLFS_2017_18_31052019.pdf" title="https://im4change.org/docs/216Annual_Report_PLFS_2017_18_31052019.pdf">here</a> to access)</em>, the proportion of male and female workers for various categories of work is extracted, and the data is presented as table-1 and table-2 in this analysis.</p><p style="text-align:justify">The categories of workers, which have been considered in the present news alert, are as follows:&nbsp;</p><p style="text-align:justify"><strong>Self-employed&nbsp;</strong></p><p style="text-align:justify">- Code 11: worked in household enterprises <em>(self-employed) </em>as own-account worker&nbsp;<br />- Code 12: worked in household enterprises <em>(self-employed) </em>as an employer<br />- Code 21: worked in household enterprises <em>(self-employed) </em>as helper&nbsp;</p><p style="text-align:justify"><strong>Regular/salaried&nbsp;</strong></p><p style="text-align:justify">- Code 31: worked as regular wage/salaried employee&nbsp;</p><p style="text-align:justify"><strong>Casual Workers&nbsp;</strong></p><p style="text-align:justify">- Code 41: worked as casual labour in public works other than MGNREG public works<br />- Code 51: worked as casual labour in other types of works</p><p style="text-align:justify"><strong>Not working but seeking/available for work <em>(or unemployed)</em></strong></p><p style="text-align:justify">- Code 81: sought work or did not seek but was available for work <em>(for usual status approach)</em>&nbsp;</p><p style="text-align:justify"><strong>Neither working nor available for work <em>(or not in labour force)</em>&nbsp;</strong></p><p style="text-align:justify">- Code 97: others <em>(including beggars, prostitutes, etc.)</em></p><p style="text-align:justify"><strong>---</strong></p><p style="text-align:justify">In rural areas, the proportion of usual status male workers as self-employed <em>(sum of own-account workers and employers in household enterprises) </em>increased over various rounds of annual PLFS, from 34.7&nbsp;percent in PLFS 2017-18 to 36.6 percent in PLFS 2020-21. In urban areas too, for the same category of self-employed, this proportion went up between PLFS 2018-19 and PLFS 2020-21. Please see table-1.</p><p style="text-align:justify"><strong>Table 1: Percentage of usual status workers in different categories of 15 years plus population: Male</strong></p><p style="text-align:justify"><img alt="" src="/upload/images/Table%201%20Percentage%20of%20usual%20status%20workers%20in%20different%20categories%20of%2015%20plus%20population%20Male.png" style="height:295px; width:860px" /></p><p style="text-align:justify"><em><strong>Source: </strong>Fourth Periodic Labour Force Survey Annual Report (July 2020-June 2021), please <a href="https://im4change.org/upload/files/Annual%20Report%20PLFS%202020-21.pdf" title="https://im4change.org/upload/files/Annual%20Report%20PLFS%202020-21.pdf">click here</a> to access &nbsp;</em></p><p style="text-align:justify"><em>Third Periodic Labour Force Survey Annual Report (July 2019-June 2020), please <a href="https://im4change.org/upload/files/Annual_Report_PLFS_2019_20.pdf" title="https://im4change.org/upload/files/Annual_Report_PLFS_2019_20.pdf">click here</a> to access &nbsp;</em></p><p style="text-align:justify"><em>Second Periodic Labour Force Survey Annual Report (July 2018-June 2019), please <a href="https://im4change.org/docs/annual-report-on-periodic-labour-force-survey-july-2018-june-2019.pdf" title="https://im4change.org/docs/annual-report-on-periodic-labour-force-survey-july-2018-june-2019.pdf">click here</a> to access &nbsp;</em></p><p style="text-align:justify"><em>First Periodic Labour Force Survey Annual Report (July 2017-June 2018), please <a href="https://im4change.org/docs/216Annual_Report_PLFS_2017_18_31052019.pdf" title="https://im4change.org/docs/216Annual_Report_PLFS_2017_18_31052019.pdf">click here</a> to access &nbsp;</em></p><p style="text-align:justify"><strong>---</strong></p><p style="text-align:justify">The proportion of usual status female workers as self-employed <em>(sum of own-account workers and employers in household enterprises) </em>climbed up over various rounds of annual PLFS, from 4.5 percent in PLFS 2017-18 to 7.9 percent in PLFS 2020-21. In urban areas too, for the same category of self-employed, this proportion went up between PLFS 2017-18 and PLFS 2020-21. Kindly take a look at table-2.</p><p style="text-align:justify"><strong>Table 2: Percentage of usual status workers in different categories of 15 years plus population: Female</strong></p><p style="text-align:justify"><img alt="" src="/upload/images/Table%202%20Percentage%20of%20usual%20status%20workers%20in%20different%20categories%20of%2015%20plus%20population%20Female.png" style="height:295px; width:861px" /></p><p style="text-align:justify"><em><strong>Source: </strong>Same as table-1</em><br /><strong>---</strong></p><p style="text-align:justify">As can be seen from table-1 of this analysis, although the proportion of usual status male workers as household enterprise helpers in rural areas came down slightly between PLFS 2017-18 and PLFS 2018-19, it gradually went up to 7.7&nbsp;percent in PLFS 2019-20, and further to 8.2&nbsp;percent in PLFS 2020-21.&nbsp;</p><p style="text-align:justify">In urban areas, after remaining unchanged for two successive rounds of annual PLFS, the proportion of usual status male workers as household enterprise helpers increased marginally to 3.1&nbsp;percent in PLFS 2020-21.&nbsp;</p><p style="text-align:justify"><span style="background-color:#ffcc00">In contrast to male workers, the proportion of usual status female workers as household enterprise helpers in rural areas increased over various rounds of annual PLFS, from 9.1 percent in PLFS 2017-18 to 15.3 percent in PLFS 2020-21. Between PLFS 2018-19 and PLFS 2019-20, there was a noticeable jump in the proportion of usual status female workers as household enterprise helpers in such areas. In rural areas, compared to its male counterpart, a higher proportion of usual status female workers worked as household enterprise helpers during each of the annual PLFS rounds, from PLFS 2017-18 to PLFS 2020-21.&nbsp;The gap between the proportion of usual status female workers as household enterprise helpers and that of its male counterpart in rural areas expanded from 2.1 percentage points (p.p.) to 7.1 p.p. between PLFS 2017-18 and PLFS 2020-21. Kindly compare table-1 against table-2.&nbsp;</span></p><p style="text-align:justify">In urban areas, the proportion of usual status female workers as household enterprise helpers increased over various rounds of annual PLFS, from 1.8 percent in PLFS 2018-19 to 2.6 percent in PLFS 2020-21.&nbsp;</p><p style="text-align:justify">In rural areas, the proportion of usual status male workers as regular/salaried workers remained almost the same between PLFS 2017-18 and PLFS 2020-21. However, the proportion of usual status male workers as regular/salaried workers decreased from 33.0 percent to 31.7 percent between PLFS 2019-20 and PLFS 2020-21 in urban areas. Please see table-1.</p><p style="text-align:justify">In rural areas, the proportion of usual status female workers as regular/salaried workers increased over various annual PLFS rounds, from 2.5 percent in PLFS 2017-18 to 3.3 percent in PLFS 2020-21. In urban areas, at first the proportion of usual status female workers as regular/salaried workers grew from 9.5 percent in PLFS 2017-18 to 11.5 percent in PLFS 2019-20, but then it dropped to 10.6 percent in PLFS 2020-21.</p><p style="text-align:justify">In rural areas, the proportion of usual status male workers who worked as casual labour in other types of works <em>(i.e., excluding public works as well as MGNREGA) </em>remained at around 20 percent in various annual PLFS rounds. For the same category of workers in urban areas, this proportion marginally rose from 9.6 percent in PLFS 2018-19 to 9.8 percent in PLFS 2019-20, and further to 10.3 percent in 2020-21. Kindly consult table-1.</p><p style="text-align:justify">In rural areas, the proportion of usual status female workers who worked as casual labour in other types of works <em>(i.e., excluding public works as well as MGNREGA) </em>increased from 6.6 percent to 8.3 percent between PLFS 2018-19 and PLFS 2020-21. For the same category of workers in urban areas, this proportion remained the same in PLFS 2019-20 and PLFS 2020-21.&nbsp;Kindly look at table-2.</p><p style="text-align:justify">Please note&nbsp;that the&nbsp;<a href="https://im4change.org/upload/files/Annual%20Report%20PLFS%202020-21.pdf" title="https://im4change.org/upload/files/Annual%20Report%20PLFS%202020-21.pdf" title="https://im4change.org/upload/files/Annual%20Report%20PLFS%202020-21.pdf" title="https://im4change.org/upload/files/Annual%20Report%20PLFS%202020-21.pdf">Annual Report on PLFS 2020-2021</a>&nbsp;has also covered the period&nbsp;<em>(i.e., April-June, 2021)&nbsp;</em>when the state-wide lockdowns&nbsp;associated with the second wave of COVID-19&nbsp;were imposed. The&nbsp;<a href="https://im4change.org/upload/files/Annual_Report_PLFS_2019_20.pdf" title="https://im4change.org/upload/files/Annual_Report_PLFS_2019_20.pdf" title="https://im4change.org/upload/files/Annual_Report_PLFS_2019_20.pdf" title="https://im4change.org/upload/files/Annual_Report_PLFS_2019_20.pdf">Annual Report on PLFS 2019-20</a>&nbsp;too had covered the period&nbsp;<em>(i.e., April-June, 2020)</em>&nbsp;when the countrywide lockdown&nbsp;<em>(associated with the first year of the COVID-19 pandemic)&nbsp;</em>was imposed.&nbsp;</p><p style="text-align:justify"><em><strong>References</strong></em></p><p style="text-align:justify">Fourth Periodic Labour Force Survey Annual Report (July 2020-June 2021), released in June 2022, National Statistical Office (NSO), Ministry of Statistics and Programme Implementation (MoSPI), <a href="https://im4change.org/upload/files/Annual%20Report%20PLFS%202020-21.pdf" title="https://im4change.org/upload/files/Annual%20Report%20PLFS%202020-21.pdf">click here</a> to access &nbsp;</p><p style="text-align:justify">Third Periodic Labour Force Survey Annual Report (July 2019-June 2020), released in July 2021, National Statistical Office (NSO), Ministry of Statistics and Programme Implementation (MoSPI), please <a href="https://im4change.org/upload/files/Annual_Report_PLFS_2019_20.pdf" title="https://im4change.org/upload/files/Annual_Report_PLFS_2019_20.pdf">click here</a> to access &nbsp;</p><p style="text-align:justify">Second Periodic Labour Force Survey Annual Report (July 2018-June 2019), released in June 2020, National Statistical Office (NSO), Ministry of Statistics and Programme Implementation (MoSPI), please <a href="https://im4change.org/docs/annual-report-on-periodic-labour-force-survey-july-2018-june-2019.pdf" title="https://im4change.org/docs/annual-report-on-periodic-labour-force-survey-july-2018-june-2019.pdf">click here</a> to access &nbsp;</p><p style="text-align:justify">First Periodic Labour Force Survey Annual Report (July 2017-June 2018), released in May 2019, National Statistical Office (NSO), Ministry of Statistics and Programme Implementation (MoSPI), please <a href="https://im4change.org/docs/216Annual_Report_PLFS_2017_18_31052019.pdf" title="https://im4change.org/docs/216Annual_Report_PLFS_2017_18_31052019.pdf">click here</a> to access &nbsp;&nbsp;</p><p style="text-align:justify">News alert: Quality of work matters, and not just job creation, Inclusive Media for Change, Published on: Sep 26, 2022, please <a href="https://im4change.org/news-alerts-57/plfs-unemployment-rate-labour-force-participation-rate-worker-population-ratio-decent-work-social-security-quality-of-work-gainful-employment.html" title="https://im4change.org/news-alerts-57/plfs-unemployment-rate-labour-force-participation-rate-worker-population-ratio-decent-work-social-security-quality-of-work-gainful-employment.html">click here</a> to access</p><p style="text-align:justify">What&rsquo;s behind the &lsquo;improvement&rsquo; in employment situation in labour force survey report -PC Mohanan, ThePrint, 21 August, 2021, please <a href="https://theprint.in/opinion/what-is-behind-the-improvement-in-employment-situation/719674/" title="https://theprint.in/opinion/what-is-behind-the-improvement-in-employment-situation/719674/">click here</a> to access&nbsp;</p><p style="text-align:justify"><br /><strong>Image Courtesy: Inclusive Media for Change/ Himanshu Joshi</strong></p>'
$lang = 'English'
$SITE_URL = 'https://im4change.in/'
$site_title = 'im4change'
$adminprix = 'admin'</pre><pre class="stack-trace">include - APP/Template/Layout/printlayout.ctp, line 8
Cake\View\View::_evaluate() - CORE/src/View/View.php, line 1413
Cake\View\View::_render() - CORE/src/View/View.php, line 1374
Cake\View\View::renderLayout() - CORE/src/View/View.php, line 927
Cake\View\View::render() - CORE/src/View/View.php, line 885
Cake\Controller\Controller::render() - CORE/src/Controller/Controller.php, line 791
Cake\Http\ActionDispatcher::_invoke() - CORE/src/Http/ActionDispatcher.php, line 126
Cake\Http\ActionDispatcher::dispatch() - CORE/src/Http/ActionDispatcher.php, line 94
Cake\Http\BaseApplication::__invoke() - CORE/src/Http/BaseApplication.php, line 235
Cake\Http\Runner::__invoke() - CORE/src/Http/Runner.php, line 65
Cake\Routing\Middleware\RoutingMiddleware::__invoke() - CORE/src/Routing/Middleware/RoutingMiddleware.php, line 162
Cake\Http\Runner::__invoke() - CORE/src/Http/Runner.php, line 65
Cake\Routing\Middleware\AssetMiddleware::__invoke() - CORE/src/Routing/Middleware/AssetMiddleware.php, line 88
Cake\Http\Runner::__invoke() - CORE/src/Http/Runner.php, line 65
Cake\Error\Middleware\ErrorHandlerMiddleware::__invoke() - CORE/src/Error/Middleware/ErrorHandlerMiddleware.php, line 96
Cake\Http\Runner::__invoke() - CORE/src/Http/Runner.php, line 65
Cake\Http\Runner::run() - CORE/src/Http/Runner.php, line 51</pre></div></pre>news-alerts-57/how-well-did-the-women-worker-fare-during-the-pandemic-years-plfs-reports-provide-some-mixed-answers-casual-workers-self-employed-unpaid-helpers-family-enterprises-regular-wage-salaried.html"/>
<meta http-equiv="Content-Type" content="text/html; charset=utf-8"/>
<link href="https://im4change.in/css/control.css" rel="stylesheet" type="text/css"
media="all"/>
<title>NEWS ALERTS | How well did the women workers fare during the pandemic years? The yearly PLFS reports provide some mixed answers. | Im4change.org</title>
<meta name="description" content="Do you want a job that does not pay you at all? The answer will be surely 'no' for most of us. And yet, in our previous analysis, it was found that the proportion of 'helpers in household enterprises' among..."/>
<script src="https://im4change.in/js/jquery-1.10.2.js"></script>
<script type="text/javascript" src="https://im4change.in/js/jquery-migrate.min.js"></script>
<script language="javascript" type="text/javascript">
$(document).ready(function () {
var img = $("img")[0]; // Get my img elem
var pic_real_width, pic_real_height;
$("<img/>") // Make in memory copy of image to avoid css issues
.attr("src", $(img).attr("src"))
.load(function () {
pic_real_width = this.width; // Note: $(this).width() will not
pic_real_height = this.height; // work for in memory images.
});
});
</script>
<style type="text/css">
@media screen {
div.divFooter {
display: block;
}
}
@media print {
.printbutton {
display: none !important;
}
}
</style>
</head>
<body>
<table cellpadding="0" cellspacing="0" border="0" width="98%" align="center">
<tr>
<td class="top_bg">
<div class="divFooter">
<img src="https://im4change.in/images/logo1.jpg" height="59" border="0"
alt="Resource centre on India's rural distress" style="padding-top:14px;"/>
</div>
</td>
</tr>
<tr>
<td id="topspace"> </td>
</tr>
<tr id="topspace">
<td> </td>
</tr>
<tr>
<td height="50" style="border-bottom:1px solid #000; padding-top:10px;" class="printbutton">
<form><input type="button" value=" Print this page "
onclick="window.print();return false;"/></form>
</td>
</tr>
<tr>
<td width="100%">
<h1 class="news_headlines" style="font-style:normal">
<strong>How well did the women workers fare during the pandemic years? The yearly PLFS reports provide some mixed answers.</strong></h1>
</td>
</tr>
<tr>
<td width="100%" style="font-family:Arial, 'Segoe Script', 'Segoe UI', sans-serif, serif"><font size="3">
<p style="text-align:justify">Do you want a job that does not pay you at all? The answer will be surely 'no' for most of us. And yet, in our <a href="https://im4change.org/news-alerts-57/plfs-unemployment-rate-labour-force-participation-rate-worker-population-ratio-decent-work-social-security-quality-of-work-gainful-employment.html" title="https://im4change.org/news-alerts-57/plfs-unemployment-rate-labour-force-participation-rate-worker-population-ratio-decent-work-social-security-quality-of-work-gainful-employment.html">previous analysis</a>, it was found that the proportion of 'helpers in household enterprises' among the total number of workers grew over various rounds of annual PLFS <em>(Periodic Labour Force Survey)</em>, from 13.3 percent to 15.9 percent between PLFS 2018-19 and PLFS 2019-20, and then soared further to 17.3 percent in PLFS 2020-21. </p><p style="text-align:justify">The most elemental question that comes to one’s mind is which gender took up such unpaid, low-quality jobs during the pandemic years and whether there was a rural-urban divide noticed in that trend. </p><p style="text-align:justify">Without further ado, it needs to be mentioned here that from table-15 of each of the annual PLFS reports <em>(please click <a href="https://im4change.org/upload/files/Annual%20Report%20PLFS%202020-21.pdf" title="https://im4change.org/upload/files/Annual%20Report%20PLFS%202020-21.pdf">here</a>, <a href="https://im4change.org/upload/files/Annual_Report_PLFS_2019_20.pdf" title="https://im4change.org/upload/files/Annual_Report_PLFS_2019_20.pdf">here</a>, <a href="https://im4change.org/docs/annual-report-on-periodic-labour-force-survey-july-2018-june-2019.pdf" title="https://im4change.org/docs/annual-report-on-periodic-labour-force-survey-july-2018-june-2019.pdf">here</a> and <a href="https://im4change.org/docs/216Annual_Report_PLFS_2017_18_31052019.pdf" title="https://im4change.org/docs/216Annual_Report_PLFS_2017_18_31052019.pdf">here</a> to access)</em>, the proportion of male and female workers for various categories of work is extracted, and the data is presented as table-1 and table-2 in this analysis.</p><p style="text-align:justify">The categories of workers, which have been considered in the present news alert, are as follows: </p><p style="text-align:justify"><strong>Self-employed </strong></p><p style="text-align:justify">- Code 11: worked in household enterprises <em>(self-employed) </em>as own-account worker <br />- Code 12: worked in household enterprises <em>(self-employed) </em>as an employer<br />- Code 21: worked in household enterprises <em>(self-employed) </em>as helper </p><p style="text-align:justify"><strong>Regular/salaried </strong></p><p style="text-align:justify">- Code 31: worked as regular wage/salaried employee </p><p style="text-align:justify"><strong>Casual Workers </strong></p><p style="text-align:justify">- Code 41: worked as casual labour in public works other than MGNREG public works<br />- Code 51: worked as casual labour in other types of works</p><p style="text-align:justify"><strong>Not working but seeking/available for work <em>(or unemployed)</em></strong></p><p style="text-align:justify">- Code 81: sought work or did not seek but was available for work <em>(for usual status approach)</em> </p><p style="text-align:justify"><strong>Neither working nor available for work <em>(or not in labour force)</em> </strong></p><p style="text-align:justify">- Code 97: others <em>(including beggars, prostitutes, etc.)</em></p><p style="text-align:justify"><strong>---</strong></p><p style="text-align:justify">In rural areas, the proportion of usual status male workers as self-employed <em>(sum of own-account workers and employers in household enterprises) </em>increased over various rounds of annual PLFS, from 34.7 percent in PLFS 2017-18 to 36.6 percent in PLFS 2020-21. In urban areas too, for the same category of self-employed, this proportion went up between PLFS 2018-19 and PLFS 2020-21. Please see table-1.</p><p style="text-align:justify"><strong>Table 1: Percentage of usual status workers in different categories of 15 years plus population: Male</strong></p><p style="text-align:justify"><img alt="" src="/upload/images/Table%201%20Percentage%20of%20usual%20status%20workers%20in%20different%20categories%20of%2015%20plus%20population%20Male.png" style="height:295px; width:860px" /></p><p style="text-align:justify"><em><strong>Source: </strong>Fourth Periodic Labour Force Survey Annual Report (July 2020-June 2021), please <a href="https://im4change.org/upload/files/Annual%20Report%20PLFS%202020-21.pdf" title="https://im4change.org/upload/files/Annual%20Report%20PLFS%202020-21.pdf">click here</a> to access </em></p><p style="text-align:justify"><em>Third Periodic Labour Force Survey Annual Report (July 2019-June 2020), please <a href="https://im4change.org/upload/files/Annual_Report_PLFS_2019_20.pdf" title="https://im4change.org/upload/files/Annual_Report_PLFS_2019_20.pdf">click here</a> to access </em></p><p style="text-align:justify"><em>Second Periodic Labour Force Survey Annual Report (July 2018-June 2019), please <a href="https://im4change.org/docs/annual-report-on-periodic-labour-force-survey-july-2018-june-2019.pdf" title="https://im4change.org/docs/annual-report-on-periodic-labour-force-survey-july-2018-june-2019.pdf">click here</a> to access </em></p><p style="text-align:justify"><em>First Periodic Labour Force Survey Annual Report (July 2017-June 2018), please <a href="https://im4change.org/docs/216Annual_Report_PLFS_2017_18_31052019.pdf" title="https://im4change.org/docs/216Annual_Report_PLFS_2017_18_31052019.pdf">click here</a> to access </em></p><p style="text-align:justify"><strong>---</strong></p><p style="text-align:justify">The proportion of usual status female workers as self-employed <em>(sum of own-account workers and employers in household enterprises) </em>climbed up over various rounds of annual PLFS, from 4.5 percent in PLFS 2017-18 to 7.9 percent in PLFS 2020-21. In urban areas too, for the same category of self-employed, this proportion went up between PLFS 2017-18 and PLFS 2020-21. Kindly take a look at table-2.</p><p style="text-align:justify"><strong>Table 2: Percentage of usual status workers in different categories of 15 years plus population: Female</strong></p><p style="text-align:justify"><img alt="" src="/upload/images/Table%202%20Percentage%20of%20usual%20status%20workers%20in%20different%20categories%20of%2015%20plus%20population%20Female.png" style="height:295px; width:861px" /></p><p style="text-align:justify"><em><strong>Source: </strong>Same as table-1</em><br /><strong>---</strong></p><p style="text-align:justify">As can be seen from table-1 of this analysis, although the proportion of usual status male workers as household enterprise helpers in rural areas came down slightly between PLFS 2017-18 and PLFS 2018-19, it gradually went up to 7.7 percent in PLFS 2019-20, and further to 8.2 percent in PLFS 2020-21. </p><p style="text-align:justify">In urban areas, after remaining unchanged for two successive rounds of annual PLFS, the proportion of usual status male workers as household enterprise helpers increased marginally to 3.1 percent in PLFS 2020-21. </p><p style="text-align:justify"><span style="background-color:#ffcc00">In contrast to male workers, the proportion of usual status female workers as household enterprise helpers in rural areas increased over various rounds of annual PLFS, from 9.1 percent in PLFS 2017-18 to 15.3 percent in PLFS 2020-21. Between PLFS 2018-19 and PLFS 2019-20, there was a noticeable jump in the proportion of usual status female workers as household enterprise helpers in such areas. In rural areas, compared to its male counterpart, a higher proportion of usual status female workers worked as household enterprise helpers during each of the annual PLFS rounds, from PLFS 2017-18 to PLFS 2020-21. The gap between the proportion of usual status female workers as household enterprise helpers and that of its male counterpart in rural areas expanded from 2.1 percentage points (p.p.) to 7.1 p.p. between PLFS 2017-18 and PLFS 2020-21. Kindly compare table-1 against table-2. </span></p><p style="text-align:justify">In urban areas, the proportion of usual status female workers as household enterprise helpers increased over various rounds of annual PLFS, from 1.8 percent in PLFS 2018-19 to 2.6 percent in PLFS 2020-21. </p><p style="text-align:justify">In rural areas, the proportion of usual status male workers as regular/salaried workers remained almost the same between PLFS 2017-18 and PLFS 2020-21. However, the proportion of usual status male workers as regular/salaried workers decreased from 33.0 percent to 31.7 percent between PLFS 2019-20 and PLFS 2020-21 in urban areas. Please see table-1.</p><p style="text-align:justify">In rural areas, the proportion of usual status female workers as regular/salaried workers increased over various annual PLFS rounds, from 2.5 percent in PLFS 2017-18 to 3.3 percent in PLFS 2020-21. In urban areas, at first the proportion of usual status female workers as regular/salaried workers grew from 9.5 percent in PLFS 2017-18 to 11.5 percent in PLFS 2019-20, but then it dropped to 10.6 percent in PLFS 2020-21.</p><p style="text-align:justify">In rural areas, the proportion of usual status male workers who worked as casual labour in other types of works <em>(i.e., excluding public works as well as MGNREGA) </em>remained at around 20 percent in various annual PLFS rounds. For the same category of workers in urban areas, this proportion marginally rose from 9.6 percent in PLFS 2018-19 to 9.8 percent in PLFS 2019-20, and further to 10.3 percent in 2020-21. Kindly consult table-1.</p><p style="text-align:justify">In rural areas, the proportion of usual status female workers who worked as casual labour in other types of works <em>(i.e., excluding public works as well as MGNREGA) </em>increased from 6.6 percent to 8.3 percent between PLFS 2018-19 and PLFS 2020-21. For the same category of workers in urban areas, this proportion remained the same in PLFS 2019-20 and PLFS 2020-21. Kindly look at table-2.</p><p style="text-align:justify">Please note that the <a href="https://im4change.org/upload/files/Annual%20Report%20PLFS%202020-21.pdf" title="https://im4change.org/upload/files/Annual%20Report%20PLFS%202020-21.pdf" title="https://im4change.org/upload/files/Annual%20Report%20PLFS%202020-21.pdf" title="https://im4change.org/upload/files/Annual%20Report%20PLFS%202020-21.pdf">Annual Report on PLFS 2020-2021</a> has also covered the period <em>(i.e., April-June, 2021) </em>when the state-wide lockdowns associated with the second wave of COVID-19 were imposed. The <a href="https://im4change.org/upload/files/Annual_Report_PLFS_2019_20.pdf" title="https://im4change.org/upload/files/Annual_Report_PLFS_2019_20.pdf" title="https://im4change.org/upload/files/Annual_Report_PLFS_2019_20.pdf" title="https://im4change.org/upload/files/Annual_Report_PLFS_2019_20.pdf">Annual Report on PLFS 2019-20</a> too had covered the period <em>(i.e., April-June, 2020)</em> when the countrywide lockdown <em>(associated with the first year of the COVID-19 pandemic) </em>was imposed. </p><p style="text-align:justify"><em><strong>References</strong></em></p><p style="text-align:justify">Fourth Periodic Labour Force Survey Annual Report (July 2020-June 2021), released in June 2022, National Statistical Office (NSO), Ministry of Statistics and Programme Implementation (MoSPI), <a href="https://im4change.org/upload/files/Annual%20Report%20PLFS%202020-21.pdf" title="https://im4change.org/upload/files/Annual%20Report%20PLFS%202020-21.pdf">click here</a> to access </p><p style="text-align:justify">Third Periodic Labour Force Survey Annual Report (July 2019-June 2020), released in July 2021, National Statistical Office (NSO), Ministry of Statistics and Programme Implementation (MoSPI), please <a href="https://im4change.org/upload/files/Annual_Report_PLFS_2019_20.pdf" title="https://im4change.org/upload/files/Annual_Report_PLFS_2019_20.pdf">click here</a> to access </p><p style="text-align:justify">Second Periodic Labour Force Survey Annual Report (July 2018-June 2019), released in June 2020, National Statistical Office (NSO), Ministry of Statistics and Programme Implementation (MoSPI), please <a href="https://im4change.org/docs/annual-report-on-periodic-labour-force-survey-july-2018-june-2019.pdf" title="https://im4change.org/docs/annual-report-on-periodic-labour-force-survey-july-2018-june-2019.pdf">click here</a> to access </p><p style="text-align:justify">First Periodic Labour Force Survey Annual Report (July 2017-June 2018), released in May 2019, National Statistical Office (NSO), Ministry of Statistics and Programme Implementation (MoSPI), please <a href="https://im4change.org/docs/216Annual_Report_PLFS_2017_18_31052019.pdf" title="https://im4change.org/docs/216Annual_Report_PLFS_2017_18_31052019.pdf">click here</a> to access </p><p style="text-align:justify">News alert: Quality of work matters, and not just job creation, Inclusive Media for Change, Published on: Sep 26, 2022, please <a href="https://im4change.org/news-alerts-57/plfs-unemployment-rate-labour-force-participation-rate-worker-population-ratio-decent-work-social-security-quality-of-work-gainful-employment.html" title="https://im4change.org/news-alerts-57/plfs-unemployment-rate-labour-force-participation-rate-worker-population-ratio-decent-work-social-security-quality-of-work-gainful-employment.html">click here</a> to access</p><p style="text-align:justify">What’s behind the ‘improvement’ in employment situation in labour force survey report -PC Mohanan, ThePrint, 21 August, 2021, please <a href="https://theprint.in/opinion/what-is-behind-the-improvement-in-employment-situation/719674/" title="https://theprint.in/opinion/what-is-behind-the-improvement-in-employment-situation/719674/">click here</a> to access </p><p style="text-align:justify"><br /><strong>Image Courtesy: Inclusive Media for Change/ Himanshu Joshi</strong></p> </font>
</td>
</tr>
<tr>
<td> </td>
</tr>
<tr>
<td height="50" style="border-top:1px solid #000; border-bottom:1px solid #000;padding-top:10px;">
<form><input type="button" value=" Print this page "
onclick="window.print();return false;"/></form>
</td>
</tr>
</table></body>
</html>'
}
$cookies = []
$values = [
(int) 0 => 'text/html; charset=UTF-8'
]
$name = 'Content-Type'
$first = true
$value = 'text/html; charset=UTF-8'
header - [internal], line ??
Cake\Http\ResponseEmitter::emitHeaders() - CORE/src/Http/ResponseEmitter.php, line 181
Cake\Http\ResponseEmitter::emit() - CORE/src/Http/ResponseEmitter.php, line 55
Cake\Http\Server::emit() - CORE/src/Http/Server.php, line 141
[main] - ROOT/webroot/index.php, line 39
Notice (8): Undefined variable: urlPrefix [APP/Template/Layout/printlayout.ctp, line 8]
$viewFile = '/home/brlfuser/public_html/src/Template/Layout/printlayout.ctp'
$dataForView = [
'article_current' => object(App\Model\Entity\Article) {
'id' => (int) 63956,
'title' => 'How well did the women workers fare during the pandemic years? The yearly PLFS reports provide some mixed answers.',
'subheading' => null,
'description' => '<p style="text-align:justify">Do you want a job that does not pay you at all? The answer will be surely 'no' for most of us. And yet, in our <a href="https://im4change.org/news-alerts-57/plfs-unemployment-rate-labour-force-participation-rate-worker-population-ratio-decent-work-social-security-quality-of-work-gainful-employment.html">previous analysis</a>, it was found that the proportion of 'helpers in household enterprises' among the total number of workers grew over various rounds of annual PLFS <em>(Periodic Labour Force Survey)</em>, from 13.3 percent to 15.9 percent between PLFS 2018-19 and PLFS 2019-20, and then soared further to 17.3 percent in PLFS 2020-21. </p>
<p style="text-align:justify">The most elemental question that comes to one’s mind is which gender took up such unpaid, low-quality jobs during the pandemic years and whether there was a rural-urban divide noticed in that trend. </p>
<p style="text-align:justify">Without further ado, it needs to be mentioned here that from table-15 of each of the annual PLFS reports <em>(please click <a href="https://im4change.org/upload/files/Annual%20Report%20PLFS%202020-21.pdf">here</a>, <a href="https://im4change.org/upload/files/Annual_Report_PLFS_2019_20.pdf">here</a>, <a href="https://im4change.org/docs/annual-report-on-periodic-labour-force-survey-july-2018-june-2019.pdf">here</a> and <a href="https://im4change.org/docs/216Annual_Report_PLFS_2017_18_31052019.pdf">here</a> to access)</em>, the proportion of male and female workers for various categories of work is extracted, and the data is presented as table-1 and table-2 in this analysis.</p>
<p style="text-align:justify">The categories of workers, which have been considered in the present news alert, are as follows: </p>
<p style="text-align:justify"><strong>Self-employed </strong></p>
<p style="text-align:justify">- Code 11: worked in household enterprises <em>(self-employed) </em>as own-account worker <br />
- Code 12: worked in household enterprises <em>(self-employed) </em>as an employer<br />
- Code 21: worked in household enterprises <em>(self-employed) </em>as helper </p>
<p style="text-align:justify"><strong>Regular/salaried </strong></p>
<p style="text-align:justify">- Code 31: worked as regular wage/salaried employee </p>
<p style="text-align:justify"><strong>Casual Workers </strong></p>
<p style="text-align:justify">- Code 41: worked as casual labour in public works other than MGNREG public works<br />
- Code 51: worked as casual labour in other types of works</p>
<p style="text-align:justify"><strong>Not working but seeking/available for work <em>(or unemployed)</em></strong></p>
<p style="text-align:justify">- Code 81: sought work or did not seek but was available for work <em>(for usual status approach)</em> </p>
<p style="text-align:justify"><strong>Neither working nor available for work <em>(or not in labour force)</em> </strong></p>
<p style="text-align:justify">- Code 97: others <em>(including beggars, prostitutes, etc.)</em></p>
<p style="text-align:justify"><strong>---</strong></p>
<p style="text-align:justify">In rural areas, the proportion of usual status male workers as self-employed <em>(sum of own-account workers and employers in household enterprises) </em>increased over various rounds of annual PLFS, from 34.7 percent in PLFS 2017-18 to 36.6 percent in PLFS 2020-21. In urban areas too, for the same category of self-employed, this proportion went up between PLFS 2018-19 and PLFS 2020-21. Please see table-1.</p>
<p style="text-align:justify"><strong>Table 1: Percentage of usual status workers in different categories of 15 years plus population: Male</strong></p>
<p style="text-align:justify"><img alt="" src="/upload/images/Table%201%20Percentage%20of%20usual%20status%20workers%20in%20different%20categories%20of%2015%20plus%20population%20Male.png" style="height:295px; width:860px" /></p>
<p style="text-align:justify"><em><strong>Source: </strong>Fourth Periodic Labour Force Survey Annual Report (July 2020-June 2021), please <a href="https://im4change.org/upload/files/Annual%20Report%20PLFS%202020-21.pdf">click here</a> to access </em></p>
<p style="text-align:justify"><em>Third Periodic Labour Force Survey Annual Report (July 2019-June 2020), please <a href="https://im4change.org/upload/files/Annual_Report_PLFS_2019_20.pdf ">click here</a> to access </em></p>
<p style="text-align:justify"><em>Second Periodic Labour Force Survey Annual Report (July 2018-June 2019), please <a href="https://im4change.org/docs/annual-report-on-periodic-labour-force-survey-july-2018-june-2019.pdf ">click here</a> to access </em></p>
<p style="text-align:justify"><em>First Periodic Labour Force Survey Annual Report (July 2017-June 2018), please <a href="https://im4change.org/docs/216Annual_Report_PLFS_2017_18_31052019.pdf ">click here</a> to access </em></p>
<p style="text-align:justify"><strong>---</strong></p>
<p style="text-align:justify">The proportion of usual status female workers as self-employed <em>(sum of own-account workers and employers in household enterprises) </em>climbed up over various rounds of annual PLFS, from 4.5 percent in PLFS 2017-18 to 7.9 percent in PLFS 2020-21. In urban areas too, for the same category of self-employed, this proportion went up between PLFS 2017-18 and PLFS 2020-21. Kindly take a look at table-2.</p>
<p style="text-align:justify"><strong>Table 2: Percentage of usual status workers in different categories of 15 years plus population: Female</strong></p>
<p style="text-align:justify"><img alt="" src="/upload/images/Table%202%20Percentage%20of%20usual%20status%20workers%20in%20different%20categories%20of%2015%20plus%20population%20Female.png" style="height:295px; width:861px" /></p>
<p style="text-align:justify"><em><strong>Source: </strong>Same as table-1</em><br />
<strong>---</strong></p>
<p style="text-align:justify">As can be seen from table-1 of this analysis, although the proportion of usual status male workers as household enterprise helpers in rural areas came down slightly between PLFS 2017-18 and PLFS 2018-19, it gradually went up to 7.7 percent in PLFS 2019-20, and further to 8.2 percent in PLFS 2020-21. </p>
<p style="text-align:justify">In urban areas, after remaining unchanged for two successive rounds of annual PLFS, the proportion of usual status male workers as household enterprise helpers increased marginally to 3.1 percent in PLFS 2020-21. </p>
<p style="text-align:justify"><span style="background-color:#ffcc00">In contrast to male workers, the proportion of usual status female workers as household enterprise helpers in rural areas increased over various rounds of annual PLFS, from 9.1 percent in PLFS 2017-18 to 15.3 percent in PLFS 2020-21. Between PLFS 2018-19 and PLFS 2019-20, there was a noticeable jump in the proportion of usual status female workers as household enterprise helpers in such areas. In rural areas, compared to its male counterpart, a higher proportion of usual status female workers worked as household enterprise helpers during each of the annual PLFS rounds, from PLFS 2017-18 to PLFS 2020-21. The gap between the proportion of usual status female workers as household enterprise helpers and that of its male counterpart in rural areas expanded from 2.1 percentage points (p.p.) to 7.1 p.p. between PLFS 2017-18 and PLFS 2020-21. Kindly compare table-1 against table-2. </span></p>
<p style="text-align:justify">In urban areas, the proportion of usual status female workers as household enterprise helpers increased over various rounds of annual PLFS, from 1.8 percent in PLFS 2018-19 to 2.6 percent in PLFS 2020-21. </p>
<p style="text-align:justify">In rural areas, the proportion of usual status male workers as regular/salaried workers remained almost the same between PLFS 2017-18 and PLFS 2020-21. However, the proportion of usual status male workers as regular/salaried workers decreased from 33.0 percent to 31.7 percent between PLFS 2019-20 and PLFS 2020-21 in urban areas. Please see table-1.</p>
<p style="text-align:justify">In rural areas, the proportion of usual status female workers as regular/salaried workers increased over various annual PLFS rounds, from 2.5 percent in PLFS 2017-18 to 3.3 percent in PLFS 2020-21. In urban areas, at first the proportion of usual status female workers as regular/salaried workers grew from 9.5 percent in PLFS 2017-18 to 11.5 percent in PLFS 2019-20, but then it dropped to 10.6 percent in PLFS 2020-21.</p>
<p style="text-align:justify">In rural areas, the proportion of usual status male workers who worked as casual labour in other types of works <em>(i.e., excluding public works as well as MGNREGA) </em>remained at around 20 percent in various annual PLFS rounds. For the same category of workers in urban areas, this proportion marginally rose from 9.6 percent in PLFS 2018-19 to 9.8 percent in PLFS 2019-20, and further to 10.3 percent in 2020-21. Kindly consult table-1.</p>
<p style="text-align:justify">In rural areas, the proportion of usual status female workers who worked as casual labour in other types of works <em>(i.e., excluding public works as well as MGNREGA) </em>increased from 6.6 percent to 8.3 percent between PLFS 2018-19 and PLFS 2020-21. For the same category of workers in urban areas, this proportion remained the same in PLFS 2019-20 and PLFS 2020-21. Kindly look at table-2.</p>
<p style="text-align:justify">Please note that the <a href="https://im4change.org/upload/files/Annual%20Report%20PLFS%202020-21.pdf" title="https://im4change.org/upload/files/Annual%20Report%20PLFS%202020-21.pdf">Annual Report on PLFS 2020-2021</a> has also covered the period <em>(i.e., April-June, 2021) </em>when the state-wide lockdowns associated with the second wave of COVID-19 were imposed. The <a href="https://im4change.org/upload/files/Annual_Report_PLFS_2019_20.pdf" title="https://im4change.org/upload/files/Annual_Report_PLFS_2019_20.pdf">Annual Report on PLFS 2019-20</a> too had covered the period <em>(i.e., April-June, 2020)</em> when the countrywide lockdown <em>(associated with the first year of the COVID-19 pandemic) </em>was imposed. </p>
<p style="text-align:justify"><em><strong>References</strong></em></p>
<p style="text-align:justify">Fourth Periodic Labour Force Survey Annual Report (July 2020-June 2021), released in June 2022, National Statistical Office (NSO), Ministry of Statistics and Programme Implementation (MoSPI), <a href="https://im4change.org/upload/files/Annual%20Report%20PLFS%202020-21.pdf">click here</a> to access </p>
<p style="text-align:justify">Third Periodic Labour Force Survey Annual Report (July 2019-June 2020), released in July 2021, National Statistical Office (NSO), Ministry of Statistics and Programme Implementation (MoSPI), please <a href="https://im4change.org/upload/files/Annual_Report_PLFS_2019_20.pdf ">click here</a> to access </p>
<p style="text-align:justify">Second Periodic Labour Force Survey Annual Report (July 2018-June 2019), released in June 2020, National Statistical Office (NSO), Ministry of Statistics and Programme Implementation (MoSPI), please <a href="https://im4change.org/docs/annual-report-on-periodic-labour-force-survey-july-2018-june-2019.pdf ">click here</a> to access </p>
<p style="text-align:justify">First Periodic Labour Force Survey Annual Report (July 2017-June 2018), released in May 2019, National Statistical Office (NSO), Ministry of Statistics and Programme Implementation (MoSPI), please <a href="https://im4change.org/docs/216Annual_Report_PLFS_2017_18_31052019.pdf ">click here</a> to access </p>
<p style="text-align:justify">News alert: Quality of work matters, and not just job creation, Inclusive Media for Change, Published on: Sep 26, 2022, please <a href="https://im4change.org/news-alerts-57/plfs-unemployment-rate-labour-force-participation-rate-worker-population-ratio-decent-work-social-security-quality-of-work-gainful-employment.html">click here</a> to access</p>
<p style="text-align:justify">What’s behind the ‘improvement’ in employment situation in labour force survey report -PC Mohanan, ThePrint, 21 August, 2021, please <a href="https://theprint.in/opinion/what-is-behind-the-improvement-in-employment-situation/719674/ ">click here</a> to access </p>
<p style="text-align:justify"><br />
<strong>Image Courtesy: Inclusive Media for Change/ Himanshu Joshi</strong></p>
',
'credit_writer' => '',
'article_img' => 'Image Employment dated 7 Oct 2022.jpg',
'article_img_thumb' => 'Image Employment dated 7 Oct 2022.jpg',
'status' => (int) 1,
'show_on_home' => (int) 1,
'lang' => 'EN',
'category_id' => (int) 4,
'tag_keyword' => '',
'seo_url' => 'how-well-did-the-women-worker-fare-during-the-pandemic-years-plfs-reports-provide-some-mixed-answers-casual-workers-self-employed-unpaid-helpers-family-enterprises-regular-wage-salaried',
'meta_title' => '',
'meta_keywords' => '',
'meta_description' => '',
'noindex' => (int) 1,
'publish_date' => object(Cake\I18n\FrozenDate) {},
'most_visit_section_id' => null,
'article_big_img' => null,
'liveid' => null,
'created' => object(Cake\I18n\FrozenTime) {},
'modified' => object(Cake\I18n\FrozenTime) {},
'edate' => '',
'tags' => [
[maximum depth reached]
],
'category' => object(App\Model\Entity\Category) {},
'[new]' => false,
'[accessible]' => [
[maximum depth reached]
],
'[dirty]' => [[maximum depth reached]],
'[original]' => [[maximum depth reached]],
'[virtual]' => [[maximum depth reached]],
'[hasErrors]' => false,
'[errors]' => [[maximum depth reached]],
'[invalid]' => [[maximum depth reached]],
'[repository]' => 'Articles'
},
'articleid' => (int) 63956,
'metaTitle' => 'NEWS ALERTS | How well did the women workers fare during the pandemic years? The yearly PLFS reports provide some mixed answers.',
'metaKeywords' => 'Casual Workers,Female workers,Household Enterprises,Male workers,Periodic Labour Force Survey,PLFS,regular wage/salaried employee,Self Employed,Self-employed,Unpaid Helpers,Women workers',
'metaDesc' => 'Do you want a job that does not pay you at all? The answer will be surely 'no' for most of us. And yet, in our previous analysis, it was found that the proportion of 'helpers in household enterprises' among...',
'disp' => '<p style="text-align:justify">Do you want a job that does not pay you at all? The answer will be surely 'no' for most of us. And yet, in our <a href="https://im4change.org/news-alerts-57/plfs-unemployment-rate-labour-force-participation-rate-worker-population-ratio-decent-work-social-security-quality-of-work-gainful-employment.html" title="https://im4change.org/news-alerts-57/plfs-unemployment-rate-labour-force-participation-rate-worker-population-ratio-decent-work-social-security-quality-of-work-gainful-employment.html">previous analysis</a>, it was found that the proportion of 'helpers in household enterprises' among the total number of workers grew over various rounds of annual PLFS <em>(Periodic Labour Force Survey)</em>, from 13.3 percent to 15.9 percent between PLFS 2018-19 and PLFS 2019-20, and then soared further to 17.3 percent in PLFS 2020-21. </p><p style="text-align:justify">The most elemental question that comes to one’s mind is which gender took up such unpaid, low-quality jobs during the pandemic years and whether there was a rural-urban divide noticed in that trend. </p><p style="text-align:justify">Without further ado, it needs to be mentioned here that from table-15 of each of the annual PLFS reports <em>(please click <a href="https://im4change.org/upload/files/Annual%20Report%20PLFS%202020-21.pdf" title="https://im4change.org/upload/files/Annual%20Report%20PLFS%202020-21.pdf">here</a>, <a href="https://im4change.org/upload/files/Annual_Report_PLFS_2019_20.pdf" title="https://im4change.org/upload/files/Annual_Report_PLFS_2019_20.pdf">here</a>, <a href="https://im4change.org/docs/annual-report-on-periodic-labour-force-survey-july-2018-june-2019.pdf" title="https://im4change.org/docs/annual-report-on-periodic-labour-force-survey-july-2018-june-2019.pdf">here</a> and <a href="https://im4change.org/docs/216Annual_Report_PLFS_2017_18_31052019.pdf" title="https://im4change.org/docs/216Annual_Report_PLFS_2017_18_31052019.pdf">here</a> to access)</em>, the proportion of male and female workers for various categories of work is extracted, and the data is presented as table-1 and table-2 in this analysis.</p><p style="text-align:justify">The categories of workers, which have been considered in the present news alert, are as follows: </p><p style="text-align:justify"><strong>Self-employed </strong></p><p style="text-align:justify">- Code 11: worked in household enterprises <em>(self-employed) </em>as own-account worker <br />- Code 12: worked in household enterprises <em>(self-employed) </em>as an employer<br />- Code 21: worked in household enterprises <em>(self-employed) </em>as helper </p><p style="text-align:justify"><strong>Regular/salaried </strong></p><p style="text-align:justify">- Code 31: worked as regular wage/salaried employee </p><p style="text-align:justify"><strong>Casual Workers </strong></p><p style="text-align:justify">- Code 41: worked as casual labour in public works other than MGNREG public works<br />- Code 51: worked as casual labour in other types of works</p><p style="text-align:justify"><strong>Not working but seeking/available for work <em>(or unemployed)</em></strong></p><p style="text-align:justify">- Code 81: sought work or did not seek but was available for work <em>(for usual status approach)</em> </p><p style="text-align:justify"><strong>Neither working nor available for work <em>(or not in labour force)</em> </strong></p><p style="text-align:justify">- Code 97: others <em>(including beggars, prostitutes, etc.)</em></p><p style="text-align:justify"><strong>---</strong></p><p style="text-align:justify">In rural areas, the proportion of usual status male workers as self-employed <em>(sum of own-account workers and employers in household enterprises) </em>increased over various rounds of annual PLFS, from 34.7 percent in PLFS 2017-18 to 36.6 percent in PLFS 2020-21. In urban areas too, for the same category of self-employed, this proportion went up between PLFS 2018-19 and PLFS 2020-21. Please see table-1.</p><p style="text-align:justify"><strong>Table 1: Percentage of usual status workers in different categories of 15 years plus population: Male</strong></p><p style="text-align:justify"><img alt="" src="/upload/images/Table%201%20Percentage%20of%20usual%20status%20workers%20in%20different%20categories%20of%2015%20plus%20population%20Male.png" style="height:295px; width:860px" /></p><p style="text-align:justify"><em><strong>Source: </strong>Fourth Periodic Labour Force Survey Annual Report (July 2020-June 2021), please <a href="https://im4change.org/upload/files/Annual%20Report%20PLFS%202020-21.pdf" title="https://im4change.org/upload/files/Annual%20Report%20PLFS%202020-21.pdf">click here</a> to access </em></p><p style="text-align:justify"><em>Third Periodic Labour Force Survey Annual Report (July 2019-June 2020), please <a href="https://im4change.org/upload/files/Annual_Report_PLFS_2019_20.pdf" title="https://im4change.org/upload/files/Annual_Report_PLFS_2019_20.pdf">click here</a> to access </em></p><p style="text-align:justify"><em>Second Periodic Labour Force Survey Annual Report (July 2018-June 2019), please <a href="https://im4change.org/docs/annual-report-on-periodic-labour-force-survey-july-2018-june-2019.pdf" title="https://im4change.org/docs/annual-report-on-periodic-labour-force-survey-july-2018-june-2019.pdf">click here</a> to access </em></p><p style="text-align:justify"><em>First Periodic Labour Force Survey Annual Report (July 2017-June 2018), please <a href="https://im4change.org/docs/216Annual_Report_PLFS_2017_18_31052019.pdf" title="https://im4change.org/docs/216Annual_Report_PLFS_2017_18_31052019.pdf">click here</a> to access </em></p><p style="text-align:justify"><strong>---</strong></p><p style="text-align:justify">The proportion of usual status female workers as self-employed <em>(sum of own-account workers and employers in household enterprises) </em>climbed up over various rounds of annual PLFS, from 4.5 percent in PLFS 2017-18 to 7.9 percent in PLFS 2020-21. In urban areas too, for the same category of self-employed, this proportion went up between PLFS 2017-18 and PLFS 2020-21. Kindly take a look at table-2.</p><p style="text-align:justify"><strong>Table 2: Percentage of usual status workers in different categories of 15 years plus population: Female</strong></p><p style="text-align:justify"><img alt="" src="/upload/images/Table%202%20Percentage%20of%20usual%20status%20workers%20in%20different%20categories%20of%2015%20plus%20population%20Female.png" style="height:295px; width:861px" /></p><p style="text-align:justify"><em><strong>Source: </strong>Same as table-1</em><br /><strong>---</strong></p><p style="text-align:justify">As can be seen from table-1 of this analysis, although the proportion of usual status male workers as household enterprise helpers in rural areas came down slightly between PLFS 2017-18 and PLFS 2018-19, it gradually went up to 7.7 percent in PLFS 2019-20, and further to 8.2 percent in PLFS 2020-21. </p><p style="text-align:justify">In urban areas, after remaining unchanged for two successive rounds of annual PLFS, the proportion of usual status male workers as household enterprise helpers increased marginally to 3.1 percent in PLFS 2020-21. </p><p style="text-align:justify"><span style="background-color:#ffcc00">In contrast to male workers, the proportion of usual status female workers as household enterprise helpers in rural areas increased over various rounds of annual PLFS, from 9.1 percent in PLFS 2017-18 to 15.3 percent in PLFS 2020-21. Between PLFS 2018-19 and PLFS 2019-20, there was a noticeable jump in the proportion of usual status female workers as household enterprise helpers in such areas. In rural areas, compared to its male counterpart, a higher proportion of usual status female workers worked as household enterprise helpers during each of the annual PLFS rounds, from PLFS 2017-18 to PLFS 2020-21. The gap between the proportion of usual status female workers as household enterprise helpers and that of its male counterpart in rural areas expanded from 2.1 percentage points (p.p.) to 7.1 p.p. between PLFS 2017-18 and PLFS 2020-21. Kindly compare table-1 against table-2. </span></p><p style="text-align:justify">In urban areas, the proportion of usual status female workers as household enterprise helpers increased over various rounds of annual PLFS, from 1.8 percent in PLFS 2018-19 to 2.6 percent in PLFS 2020-21. </p><p style="text-align:justify">In rural areas, the proportion of usual status male workers as regular/salaried workers remained almost the same between PLFS 2017-18 and PLFS 2020-21. However, the proportion of usual status male workers as regular/salaried workers decreased from 33.0 percent to 31.7 percent between PLFS 2019-20 and PLFS 2020-21 in urban areas. Please see table-1.</p><p style="text-align:justify">In rural areas, the proportion of usual status female workers as regular/salaried workers increased over various annual PLFS rounds, from 2.5 percent in PLFS 2017-18 to 3.3 percent in PLFS 2020-21. In urban areas, at first the proportion of usual status female workers as regular/salaried workers grew from 9.5 percent in PLFS 2017-18 to 11.5 percent in PLFS 2019-20, but then it dropped to 10.6 percent in PLFS 2020-21.</p><p style="text-align:justify">In rural areas, the proportion of usual status male workers who worked as casual labour in other types of works <em>(i.e., excluding public works as well as MGNREGA) </em>remained at around 20 percent in various annual PLFS rounds. For the same category of workers in urban areas, this proportion marginally rose from 9.6 percent in PLFS 2018-19 to 9.8 percent in PLFS 2019-20, and further to 10.3 percent in 2020-21. Kindly consult table-1.</p><p style="text-align:justify">In rural areas, the proportion of usual status female workers who worked as casual labour in other types of works <em>(i.e., excluding public works as well as MGNREGA) </em>increased from 6.6 percent to 8.3 percent between PLFS 2018-19 and PLFS 2020-21. For the same category of workers in urban areas, this proportion remained the same in PLFS 2019-20 and PLFS 2020-21. Kindly look at table-2.</p><p style="text-align:justify">Please note that the <a href="https://im4change.org/upload/files/Annual%20Report%20PLFS%202020-21.pdf" title="https://im4change.org/upload/files/Annual%20Report%20PLFS%202020-21.pdf" title="https://im4change.org/upload/files/Annual%20Report%20PLFS%202020-21.pdf" title="https://im4change.org/upload/files/Annual%20Report%20PLFS%202020-21.pdf">Annual Report on PLFS 2020-2021</a> has also covered the period <em>(i.e., April-June, 2021) </em>when the state-wide lockdowns associated with the second wave of COVID-19 were imposed. The <a href="https://im4change.org/upload/files/Annual_Report_PLFS_2019_20.pdf" title="https://im4change.org/upload/files/Annual_Report_PLFS_2019_20.pdf" title="https://im4change.org/upload/files/Annual_Report_PLFS_2019_20.pdf" title="https://im4change.org/upload/files/Annual_Report_PLFS_2019_20.pdf">Annual Report on PLFS 2019-20</a> too had covered the period <em>(i.e., April-June, 2020)</em> when the countrywide lockdown <em>(associated with the first year of the COVID-19 pandemic) </em>was imposed. </p><p style="text-align:justify"><em><strong>References</strong></em></p><p style="text-align:justify">Fourth Periodic Labour Force Survey Annual Report (July 2020-June 2021), released in June 2022, National Statistical Office (NSO), Ministry of Statistics and Programme Implementation (MoSPI), <a href="https://im4change.org/upload/files/Annual%20Report%20PLFS%202020-21.pdf" title="https://im4change.org/upload/files/Annual%20Report%20PLFS%202020-21.pdf">click here</a> to access </p><p style="text-align:justify">Third Periodic Labour Force Survey Annual Report (July 2019-June 2020), released in July 2021, National Statistical Office (NSO), Ministry of Statistics and Programme Implementation (MoSPI), please <a href="https://im4change.org/upload/files/Annual_Report_PLFS_2019_20.pdf" title="https://im4change.org/upload/files/Annual_Report_PLFS_2019_20.pdf">click here</a> to access </p><p style="text-align:justify">Second Periodic Labour Force Survey Annual Report (July 2018-June 2019), released in June 2020, National Statistical Office (NSO), Ministry of Statistics and Programme Implementation (MoSPI), please <a href="https://im4change.org/docs/annual-report-on-periodic-labour-force-survey-july-2018-june-2019.pdf" title="https://im4change.org/docs/annual-report-on-periodic-labour-force-survey-july-2018-june-2019.pdf">click here</a> to access </p><p style="text-align:justify">First Periodic Labour Force Survey Annual Report (July 2017-June 2018), released in May 2019, National Statistical Office (NSO), Ministry of Statistics and Programme Implementation (MoSPI), please <a href="https://im4change.org/docs/216Annual_Report_PLFS_2017_18_31052019.pdf" title="https://im4change.org/docs/216Annual_Report_PLFS_2017_18_31052019.pdf">click here</a> to access </p><p style="text-align:justify">News alert: Quality of work matters, and not just job creation, Inclusive Media for Change, Published on: Sep 26, 2022, please <a href="https://im4change.org/news-alerts-57/plfs-unemployment-rate-labour-force-participation-rate-worker-population-ratio-decent-work-social-security-quality-of-work-gainful-employment.html" title="https://im4change.org/news-alerts-57/plfs-unemployment-rate-labour-force-participation-rate-worker-population-ratio-decent-work-social-security-quality-of-work-gainful-employment.html">click here</a> to access</p><p style="text-align:justify">What’s behind the ‘improvement’ in employment situation in labour force survey report -PC Mohanan, ThePrint, 21 August, 2021, please <a href="https://theprint.in/opinion/what-is-behind-the-improvement-in-employment-situation/719674/" title="https://theprint.in/opinion/what-is-behind-the-improvement-in-employment-situation/719674/">click here</a> to access </p><p style="text-align:justify"><br /><strong>Image Courtesy: Inclusive Media for Change/ Himanshu Joshi</strong></p>',
'lang' => 'English',
'SITE_URL' => 'https://im4change.in/',
'site_title' => 'im4change',
'adminprix' => 'admin'
]
$article_current = object(App\Model\Entity\Article) {
'id' => (int) 63956,
'title' => 'How well did the women workers fare during the pandemic years? The yearly PLFS reports provide some mixed answers.',
'subheading' => null,
'description' => '<p style="text-align:justify">Do you want a job that does not pay you at all? The answer will be surely 'no' for most of us. And yet, in our <a href="https://im4change.org/news-alerts-57/plfs-unemployment-rate-labour-force-participation-rate-worker-population-ratio-decent-work-social-security-quality-of-work-gainful-employment.html">previous analysis</a>, it was found that the proportion of 'helpers in household enterprises' among the total number of workers grew over various rounds of annual PLFS <em>(Periodic Labour Force Survey)</em>, from 13.3 percent to 15.9 percent between PLFS 2018-19 and PLFS 2019-20, and then soared further to 17.3 percent in PLFS 2020-21. </p>
<p style="text-align:justify">The most elemental question that comes to one’s mind is which gender took up such unpaid, low-quality jobs during the pandemic years and whether there was a rural-urban divide noticed in that trend. </p>
<p style="text-align:justify">Without further ado, it needs to be mentioned here that from table-15 of each of the annual PLFS reports <em>(please click <a href="https://im4change.org/upload/files/Annual%20Report%20PLFS%202020-21.pdf">here</a>, <a href="https://im4change.org/upload/files/Annual_Report_PLFS_2019_20.pdf">here</a>, <a href="https://im4change.org/docs/annual-report-on-periodic-labour-force-survey-july-2018-june-2019.pdf">here</a> and <a href="https://im4change.org/docs/216Annual_Report_PLFS_2017_18_31052019.pdf">here</a> to access)</em>, the proportion of male and female workers for various categories of work is extracted, and the data is presented as table-1 and table-2 in this analysis.</p>
<p style="text-align:justify">The categories of workers, which have been considered in the present news alert, are as follows: </p>
<p style="text-align:justify"><strong>Self-employed </strong></p>
<p style="text-align:justify">- Code 11: worked in household enterprises <em>(self-employed) </em>as own-account worker <br />
- Code 12: worked in household enterprises <em>(self-employed) </em>as an employer<br />
- Code 21: worked in household enterprises <em>(self-employed) </em>as helper </p>
<p style="text-align:justify"><strong>Regular/salaried </strong></p>
<p style="text-align:justify">- Code 31: worked as regular wage/salaried employee </p>
<p style="text-align:justify"><strong>Casual Workers </strong></p>
<p style="text-align:justify">- Code 41: worked as casual labour in public works other than MGNREG public works<br />
- Code 51: worked as casual labour in other types of works</p>
<p style="text-align:justify"><strong>Not working but seeking/available for work <em>(or unemployed)</em></strong></p>
<p style="text-align:justify">- Code 81: sought work or did not seek but was available for work <em>(for usual status approach)</em> </p>
<p style="text-align:justify"><strong>Neither working nor available for work <em>(or not in labour force)</em> </strong></p>
<p style="text-align:justify">- Code 97: others <em>(including beggars, prostitutes, etc.)</em></p>
<p style="text-align:justify"><strong>---</strong></p>
<p style="text-align:justify">In rural areas, the proportion of usual status male workers as self-employed <em>(sum of own-account workers and employers in household enterprises) </em>increased over various rounds of annual PLFS, from 34.7 percent in PLFS 2017-18 to 36.6 percent in PLFS 2020-21. In urban areas too, for the same category of self-employed, this proportion went up between PLFS 2018-19 and PLFS 2020-21. Please see table-1.</p>
<p style="text-align:justify"><strong>Table 1: Percentage of usual status workers in different categories of 15 years plus population: Male</strong></p>
<p style="text-align:justify"><img alt="" src="/upload/images/Table%201%20Percentage%20of%20usual%20status%20workers%20in%20different%20categories%20of%2015%20plus%20population%20Male.png" style="height:295px; width:860px" /></p>
<p style="text-align:justify"><em><strong>Source: </strong>Fourth Periodic Labour Force Survey Annual Report (July 2020-June 2021), please <a href="https://im4change.org/upload/files/Annual%20Report%20PLFS%202020-21.pdf">click here</a> to access </em></p>
<p style="text-align:justify"><em>Third Periodic Labour Force Survey Annual Report (July 2019-June 2020), please <a href="https://im4change.org/upload/files/Annual_Report_PLFS_2019_20.pdf ">click here</a> to access </em></p>
<p style="text-align:justify"><em>Second Periodic Labour Force Survey Annual Report (July 2018-June 2019), please <a href="https://im4change.org/docs/annual-report-on-periodic-labour-force-survey-july-2018-june-2019.pdf ">click here</a> to access </em></p>
<p style="text-align:justify"><em>First Periodic Labour Force Survey Annual Report (July 2017-June 2018), please <a href="https://im4change.org/docs/216Annual_Report_PLFS_2017_18_31052019.pdf ">click here</a> to access </em></p>
<p style="text-align:justify"><strong>---</strong></p>
<p style="text-align:justify">The proportion of usual status female workers as self-employed <em>(sum of own-account workers and employers in household enterprises) </em>climbed up over various rounds of annual PLFS, from 4.5 percent in PLFS 2017-18 to 7.9 percent in PLFS 2020-21. In urban areas too, for the same category of self-employed, this proportion went up between PLFS 2017-18 and PLFS 2020-21. Kindly take a look at table-2.</p>
<p style="text-align:justify"><strong>Table 2: Percentage of usual status workers in different categories of 15 years plus population: Female</strong></p>
<p style="text-align:justify"><img alt="" src="/upload/images/Table%202%20Percentage%20of%20usual%20status%20workers%20in%20different%20categories%20of%2015%20plus%20population%20Female.png" style="height:295px; width:861px" /></p>
<p style="text-align:justify"><em><strong>Source: </strong>Same as table-1</em><br />
<strong>---</strong></p>
<p style="text-align:justify">As can be seen from table-1 of this analysis, although the proportion of usual status male workers as household enterprise helpers in rural areas came down slightly between PLFS 2017-18 and PLFS 2018-19, it gradually went up to 7.7 percent in PLFS 2019-20, and further to 8.2 percent in PLFS 2020-21. </p>
<p style="text-align:justify">In urban areas, after remaining unchanged for two successive rounds of annual PLFS, the proportion of usual status male workers as household enterprise helpers increased marginally to 3.1 percent in PLFS 2020-21. </p>
<p style="text-align:justify"><span style="background-color:#ffcc00">In contrast to male workers, the proportion of usual status female workers as household enterprise helpers in rural areas increased over various rounds of annual PLFS, from 9.1 percent in PLFS 2017-18 to 15.3 percent in PLFS 2020-21. Between PLFS 2018-19 and PLFS 2019-20, there was a noticeable jump in the proportion of usual status female workers as household enterprise helpers in such areas. In rural areas, compared to its male counterpart, a higher proportion of usual status female workers worked as household enterprise helpers during each of the annual PLFS rounds, from PLFS 2017-18 to PLFS 2020-21. The gap between the proportion of usual status female workers as household enterprise helpers and that of its male counterpart in rural areas expanded from 2.1 percentage points (p.p.) to 7.1 p.p. between PLFS 2017-18 and PLFS 2020-21. Kindly compare table-1 against table-2. </span></p>
<p style="text-align:justify">In urban areas, the proportion of usual status female workers as household enterprise helpers increased over various rounds of annual PLFS, from 1.8 percent in PLFS 2018-19 to 2.6 percent in PLFS 2020-21. </p>
<p style="text-align:justify">In rural areas, the proportion of usual status male workers as regular/salaried workers remained almost the same between PLFS 2017-18 and PLFS 2020-21. However, the proportion of usual status male workers as regular/salaried workers decreased from 33.0 percent to 31.7 percent between PLFS 2019-20 and PLFS 2020-21 in urban areas. Please see table-1.</p>
<p style="text-align:justify">In rural areas, the proportion of usual status female workers as regular/salaried workers increased over various annual PLFS rounds, from 2.5 percent in PLFS 2017-18 to 3.3 percent in PLFS 2020-21. In urban areas, at first the proportion of usual status female workers as regular/salaried workers grew from 9.5 percent in PLFS 2017-18 to 11.5 percent in PLFS 2019-20, but then it dropped to 10.6 percent in PLFS 2020-21.</p>
<p style="text-align:justify">In rural areas, the proportion of usual status male workers who worked as casual labour in other types of works <em>(i.e., excluding public works as well as MGNREGA) </em>remained at around 20 percent in various annual PLFS rounds. For the same category of workers in urban areas, this proportion marginally rose from 9.6 percent in PLFS 2018-19 to 9.8 percent in PLFS 2019-20, and further to 10.3 percent in 2020-21. Kindly consult table-1.</p>
<p style="text-align:justify">In rural areas, the proportion of usual status female workers who worked as casual labour in other types of works <em>(i.e., excluding public works as well as MGNREGA) </em>increased from 6.6 percent to 8.3 percent between PLFS 2018-19 and PLFS 2020-21. For the same category of workers in urban areas, this proportion remained the same in PLFS 2019-20 and PLFS 2020-21. Kindly look at table-2.</p>
<p style="text-align:justify">Please note that the <a href="https://im4change.org/upload/files/Annual%20Report%20PLFS%202020-21.pdf" title="https://im4change.org/upload/files/Annual%20Report%20PLFS%202020-21.pdf">Annual Report on PLFS 2020-2021</a> has also covered the period <em>(i.e., April-June, 2021) </em>when the state-wide lockdowns associated with the second wave of COVID-19 were imposed. The <a href="https://im4change.org/upload/files/Annual_Report_PLFS_2019_20.pdf" title="https://im4change.org/upload/files/Annual_Report_PLFS_2019_20.pdf">Annual Report on PLFS 2019-20</a> too had covered the period <em>(i.e., April-June, 2020)</em> when the countrywide lockdown <em>(associated with the first year of the COVID-19 pandemic) </em>was imposed. </p>
<p style="text-align:justify"><em><strong>References</strong></em></p>
<p style="text-align:justify">Fourth Periodic Labour Force Survey Annual Report (July 2020-June 2021), released in June 2022, National Statistical Office (NSO), Ministry of Statistics and Programme Implementation (MoSPI), <a href="https://im4change.org/upload/files/Annual%20Report%20PLFS%202020-21.pdf">click here</a> to access </p>
<p style="text-align:justify">Third Periodic Labour Force Survey Annual Report (July 2019-June 2020), released in July 2021, National Statistical Office (NSO), Ministry of Statistics and Programme Implementation (MoSPI), please <a href="https://im4change.org/upload/files/Annual_Report_PLFS_2019_20.pdf ">click here</a> to access </p>
<p style="text-align:justify">Second Periodic Labour Force Survey Annual Report (July 2018-June 2019), released in June 2020, National Statistical Office (NSO), Ministry of Statistics and Programme Implementation (MoSPI), please <a href="https://im4change.org/docs/annual-report-on-periodic-labour-force-survey-july-2018-june-2019.pdf ">click here</a> to access </p>
<p style="text-align:justify">First Periodic Labour Force Survey Annual Report (July 2017-June 2018), released in May 2019, National Statistical Office (NSO), Ministry of Statistics and Programme Implementation (MoSPI), please <a href="https://im4change.org/docs/216Annual_Report_PLFS_2017_18_31052019.pdf ">click here</a> to access </p>
<p style="text-align:justify">News alert: Quality of work matters, and not just job creation, Inclusive Media for Change, Published on: Sep 26, 2022, please <a href="https://im4change.org/news-alerts-57/plfs-unemployment-rate-labour-force-participation-rate-worker-population-ratio-decent-work-social-security-quality-of-work-gainful-employment.html">click here</a> to access</p>
<p style="text-align:justify">What’s behind the ‘improvement’ in employment situation in labour force survey report -PC Mohanan, ThePrint, 21 August, 2021, please <a href="https://theprint.in/opinion/what-is-behind-the-improvement-in-employment-situation/719674/ ">click here</a> to access </p>
<p style="text-align:justify"><br />
<strong>Image Courtesy: Inclusive Media for Change/ Himanshu Joshi</strong></p>
',
'credit_writer' => '',
'article_img' => 'Image Employment dated 7 Oct 2022.jpg',
'article_img_thumb' => 'Image Employment dated 7 Oct 2022.jpg',
'status' => (int) 1,
'show_on_home' => (int) 1,
'lang' => 'EN',
'category_id' => (int) 4,
'tag_keyword' => '',
'seo_url' => 'how-well-did-the-women-worker-fare-during-the-pandemic-years-plfs-reports-provide-some-mixed-answers-casual-workers-self-employed-unpaid-helpers-family-enterprises-regular-wage-salaried',
'meta_title' => '',
'meta_keywords' => '',
'meta_description' => '',
'noindex' => (int) 1,
'publish_date' => object(Cake\I18n\FrozenDate) {},
'most_visit_section_id' => null,
'article_big_img' => null,
'liveid' => null,
'created' => object(Cake\I18n\FrozenTime) {},
'modified' => object(Cake\I18n\FrozenTime) {},
'edate' => '',
'tags' => [
(int) 0 => object(Cake\ORM\Entity) {},
(int) 1 => object(Cake\ORM\Entity) {},
(int) 2 => object(Cake\ORM\Entity) {},
(int) 3 => object(Cake\ORM\Entity) {},
(int) 4 => object(Cake\ORM\Entity) {},
(int) 5 => object(Cake\ORM\Entity) {},
(int) 6 => object(Cake\ORM\Entity) {},
(int) 7 => object(Cake\ORM\Entity) {},
(int) 8 => object(Cake\ORM\Entity) {},
(int) 9 => object(Cake\ORM\Entity) {},
(int) 10 => object(Cake\ORM\Entity) {}
],
'category' => object(App\Model\Entity\Category) {},
'[new]' => false,
'[accessible]' => [
'*' => true,
'id' => false
],
'[dirty]' => [],
'[original]' => [],
'[virtual]' => [],
'[hasErrors]' => false,
'[errors]' => [],
'[invalid]' => [],
'[repository]' => 'Articles'
}
$articleid = (int) 63956
$metaTitle = 'NEWS ALERTS | How well did the women workers fare during the pandemic years? The yearly PLFS reports provide some mixed answers.'
$metaKeywords = 'Casual Workers,Female workers,Household Enterprises,Male workers,Periodic Labour Force Survey,PLFS,regular wage/salaried employee,Self Employed,Self-employed,Unpaid Helpers,Women workers'
$metaDesc = 'Do you want a job that does not pay you at all? The answer will be surely 'no' for most of us. And yet, in our previous analysis, it was found that the proportion of 'helpers in household enterprises' among...'
$disp = '<p style="text-align:justify">Do you want a job that does not pay you at all? The answer will be surely 'no' for most of us. And yet, in our <a href="https://im4change.org/news-alerts-57/plfs-unemployment-rate-labour-force-participation-rate-worker-population-ratio-decent-work-social-security-quality-of-work-gainful-employment.html" title="https://im4change.org/news-alerts-57/plfs-unemployment-rate-labour-force-participation-rate-worker-population-ratio-decent-work-social-security-quality-of-work-gainful-employment.html">previous analysis</a>, it was found that the proportion of 'helpers in household enterprises' among the total number of workers grew over various rounds of annual PLFS <em>(Periodic Labour Force Survey)</em>, from 13.3 percent to 15.9 percent between PLFS 2018-19 and PLFS 2019-20, and then soared further to 17.3 percent in PLFS 2020-21. </p><p style="text-align:justify">The most elemental question that comes to one’s mind is which gender took up such unpaid, low-quality jobs during the pandemic years and whether there was a rural-urban divide noticed in that trend. </p><p style="text-align:justify">Without further ado, it needs to be mentioned here that from table-15 of each of the annual PLFS reports <em>(please click <a href="https://im4change.org/upload/files/Annual%20Report%20PLFS%202020-21.pdf" title="https://im4change.org/upload/files/Annual%20Report%20PLFS%202020-21.pdf">here</a>, <a href="https://im4change.org/upload/files/Annual_Report_PLFS_2019_20.pdf" title="https://im4change.org/upload/files/Annual_Report_PLFS_2019_20.pdf">here</a>, <a href="https://im4change.org/docs/annual-report-on-periodic-labour-force-survey-july-2018-june-2019.pdf" title="https://im4change.org/docs/annual-report-on-periodic-labour-force-survey-july-2018-june-2019.pdf">here</a> and <a href="https://im4change.org/docs/216Annual_Report_PLFS_2017_18_31052019.pdf" title="https://im4change.org/docs/216Annual_Report_PLFS_2017_18_31052019.pdf">here</a> to access)</em>, the proportion of male and female workers for various categories of work is extracted, and the data is presented as table-1 and table-2 in this analysis.</p><p style="text-align:justify">The categories of workers, which have been considered in the present news alert, are as follows: </p><p style="text-align:justify"><strong>Self-employed </strong></p><p style="text-align:justify">- Code 11: worked in household enterprises <em>(self-employed) </em>as own-account worker <br />- Code 12: worked in household enterprises <em>(self-employed) </em>as an employer<br />- Code 21: worked in household enterprises <em>(self-employed) </em>as helper </p><p style="text-align:justify"><strong>Regular/salaried </strong></p><p style="text-align:justify">- Code 31: worked as regular wage/salaried employee </p><p style="text-align:justify"><strong>Casual Workers </strong></p><p style="text-align:justify">- Code 41: worked as casual labour in public works other than MGNREG public works<br />- Code 51: worked as casual labour in other types of works</p><p style="text-align:justify"><strong>Not working but seeking/available for work <em>(or unemployed)</em></strong></p><p style="text-align:justify">- Code 81: sought work or did not seek but was available for work <em>(for usual status approach)</em> </p><p style="text-align:justify"><strong>Neither working nor available for work <em>(or not in labour force)</em> </strong></p><p style="text-align:justify">- Code 97: others <em>(including beggars, prostitutes, etc.)</em></p><p style="text-align:justify"><strong>---</strong></p><p style="text-align:justify">In rural areas, the proportion of usual status male workers as self-employed <em>(sum of own-account workers and employers in household enterprises) </em>increased over various rounds of annual PLFS, from 34.7 percent in PLFS 2017-18 to 36.6 percent in PLFS 2020-21. In urban areas too, for the same category of self-employed, this proportion went up between PLFS 2018-19 and PLFS 2020-21. Please see table-1.</p><p style="text-align:justify"><strong>Table 1: Percentage of usual status workers in different categories of 15 years plus population: Male</strong></p><p style="text-align:justify"><img alt="" src="/upload/images/Table%201%20Percentage%20of%20usual%20status%20workers%20in%20different%20categories%20of%2015%20plus%20population%20Male.png" style="height:295px; width:860px" /></p><p style="text-align:justify"><em><strong>Source: </strong>Fourth Periodic Labour Force Survey Annual Report (July 2020-June 2021), please <a href="https://im4change.org/upload/files/Annual%20Report%20PLFS%202020-21.pdf" title="https://im4change.org/upload/files/Annual%20Report%20PLFS%202020-21.pdf">click here</a> to access </em></p><p style="text-align:justify"><em>Third Periodic Labour Force Survey Annual Report (July 2019-June 2020), please <a href="https://im4change.org/upload/files/Annual_Report_PLFS_2019_20.pdf" title="https://im4change.org/upload/files/Annual_Report_PLFS_2019_20.pdf">click here</a> to access </em></p><p style="text-align:justify"><em>Second Periodic Labour Force Survey Annual Report (July 2018-June 2019), please <a href="https://im4change.org/docs/annual-report-on-periodic-labour-force-survey-july-2018-june-2019.pdf" title="https://im4change.org/docs/annual-report-on-periodic-labour-force-survey-july-2018-june-2019.pdf">click here</a> to access </em></p><p style="text-align:justify"><em>First Periodic Labour Force Survey Annual Report (July 2017-June 2018), please <a href="https://im4change.org/docs/216Annual_Report_PLFS_2017_18_31052019.pdf" title="https://im4change.org/docs/216Annual_Report_PLFS_2017_18_31052019.pdf">click here</a> to access </em></p><p style="text-align:justify"><strong>---</strong></p><p style="text-align:justify">The proportion of usual status female workers as self-employed <em>(sum of own-account workers and employers in household enterprises) </em>climbed up over various rounds of annual PLFS, from 4.5 percent in PLFS 2017-18 to 7.9 percent in PLFS 2020-21. In urban areas too, for the same category of self-employed, this proportion went up between PLFS 2017-18 and PLFS 2020-21. Kindly take a look at table-2.</p><p style="text-align:justify"><strong>Table 2: Percentage of usual status workers in different categories of 15 years plus population: Female</strong></p><p style="text-align:justify"><img alt="" src="/upload/images/Table%202%20Percentage%20of%20usual%20status%20workers%20in%20different%20categories%20of%2015%20plus%20population%20Female.png" style="height:295px; width:861px" /></p><p style="text-align:justify"><em><strong>Source: </strong>Same as table-1</em><br /><strong>---</strong></p><p style="text-align:justify">As can be seen from table-1 of this analysis, although the proportion of usual status male workers as household enterprise helpers in rural areas came down slightly between PLFS 2017-18 and PLFS 2018-19, it gradually went up to 7.7 percent in PLFS 2019-20, and further to 8.2 percent in PLFS 2020-21. </p><p style="text-align:justify">In urban areas, after remaining unchanged for two successive rounds of annual PLFS, the proportion of usual status male workers as household enterprise helpers increased marginally to 3.1 percent in PLFS 2020-21. </p><p style="text-align:justify"><span style="background-color:#ffcc00">In contrast to male workers, the proportion of usual status female workers as household enterprise helpers in rural areas increased over various rounds of annual PLFS, from 9.1 percent in PLFS 2017-18 to 15.3 percent in PLFS 2020-21. Between PLFS 2018-19 and PLFS 2019-20, there was a noticeable jump in the proportion of usual status female workers as household enterprise helpers in such areas. In rural areas, compared to its male counterpart, a higher proportion of usual status female workers worked as household enterprise helpers during each of the annual PLFS rounds, from PLFS 2017-18 to PLFS 2020-21. The gap between the proportion of usual status female workers as household enterprise helpers and that of its male counterpart in rural areas expanded from 2.1 percentage points (p.p.) to 7.1 p.p. between PLFS 2017-18 and PLFS 2020-21. Kindly compare table-1 against table-2. </span></p><p style="text-align:justify">In urban areas, the proportion of usual status female workers as household enterprise helpers increased over various rounds of annual PLFS, from 1.8 percent in PLFS 2018-19 to 2.6 percent in PLFS 2020-21. </p><p style="text-align:justify">In rural areas, the proportion of usual status male workers as regular/salaried workers remained almost the same between PLFS 2017-18 and PLFS 2020-21. However, the proportion of usual status male workers as regular/salaried workers decreased from 33.0 percent to 31.7 percent between PLFS 2019-20 and PLFS 2020-21 in urban areas. Please see table-1.</p><p style="text-align:justify">In rural areas, the proportion of usual status female workers as regular/salaried workers increased over various annual PLFS rounds, from 2.5 percent in PLFS 2017-18 to 3.3 percent in PLFS 2020-21. In urban areas, at first the proportion of usual status female workers as regular/salaried workers grew from 9.5 percent in PLFS 2017-18 to 11.5 percent in PLFS 2019-20, but then it dropped to 10.6 percent in PLFS 2020-21.</p><p style="text-align:justify">In rural areas, the proportion of usual status male workers who worked as casual labour in other types of works <em>(i.e., excluding public works as well as MGNREGA) </em>remained at around 20 percent in various annual PLFS rounds. For the same category of workers in urban areas, this proportion marginally rose from 9.6 percent in PLFS 2018-19 to 9.8 percent in PLFS 2019-20, and further to 10.3 percent in 2020-21. Kindly consult table-1.</p><p style="text-align:justify">In rural areas, the proportion of usual status female workers who worked as casual labour in other types of works <em>(i.e., excluding public works as well as MGNREGA) </em>increased from 6.6 percent to 8.3 percent between PLFS 2018-19 and PLFS 2020-21. For the same category of workers in urban areas, this proportion remained the same in PLFS 2019-20 and PLFS 2020-21. Kindly look at table-2.</p><p style="text-align:justify">Please note that the <a href="https://im4change.org/upload/files/Annual%20Report%20PLFS%202020-21.pdf" title="https://im4change.org/upload/files/Annual%20Report%20PLFS%202020-21.pdf" title="https://im4change.org/upload/files/Annual%20Report%20PLFS%202020-21.pdf" title="https://im4change.org/upload/files/Annual%20Report%20PLFS%202020-21.pdf">Annual Report on PLFS 2020-2021</a> has also covered the period <em>(i.e., April-June, 2021) </em>when the state-wide lockdowns associated with the second wave of COVID-19 were imposed. The <a href="https://im4change.org/upload/files/Annual_Report_PLFS_2019_20.pdf" title="https://im4change.org/upload/files/Annual_Report_PLFS_2019_20.pdf" title="https://im4change.org/upload/files/Annual_Report_PLFS_2019_20.pdf" title="https://im4change.org/upload/files/Annual_Report_PLFS_2019_20.pdf">Annual Report on PLFS 2019-20</a> too had covered the period <em>(i.e., April-June, 2020)</em> when the countrywide lockdown <em>(associated with the first year of the COVID-19 pandemic) </em>was imposed. </p><p style="text-align:justify"><em><strong>References</strong></em></p><p style="text-align:justify">Fourth Periodic Labour Force Survey Annual Report (July 2020-June 2021), released in June 2022, National Statistical Office (NSO), Ministry of Statistics and Programme Implementation (MoSPI), <a href="https://im4change.org/upload/files/Annual%20Report%20PLFS%202020-21.pdf" title="https://im4change.org/upload/files/Annual%20Report%20PLFS%202020-21.pdf">click here</a> to access </p><p style="text-align:justify">Third Periodic Labour Force Survey Annual Report (July 2019-June 2020), released in July 2021, National Statistical Office (NSO), Ministry of Statistics and Programme Implementation (MoSPI), please <a href="https://im4change.org/upload/files/Annual_Report_PLFS_2019_20.pdf" title="https://im4change.org/upload/files/Annual_Report_PLFS_2019_20.pdf">click here</a> to access </p><p style="text-align:justify">Second Periodic Labour Force Survey Annual Report (July 2018-June 2019), released in June 2020, National Statistical Office (NSO), Ministry of Statistics and Programme Implementation (MoSPI), please <a href="https://im4change.org/docs/annual-report-on-periodic-labour-force-survey-july-2018-june-2019.pdf" title="https://im4change.org/docs/annual-report-on-periodic-labour-force-survey-july-2018-june-2019.pdf">click here</a> to access </p><p style="text-align:justify">First Periodic Labour Force Survey Annual Report (July 2017-June 2018), released in May 2019, National Statistical Office (NSO), Ministry of Statistics and Programme Implementation (MoSPI), please <a href="https://im4change.org/docs/216Annual_Report_PLFS_2017_18_31052019.pdf" title="https://im4change.org/docs/216Annual_Report_PLFS_2017_18_31052019.pdf">click here</a> to access </p><p style="text-align:justify">News alert: Quality of work matters, and not just job creation, Inclusive Media for Change, Published on: Sep 26, 2022, please <a href="https://im4change.org/news-alerts-57/plfs-unemployment-rate-labour-force-participation-rate-worker-population-ratio-decent-work-social-security-quality-of-work-gainful-employment.html" title="https://im4change.org/news-alerts-57/plfs-unemployment-rate-labour-force-participation-rate-worker-population-ratio-decent-work-social-security-quality-of-work-gainful-employment.html">click here</a> to access</p><p style="text-align:justify">What’s behind the ‘improvement’ in employment situation in labour force survey report -PC Mohanan, ThePrint, 21 August, 2021, please <a href="https://theprint.in/opinion/what-is-behind-the-improvement-in-employment-situation/719674/" title="https://theprint.in/opinion/what-is-behind-the-improvement-in-employment-situation/719674/">click here</a> to access </p><p style="text-align:justify"><br /><strong>Image Courtesy: Inclusive Media for Change/ Himanshu Joshi</strong></p>'
$lang = 'English'
$SITE_URL = 'https://im4change.in/'
$site_title = 'im4change'
$adminprix = 'admin'
include - APP/Template/Layout/printlayout.ctp, line 8
Cake\View\View::_evaluate() - CORE/src/View/View.php, line 1413
Cake\View\View::_render() - CORE/src/View/View.php, line 1374
Cake\View\View::renderLayout() - CORE/src/View/View.php, line 927
Cake\View\View::render() - CORE/src/View/View.php, line 885
Cake\Controller\Controller::render() - CORE/src/Controller/Controller.php, line 791
Cake\Http\ActionDispatcher::_invoke() - CORE/src/Http/ActionDispatcher.php, line 126
Cake\Http\ActionDispatcher::dispatch() - CORE/src/Http/ActionDispatcher.php, line 94
Cake\Http\BaseApplication::__invoke() - CORE/src/Http/BaseApplication.php, line 235
Cake\Http\Runner::__invoke() - CORE/src/Http/Runner.php, line 65
Cake\Routing\Middleware\RoutingMiddleware::__invoke() - CORE/src/Routing/Middleware/RoutingMiddleware.php, line 162
Cake\Http\Runner::__invoke() - CORE/src/Http/Runner.php, line 65
Cake\Routing\Middleware\AssetMiddleware::__invoke() - CORE/src/Routing/Middleware/AssetMiddleware.php, line 88
Cake\Http\Runner::__invoke() - CORE/src/Http/Runner.php, line 65
Cake\Error\Middleware\ErrorHandlerMiddleware::__invoke() - CORE/src/Error/Middleware/ErrorHandlerMiddleware.php, line 96
Cake\Http\Runner::__invoke() - CORE/src/Http/Runner.php, line 65
Cake\Http\Runner::run() - CORE/src/Http/Runner.php, line 51
news-alerts-57/how-well-did-the-women-worker-fare-during-the-pandemic-years-plfs-reports-provide-some-mixed-answers-casual-workers-self-employed-unpaid-helpers-family-enterprises-regular-wage-salaried.html"/>
NEWS ALERTS | How well did the women workers fare during the pandemic years? The yearly PLFS reports provide some mixed answers. | Im4change.org
How well did the women workers fare during the pandemic years? The yearly PLFS reports provide some mixed answers.
Do you want a job that does not pay you at all? The answer will be surely 'no' for most of us. And yet, in our previous analysis, it was found that the proportion of 'helpers in household enterprises' among the total number of workers grew over various rounds of annual PLFS (Periodic Labour Force Survey), from 13.3 percent to 15.9 percent between PLFS 2018-19 and PLFS 2019-20, and then soared further to 17.3 percent in PLFS 2020-21.
The most elemental question that comes to one’s mind is which gender took up such unpaid, low-quality jobs during the pandemic years and whether there was a rural-urban divide noticed in that trend.
Without further ado, it needs to be mentioned here that from table-15 of each of the annual PLFS reports (please click here, here, here and here to access), the proportion of male and female workers for various categories of work is extracted, and the data is presented as table-1 and table-2 in this analysis.
The categories of workers, which have been considered in the present news alert, are as follows:
Self-employed
- Code 11: worked in household enterprises (self-employed) as own-account worker - Code 12: worked in household enterprises (self-employed) as an employer - Code 21: worked in household enterprises (self-employed) as helper
Regular/salaried
- Code 31: worked as regular wage/salaried employee
Casual Workers
- Code 41: worked as casual labour in public works other than MGNREG public works - Code 51: worked as casual labour in other types of works
Not working but seeking/available for work (or unemployed)
- Code 81: sought work or did not seek but was available for work (for usual status approach)
Neither working nor available for work (or not in labour force)
In rural areas, the proportion of usual status male workers as self-employed (sum of own-account workers and employers in household enterprises) increased over various rounds of annual PLFS, from 34.7 percent in PLFS 2017-18 to 36.6 percent in PLFS 2020-21. In urban areas too, for the same category of self-employed, this proportion went up between PLFS 2018-19 and PLFS 2020-21. Please see table-1.
Table 1: Percentage of usual status workers in different categories of 15 years plus population: Male
Source: Fourth Periodic Labour Force Survey Annual Report (July 2020-June 2021), please click here to access
Third Periodic Labour Force Survey Annual Report (July 2019-June 2020), please click here to access
Second Periodic Labour Force Survey Annual Report (July 2018-June 2019), please click here to access
First Periodic Labour Force Survey Annual Report (July 2017-June 2018), please click here to access
---
The proportion of usual status female workers as self-employed (sum of own-account workers and employers in household enterprises) climbed up over various rounds of annual PLFS, from 4.5 percent in PLFS 2017-18 to 7.9 percent in PLFS 2020-21. In urban areas too, for the same category of self-employed, this proportion went up between PLFS 2017-18 and PLFS 2020-21. Kindly take a look at table-2.
Table 2: Percentage of usual status workers in different categories of 15 years plus population: Female
Source: Same as table-1 ---
As can be seen from table-1 of this analysis, although the proportion of usual status male workers as household enterprise helpers in rural areas came down slightly between PLFS 2017-18 and PLFS 2018-19, it gradually went up to 7.7 percent in PLFS 2019-20, and further to 8.2 percent in PLFS 2020-21.
In urban areas, after remaining unchanged for two successive rounds of annual PLFS, the proportion of usual status male workers as household enterprise helpers increased marginally to 3.1 percent in PLFS 2020-21.
In contrast to male workers, the proportion of usual status female workers as household enterprise helpers in rural areas increased over various rounds of annual PLFS, from 9.1 percent in PLFS 2017-18 to 15.3 percent in PLFS 2020-21. Between PLFS 2018-19 and PLFS 2019-20, there was a noticeable jump in the proportion of usual status female workers as household enterprise helpers in such areas. In rural areas, compared to its male counterpart, a higher proportion of usual status female workers worked as household enterprise helpers during each of the annual PLFS rounds, from PLFS 2017-18 to PLFS 2020-21. The gap between the proportion of usual status female workers as household enterprise helpers and that of its male counterpart in rural areas expanded from 2.1 percentage points (p.p.) to 7.1 p.p. between PLFS 2017-18 and PLFS 2020-21. Kindly compare table-1 against table-2.
In urban areas, the proportion of usual status female workers as household enterprise helpers increased over various rounds of annual PLFS, from 1.8 percent in PLFS 2018-19 to 2.6 percent in PLFS 2020-21.
In rural areas, the proportion of usual status male workers as regular/salaried workers remained almost the same between PLFS 2017-18 and PLFS 2020-21. However, the proportion of usual status male workers as regular/salaried workers decreased from 33.0 percent to 31.7 percent between PLFS 2019-20 and PLFS 2020-21 in urban areas. Please see table-1.
In rural areas, the proportion of usual status female workers as regular/salaried workers increased over various annual PLFS rounds, from 2.5 percent in PLFS 2017-18 to 3.3 percent in PLFS 2020-21. In urban areas, at first the proportion of usual status female workers as regular/salaried workers grew from 9.5 percent in PLFS 2017-18 to 11.5 percent in PLFS 2019-20, but then it dropped to 10.6 percent in PLFS 2020-21.
In rural areas, the proportion of usual status male workers who worked as casual labour in other types of works (i.e., excluding public works as well as MGNREGA) remained at around 20 percent in various annual PLFS rounds. For the same category of workers in urban areas, this proportion marginally rose from 9.6 percent in PLFS 2018-19 to 9.8 percent in PLFS 2019-20, and further to 10.3 percent in 2020-21. Kindly consult table-1.
In rural areas, the proportion of usual status female workers who worked as casual labour in other types of works (i.e., excluding public works as well as MGNREGA) increased from 6.6 percent to 8.3 percent between PLFS 2018-19 and PLFS 2020-21. For the same category of workers in urban areas, this proportion remained the same in PLFS 2019-20 and PLFS 2020-21. Kindly look at table-2.
Please note that the Annual Report on PLFS 2020-2021 has also covered the period (i.e., April-June, 2021) when the state-wide lockdowns associated with the second wave of COVID-19 were imposed. The Annual Report on PLFS 2019-20 too had covered the period (i.e., April-June, 2020) when the countrywide lockdown (associated with the first year of the COVID-19 pandemic) was imposed.
References
Fourth Periodic Labour Force Survey Annual Report (July 2020-June 2021), released in June 2022, National Statistical Office (NSO), Ministry of Statistics and Programme Implementation (MoSPI), click here to access
Third Periodic Labour Force Survey Annual Report (July 2019-June 2020), released in July 2021, National Statistical Office (NSO), Ministry of Statistics and Programme Implementation (MoSPI), please click here to access
Second Periodic Labour Force Survey Annual Report (July 2018-June 2019), released in June 2020, National Statistical Office (NSO), Ministry of Statistics and Programme Implementation (MoSPI), please click here to access
First Periodic Labour Force Survey Annual Report (July 2017-June 2018), released in May 2019, National Statistical Office (NSO), Ministry of Statistics and Programme Implementation (MoSPI), please click here to access
News alert: Quality of work matters, and not just job creation, Inclusive Media for Change, Published on: Sep 26, 2022, please click here to access
What’s behind the ‘improvement’ in employment situation in labour force survey report -PC Mohanan, ThePrint, 21 August, 2021, please click here to access
Image Courtesy: Inclusive Media for Change/ Himanshu Joshi