Deprecated (16384): The ArrayAccess methods will be removed in 4.0.0.Use getParam(), getData() and getQuery() instead. - /home/brlfuser/public_html/src/Controller/ArtileDetailController.php, line: 73
You can disable deprecation warnings by setting `Error.errorLevel` to `E_ALL & ~E_USER_DEPRECATED` in your config/app.php. [CORE/src/Core/functions.php, line 311]
deprecationWarning - CORE/src/Core/functions.php, line 311
Cake\Http\ServerRequest::offsetGet() - CORE/src/Http/ServerRequest.php, line 2421
App\Controller\ArtileDetailController::printArticle() - APP/Controller/ArtileDetailController.php, line 73
Cake\Controller\Controller::invokeAction() - CORE/src/Controller/Controller.php, line 610
Cake\Http\ActionDispatcher::_invoke() - CORE/src/Http/ActionDispatcher.php, line 120
Cake\Http\ActionDispatcher::dispatch() - CORE/src/Http/ActionDispatcher.php, line 94
Cake\Http\BaseApplication::__invoke() - CORE/src/Http/BaseApplication.php, line 235
Cake\Http\Runner::__invoke() - CORE/src/Http/Runner.php, line 65
Cake\Routing\Middleware\RoutingMiddleware::__invoke() - CORE/src/Routing/Middleware/RoutingMiddleware.php, line 162
Cake\Http\Runner::__invoke() - CORE/src/Http/Runner.php, line 65
Cake\Routing\Middleware\AssetMiddleware::__invoke() - CORE/src/Routing/Middleware/AssetMiddleware.php, line 88
Cake\Http\Runner::__invoke() - CORE/src/Http/Runner.php, line 65
Cake\Error\Middleware\ErrorHandlerMiddleware::__invoke() - CORE/src/Error/Middleware/ErrorHandlerMiddleware.php, line 96
Cake\Http\Runner::__invoke() - CORE/src/Http/Runner.php, line 65
Cake\Http\Runner::run() - CORE/src/Http/Runner.php, line 51
Cake\Http\Server::run() - CORE/src/Http/Server.php, line 98
Deprecated (16384): The ArrayAccess methods will be removed in 4.0.0.Use getParam(), getData() and getQuery() instead. - /home/brlfuser/public_html/src/Controller/ArtileDetailController.php, line: 74
You can disable deprecation warnings by setting `Error.errorLevel` to `E_ALL & ~E_USER_DEPRECATED` in your config/app.php. [CORE/src/Core/functions.php, line 311]
deprecationWarning - CORE/src/Core/functions.php, line 311
Cake\Http\ServerRequest::offsetGet() - CORE/src/Http/ServerRequest.php, line 2421
App\Controller\ArtileDetailController::printArticle() - APP/Controller/ArtileDetailController.php, line 74
Cake\Controller\Controller::invokeAction() - CORE/src/Controller/Controller.php, line 610
Cake\Http\ActionDispatcher::_invoke() - CORE/src/Http/ActionDispatcher.php, line 120
Cake\Http\ActionDispatcher::dispatch() - CORE/src/Http/ActionDispatcher.php, line 94
Cake\Http\BaseApplication::__invoke() - CORE/src/Http/BaseApplication.php, line 235
Cake\Http\Runner::__invoke() - CORE/src/Http/Runner.php, line 65
Cake\Routing\Middleware\RoutingMiddleware::__invoke() - CORE/src/Routing/Middleware/RoutingMiddleware.php, line 162
Cake\Http\Runner::__invoke() - CORE/src/Http/Runner.php, line 65
Cake\Routing\Middleware\AssetMiddleware::__invoke() - CORE/src/Routing/Middleware/AssetMiddleware.php, line 88
Cake\Http\Runner::__invoke() - CORE/src/Http/Runner.php, line 65
Cake\Error\Middleware\ErrorHandlerMiddleware::__invoke() - CORE/src/Error/Middleware/ErrorHandlerMiddleware.php, line 96
Cake\Http\Runner::__invoke() - CORE/src/Http/Runner.php, line 65
Cake\Http\Runner::run() - CORE/src/Http/Runner.php, line 51
Cake\Http\Server::run() - CORE/src/Http/Server.php, line 98
Warning (512): Unable to emit headers. Headers sent in file=/home/brlfuser/public_html/vendor/cakephp/cakephp/src/Error/Debugger.php line=853 [CORE/src/Http/ResponseEmitter.php, line 48]
if (Configure::read('debug')) {
trigger_error($message, E_USER_WARNING);
} else {
$response = object(Cake\Http\Response) {
'status' => (int) 200,
'contentType' => 'text/html',
'headers' => [
'Content-Type' => [
[maximum depth reached]
]
],
'file' => null,
'fileRange' => [],
'cookies' => object(Cake\Http\Cookie\CookieCollection) {},
'cacheDirectives' => [],
'body' => '<!DOCTYPE html PUBLIC "-//W3C//DTD XHTML 1.0 Transitional//EN"
"http://www.w3.org/TR/xhtml1/DTD/xhtml1-transitional.dtd">
<html xmlns="http://www.w3.org/1999/xhtml">
<head>
<link rel="canonical" href="https://im4change.in/<pre class="cake-error"><a href="javascript:void(0);" onclick="document.getElementById('cakeErr67eb7b2c4e81e-trace').style.display = (document.getElementById('cakeErr67eb7b2c4e81e-trace').style.display == 'none' ? '' : 'none');"><b>Notice</b> (8)</a>: Undefined variable: urlPrefix [<b>APP/Template/Layout/printlayout.ctp</b>, line <b>8</b>]<div id="cakeErr67eb7b2c4e81e-trace" class="cake-stack-trace" style="display: none;"><a href="javascript:void(0);" onclick="document.getElementById('cakeErr67eb7b2c4e81e-code').style.display = (document.getElementById('cakeErr67eb7b2c4e81e-code').style.display == 'none' ? '' : 'none')">Code</a> <a href="javascript:void(0);" onclick="document.getElementById('cakeErr67eb7b2c4e81e-context').style.display = (document.getElementById('cakeErr67eb7b2c4e81e-context').style.display == 'none' ? '' : 'none')">Context</a><pre id="cakeErr67eb7b2c4e81e-code" class="cake-code-dump" style="display: none;"><code><span style="color: #000000"><span style="color: #0000BB"></span><span style="color: #007700"><</span><span style="color: #0000BB">head</span><span style="color: #007700">>
</span></span></code>
<span class="code-highlight"><code><span style="color: #000000"> <link rel="canonical" href="<span style="color: #0000BB"><?php </span><span style="color: #007700">echo </span><span style="color: #0000BB">Configure</span><span style="color: #007700">::</span><span style="color: #0000BB">read</span><span style="color: #007700">(</span><span style="color: #DD0000">'SITE_URL'</span><span style="color: #007700">); </span><span style="color: #0000BB">?><?php </span><span style="color: #007700">echo </span><span style="color: #0000BB">$urlPrefix</span><span style="color: #007700">;</span><span style="color: #0000BB">?><?php </span><span style="color: #007700">echo </span><span style="color: #0000BB">$article_current</span><span style="color: #007700">-></span><span style="color: #0000BB">category</span><span style="color: #007700">-></span><span style="color: #0000BB">slug</span><span style="color: #007700">; </span><span style="color: #0000BB">?></span>/<span style="color: #0000BB"><?php </span><span style="color: #007700">echo </span><span style="color: #0000BB">$article_current</span><span style="color: #007700">-></span><span style="color: #0000BB">seo_url</span><span style="color: #007700">; </span><span style="color: #0000BB">?></span>.html"/>
</span></code></span>
<code><span style="color: #000000"><span style="color: #0000BB"> </span><span style="color: #007700"><</span><span style="color: #0000BB">meta http</span><span style="color: #007700">-</span><span style="color: #0000BB">equiv</span><span style="color: #007700">=</span><span style="color: #DD0000">"Content-Type" </span><span style="color: #0000BB">content</span><span style="color: #007700">=</span><span style="color: #DD0000">"text/html; charset=utf-8"</span><span style="color: #007700">/>
</span></span></code></pre><pre id="cakeErr67eb7b2c4e81e-context" class="cake-context" style="display: none;">$viewFile = '/home/brlfuser/public_html/src/Template/Layout/printlayout.ctp'
$dataForView = [
'article_current' => object(App\Model\Entity\Article) {
'id' => (int) 64981,
'title' => 'NSSO Survey: Only 39.1% of all Households have Drinking Water Within Dwelling, 46.7% of Rural Households use Firewood for Cooking',
'subheading' => null,
'description' => '<p>The National Sample Survey Organization&#39;s <a href="https://www.mospi.gov.in/sites/default/files/publication_reports/MultipleIndicatorSurveyinIndiaf_0.pdf">Multiple Indicator Survey</a> - part of the 78th round - has revealed that only 39.1 percent of all Indian households have access to drinking water within the &nbsp;dwelling. When it come to cooking, 46.7% of rural households use firewood.&nbsp;</p>
<p>These are some of the findings of the survey whose purpose was to collect data about the indicators of Sustainable Development Goals. Data was collected for households and population; drinking water and sanitation; household energy use; education and ICT skills; mobile/broadband and mass media; financial inclusion and indebtedness; birth registration; purchase/construction of new house; migration.</p>
<p>The key findings are:</p>
<ul>
<li>&nbsp;About 95.0 percent of the persons in the rural areas and about 97.2 percent of the persons in the urban areas used &lsquo;improved source of drinking water&#39;.&nbsp;</li>
<li>&nbsp;About 56.3 percent of the persons in the rural areas and about 76.3 percent of the persons in the urban areas used improved source of drinking water located in the household premises which was sufficiently available throughout the year. &nbsp;</li>
<li>Among the persons who had reported access to latrine and hand washing facility, about 73.3 percent of the persons in the rural areas and about 81.4 percent of the persons in the urban areas had exclusive access to improved latrine and hand washing facilities with water and soap/detergent within the household premises.</li>
<li>About 49.8 percent of households in the rural areas and about 92.0 percent of households in the urban areas used clean fuel as primary source of energy for cooking. Here clean fuel refers to LPG, other natural gas, gobar gas, other biogas, electricity.</li>
<li>&nbsp;About 33.0 percent of persons in rural areas and about 39.4 percent of persons in urban areas of age 15-29 years were in formal and non-formal education and training for the 12 months preceding the survey.</li>
<li>About 67.8 percent of persons of age 18 years and above in rural areas and about 83.7 percent of persons of age 18 years and above in urban areas used mobile telephone with active sim card during the three months preceding the date of the survey.</li>
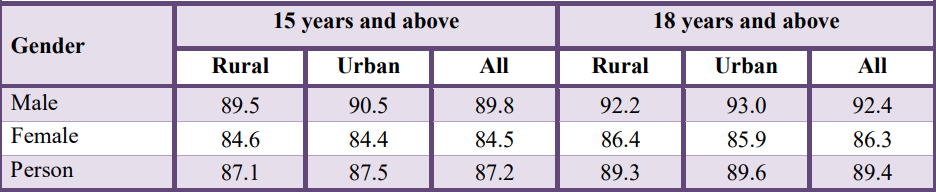
<li>Among the persons of age 18 years and above, about 89.3 percent of persons in rural areas and about 89.6 percent of persons in urban areas had an account individually or jointly in any bank/ other financial institution/ mobile money service provider.</li>
<li>Out of 1,00,000 persons of age 18 years and above, 16,223 persons in rural areas and 14,889 persons in urban areas were indebted to any institutional/non-institutional agency as on the date of survey.</li>
<li>About 92.5 percent of households in rural areas reported availability of all-weather roads within 2 km from the place of living.</li>
<li>About 11.2 percent of households in rural areas and about 7.2 percent of households in urban areas purchased/constructed any new house/flat for residential purpose after 31.03.2014. &nbsp;</li>
</ul>
<p>&nbsp;</p>
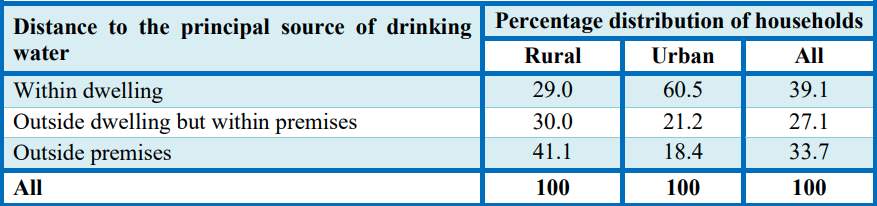
<p><strong>Table 1:&nbsp;Percentage distribution of households by distance to the principal source of drinking water</strong></p>
<p><img alt="" src="/upload/images/Table%201%20Principle%20source%20of%20drinking%20water.PNG" style="height:206px; width:877px" /></p>
<p>Source:&nbsp;NSS Report No. 589: Multiple Indicator Survey in India, Ministry of Statistics and Programme Implementation</p>
<p>&nbsp;</p>
<p>The table above reveals that 60.5 percent of urban houselholds and 29 percent of rural households have access to drinking water within the dwelling. The all-India average works out to 39.1 percent. 21.2 percent of urban and 30 percent of rural households&#39; primary source of drinking water is outside the dwelling, but within the premesis of residence, whereas 18.4 percent of urban and 41.1 percent of rural households have to step outside the premesis to get their water.&nbsp;&nbsp;</p>
<p>&nbsp;</p>
<p><strong>Donut Chart</strong></p>
<p><iframe class="flourish-embed-iframe" frameborder="0" scrolling="no" src="https://flo.uri.sh/visualisation/13626204/embed" style="width:100%;height:600px;" title="Interactive or visual content"></iframe></p>
<div style="margin-top:4px!important; text-align:right!important; width:100%!"><a class="flourish-credit" href="https://public.flourish.studio/visualisation/13626204/?utm_source=embed&amp;utm_campaign=visualisation/13626204" style="text-decoration:none!important" target="_top"><img alt="Made with Flourish" src="https://public.flourish.studio/resources/made_with_flourish.svg" style="border:none!important; height:16px!important; margin:0!important; width:105px!important" /> </a></div>
<p>&nbsp;</p>
<p>A household was considered to have&nbsp;access to a latrine if majority of the household members had the facility of using latrine irrespective of whether it was used by them or not. Information on access to latrine was collected in terms of six categories:&nbsp;(i) exclusive use of household, (ii) common use of households in the building, (iii) public/community use without payment, (iv) public/community use with payment, (v) others and (vi) no latrine. The chart above gives the average of urban and rural households. Breaking it down into the two categories, 80.8 percent of urban households had exclusive use of a latrine, while among rural households that number was just 68.8 percent. Significantly, 21.3 percent of rural households had no access to a latrine.&nbsp;</p>
<p>&nbsp;</p>
<p><strong>Chart 1: Percentage distribution of households by primary source of energy used for cooking</strong></p>
<p><iframe class="flourish-embed-iframe" frameborder="0" scrolling="no" src="https://flo.uri.sh/visualisation/13625833/embed" style="width:100%;height:600px;" title="Interactive or visual content"></iframe></p>
<div style="margin-top:4px!important; text-align:right!important; width:100%!"><a class="flourish-credit" href="https://public.flourish.studio/visualisation/13625833/?utm_source=embed&amp;utm_campaign=visualisation/13625833" style="text-decoration:none!important" target="_top"><img alt="Made with Flourish" src="https://public.flourish.studio/resources/made_with_flourish.svg" style="border:none!important; height:16px!important; margin:0!important; width:105px!important" /> </a></div>
<p>&nbsp;</p>
<p>&nbsp;</p>
<p><strong>Chart 2: Persons aged 18 and above who have an active mobile and SIM&nbsp;card in the&nbsp;three months prior to survey</strong></p>
<p><iframe class="flourish-embed-iframe" frameborder="0" scrolling="no" src="https://flo.uri.sh/visualisation/13626482/embed" style="width:100%;height:600px;" title="Interactive or visual content"></iframe></p>
<div style="margin-top:4px!important; text-align:right!important; width:100%!"><a class="flourish-credit" href="https://public.flourish.studio/visualisation/13626482/?utm_source=embed&amp;utm_campaign=visualisation/13626482" style="text-decoration:none!important" target="_top"><img alt="Made with Flourish" src="https://public.flourish.studio/resources/made_with_flourish.svg" style="border:none!important; height:16px!important; margin:0!important; width:105px!important" /> </a></div>
<p>&nbsp;</p>
<p>&nbsp;</p>
<p><strong>Table 2:&nbsp;Percentage of persons who have an account individually or jointly in any bank/ other financial institution/mobile money service provider</strong></p>
<p><img alt="" src="/upload/images/tablw%202%20persons%20with%20bank%20account.PNG" style="height:192px; width:936px" /></p>
<p>&nbsp;</p>
<p>The survey was initially planned for January-December, 2020, but due to Covid 19 pandemic, but the the data collection was extended to August 2021. For the central sample, the survey was spread over 14,266 first stage units (8,469 in rural areas and 5,797 in urban areas) covering 2,76,409 sample households (1,64,529 in rural areas and 1,11,880 in urban areas).&nbsp;</p>
<p>Please click here to access the<a href="/upload/files/MultipleIndicatorSurveyinIndiaf_0.pdf"> NSSO Report</a><br />
Photo Credit:&nbsp;Salahuddin, <a href="https://www.downtoearth.org.in/news/water/nearly-80-per-cent-indian-households-without-piped-water-connection-67928">Down to Earth</a></p>
<p>References<br />
NSS Report No. 589: Multiple Indicator Survey in India (78th round), Ministry of Statistics and Programme Implementation, March 2023</p>
',
'credit_writer' => 'National Sample Survey Organization, https://www.mospi.gov.in/sites/default/files/publication_reports/MultipleIndicatorSurveyinIndiaf_0.pdf',
'article_img' => '0.79217900_1574689453_dig015840.jpg',
'article_img_thumb' => '0.79217900_1574689453_dig015840.jpg',
'status' => (int) 1,
'show_on_home' => (int) 1,
'lang' => 'EN',
'category_id' => (int) 4,
'tag_keyword' => '',
'seo_url' => 'nsso-survey-only-39-1-of-all-households-have-drinking-water-within-dwelling-46-7-of-rural-households-use-firewood-for-cooking',
'meta_title' => '',
'meta_keywords' => '',
'meta_description' => '',
'noindex' => (int) 1,
'publish_date' => object(Cake\I18n\FrozenDate) {},
'most_visit_section_id' => null,
'article_big_img' => null,
'liveid' => null,
'created' => object(Cake\I18n\FrozenTime) {},
'modified' => object(Cake\I18n\FrozenTime) {},
'edate' => '',
'tags' => [
[maximum depth reached]
],
'category' => object(App\Model\Entity\Category) {},
'[new]' => false,
'[accessible]' => [
[maximum depth reached]
],
'[dirty]' => [[maximum depth reached]],
'[original]' => [[maximum depth reached]],
'[virtual]' => [[maximum depth reached]],
'[hasErrors]' => false,
'[errors]' => [[maximum depth reached]],
'[invalid]' => [[maximum depth reached]],
'[repository]' => 'Articles'
},
'articleid' => (int) 64981,
'metaTitle' => 'NEWS ALERTS | NSSO Survey: Only 39.1% of all Households have Drinking Water Within Dwelling, 46.7% of Rural Households use Firewood for Cooking',
'metaKeywords' => '78th Round,Drinking Water,Education,Financial Inclusion,Household Energy Use,Mass Media,Migration,Mobile Broadband,Multiple Indicator Survey,National Sample Survey,NSSO,Sanitation',
'metaDesc' => 'The National Sample Survey Organization&#39;s Multiple Indicator Survey - part of the 78th round - has revealed that only 39.1 percent of all Indian households have access to drinking water within the &nbsp;dwelling. When it come to cooking, 46.7% of...',
'disp' => '<p>The National Sample Survey Organization&#39;s <a href="https://www.mospi.gov.in/sites/default/files/publication_reports/MultipleIndicatorSurveyinIndiaf_0.pdf" title="https://www.mospi.gov.in/sites/default/files/publication_reports/MultipleIndicatorSurveyinIndiaf_0.pdf">Multiple Indicator Survey</a> - part of the 78th round - has revealed that only 39.1 percent of all Indian households have access to drinking water within the &nbsp;dwelling. When it come to cooking, 46.7% of rural households use firewood.&nbsp;</p><p>These are some of the findings of the survey whose purpose was to collect data about the indicators of Sustainable Development Goals. Data was collected for households and population; drinking water and sanitation; household energy use; education and ICT skills; mobile/broadband and mass media; financial inclusion and indebtedness; birth registration; purchase/construction of new house; migration.</p><p>The key findings are:</p><ul><li>&nbsp;About 95.0 percent of the persons in the rural areas and about 97.2 percent of the persons in the urban areas used &lsquo;improved source of drinking water&#39;.&nbsp;</li><li>&nbsp;About 56.3 percent of the persons in the rural areas and about 76.3 percent of the persons in the urban areas used improved source of drinking water located in the household premises which was sufficiently available throughout the year. &nbsp;</li><li>Among the persons who had reported access to latrine and hand washing facility, about 73.3 percent of the persons in the rural areas and about 81.4 percent of the persons in the urban areas had exclusive access to improved latrine and hand washing facilities with water and soap/detergent within the household premises.</li><li>About 49.8 percent of households in the rural areas and about 92.0 percent of households in the urban areas used clean fuel as primary source of energy for cooking. Here clean fuel refers to LPG, other natural gas, gobar gas, other biogas, electricity.</li><li>&nbsp;About 33.0 percent of persons in rural areas and about 39.4 percent of persons in urban areas of age 15-29 years were in formal and non-formal education and training for the 12 months preceding the survey.</li><li>About 67.8 percent of persons of age 18 years and above in rural areas and about 83.7 percent of persons of age 18 years and above in urban areas used mobile telephone with active sim card during the three months preceding the date of the survey.</li><li>Among the persons of age 18 years and above, about 89.3 percent of persons in rural areas and about 89.6 percent of persons in urban areas had an account individually or jointly in any bank/ other financial institution/ mobile money service provider.</li><li>Out of 1,00,000 persons of age 18 years and above, 16,223 persons in rural areas and 14,889 persons in urban areas were indebted to any institutional/non-institutional agency as on the date of survey.</li><li>About 92.5 percent of households in rural areas reported availability of all-weather roads within 2 km from the place of living.</li><li>About 11.2 percent of households in rural areas and about 7.2 percent of households in urban areas purchased/constructed any new house/flat for residential purpose after 31.03.2014. &nbsp;</li></ul><p>&nbsp;</p><p><strong>Table 1:&nbsp;Percentage distribution of households by distance to the principal source of drinking water</strong></p><p><img alt="" src="/upload/images/Table%201%20Principle%20source%20of%20drinking%20water.PNG" style="height:206px; width:877px" /></p><p>Source:&nbsp;NSS Report No. 589: Multiple Indicator Survey in India, Ministry of Statistics and Programme Implementation</p><p>&nbsp;</p><p>The table above reveals that 60.5 percent of urban houselholds and 29 percent of rural households have access to drinking water within the dwelling. The all-India average works out to 39.1 percent. 21.2 percent of urban and 30 percent of rural households&#39; primary source of drinking water is outside the dwelling, but within the premesis of residence, whereas 18.4 percent of urban and 41.1 percent of rural households have to step outside the premesis to get their water.&nbsp;&nbsp;</p><p>&nbsp;</p><p><strong>Donut Chart</strong></p><p><iframe class="flourish-embed-iframe" frameborder="0" scrolling="no" src="https://flo.uri.sh/visualisation/13626204/embed" style="width:100%;height:600px;" title="Interactive or visual content"></iframe></p><div style="margin-top:4px!important; text-align:right!important; width:100%!"><a href="https://public.flourish.studio/visualisation/13626204/?utm_source=embed&amp;utm_campaign=visualisation/13626204" style="text-decoration:none!important" target="_top" title="https://public.flourish.studio/visualisation/13626204/?utm_source=embed&amp;utm_campaign=visualisation/13626204" style="text-decoration:none!important" target="_top"> </a></div><p>&nbsp;</p><p>A household was considered to have&nbsp;access to a latrine if majority of the household members had the facility of using latrine irrespective of whether it was used by them or not. Information on access to latrine was collected in terms of six categories:&nbsp;(i) exclusive use of household, (ii) common use of households in the building, (iii) public/community use without payment, (iv) public/community use with payment, (v) others and (vi) no latrine. The chart above gives the average of urban and rural households. Breaking it down into the two categories, 80.8 percent of urban households had exclusive use of a latrine, while among rural households that number was just 68.8 percent. Significantly, 21.3 percent of rural households had no access to a latrine.&nbsp;</p><p>&nbsp;</p><p><strong>Chart 1: Percentage distribution of households by primary source of energy used for cooking</strong></p><p><iframe class="flourish-embed-iframe" frameborder="0" scrolling="no" src="https://flo.uri.sh/visualisation/13625833/embed" style="width:100%;height:600px;" title="Interactive or visual content"></iframe></p><div style="margin-top:4px!important; text-align:right!important; width:100%!"><a href="https://public.flourish.studio/visualisation/13625833/?utm_source=embed&amp;utm_campaign=visualisation/13625833" style="text-decoration:none!important" target="_top" title="https://public.flourish.studio/visualisation/13625833/?utm_source=embed&amp;utm_campaign=visualisation/13625833" style="text-decoration:none!important" target="_top"> </a></div><p>&nbsp;</p><p>&nbsp;</p><p><strong>Chart 2: Persons aged 18 and above who have an active mobile and SIM&nbsp;card in the&nbsp;three months prior to survey</strong></p><p><iframe class="flourish-embed-iframe" frameborder="0" scrolling="no" src="https://flo.uri.sh/visualisation/13626482/embed" style="width:100%;height:600px;" title="Interactive or visual content"></iframe></p><div style="margin-top:4px!important; text-align:right!important; width:100%!"><a href="https://public.flourish.studio/visualisation/13626482/?utm_source=embed&amp;utm_campaign=visualisation/13626482" style="text-decoration:none!important" target="_top" title="https://public.flourish.studio/visualisation/13626482/?utm_source=embed&amp;utm_campaign=visualisation/13626482" style="text-decoration:none!important" target="_top"> </a></div><p>&nbsp;</p><p>&nbsp;</p><p><strong>Table 2:&nbsp;Percentage of persons who have an account individually or jointly in any bank/ other financial institution/mobile money service provider</strong></p><p><img alt="" src="/upload/images/tablw%202%20persons%20with%20bank%20account.PNG" style="height:192px; width:936px" /></p><p>&nbsp;</p><p>The survey was initially planned for January-December, 2020, but due to Covid 19 pandemic, but the the data collection was extended to August 2021. For the central sample, the survey was spread over 14,266 first stage units (8,469 in rural areas and 5,797 in urban areas) covering 2,76,409 sample households (1,64,529 in rural areas and 1,11,880 in urban areas).&nbsp;</p><p>Please click here to access the<a href="/upload/files/MultipleIndicatorSurveyinIndiaf_0.pdf" title="/upload/files/MultipleIndicatorSurveyinIndiaf_0.pdf"> NSSO Report</a><br />Photo Credit:&nbsp;Salahuddin, <a href="https://www.downtoearth.org.in/news/water/nearly-80-per-cent-indian-households-without-piped-water-connection-67928" title="https://www.downtoearth.org.in/news/water/nearly-80-per-cent-indian-households-without-piped-water-connection-67928">Down to Earth</a></p><p>References<br />NSS Report No. 589: Multiple Indicator Survey in India (78th round), Ministry of Statistics and Programme Implementation, March 2023</p>',
'lang' => 'English',
'SITE_URL' => 'https://im4change.in/',
'site_title' => 'im4change',
'adminprix' => 'admin'
]
$article_current = object(App\Model\Entity\Article) {
'id' => (int) 64981,
'title' => 'NSSO Survey: Only 39.1% of all Households have Drinking Water Within Dwelling, 46.7% of Rural Households use Firewood for Cooking',
'subheading' => null,
'description' => '<p>The National Sample Survey Organization&#39;s <a href="https://www.mospi.gov.in/sites/default/files/publication_reports/MultipleIndicatorSurveyinIndiaf_0.pdf">Multiple Indicator Survey</a> - part of the 78th round - has revealed that only 39.1 percent of all Indian households have access to drinking water within the &nbsp;dwelling. When it come to cooking, 46.7% of rural households use firewood.&nbsp;</p>
<p>These are some of the findings of the survey whose purpose was to collect data about the indicators of Sustainable Development Goals. Data was collected for households and population; drinking water and sanitation; household energy use; education and ICT skills; mobile/broadband and mass media; financial inclusion and indebtedness; birth registration; purchase/construction of new house; migration.</p>
<p>The key findings are:</p>
<ul>
<li>&nbsp;About 95.0 percent of the persons in the rural areas and about 97.2 percent of the persons in the urban areas used &lsquo;improved source of drinking water&#39;.&nbsp;</li>
<li>&nbsp;About 56.3 percent of the persons in the rural areas and about 76.3 percent of the persons in the urban areas used improved source of drinking water located in the household premises which was sufficiently available throughout the year. &nbsp;</li>
<li>Among the persons who had reported access to latrine and hand washing facility, about 73.3 percent of the persons in the rural areas and about 81.4 percent of the persons in the urban areas had exclusive access to improved latrine and hand washing facilities with water and soap/detergent within the household premises.</li>
<li>About 49.8 percent of households in the rural areas and about 92.0 percent of households in the urban areas used clean fuel as primary source of energy for cooking. Here clean fuel refers to LPG, other natural gas, gobar gas, other biogas, electricity.</li>
<li>&nbsp;About 33.0 percent of persons in rural areas and about 39.4 percent of persons in urban areas of age 15-29 years were in formal and non-formal education and training for the 12 months preceding the survey.</li>
<li>About 67.8 percent of persons of age 18 years and above in rural areas and about 83.7 percent of persons of age 18 years and above in urban areas used mobile telephone with active sim card during the three months preceding the date of the survey.</li>
<li>Among the persons of age 18 years and above, about 89.3 percent of persons in rural areas and about 89.6 percent of persons in urban areas had an account individually or jointly in any bank/ other financial institution/ mobile money service provider.</li>
<li>Out of 1,00,000 persons of age 18 years and above, 16,223 persons in rural areas and 14,889 persons in urban areas were indebted to any institutional/non-institutional agency as on the date of survey.</li>
<li>About 92.5 percent of households in rural areas reported availability of all-weather roads within 2 km from the place of living.</li>
<li>About 11.2 percent of households in rural areas and about 7.2 percent of households in urban areas purchased/constructed any new house/flat for residential purpose after 31.03.2014. &nbsp;</li>
</ul>
<p>&nbsp;</p>
<p><strong>Table 1:&nbsp;Percentage distribution of households by distance to the principal source of drinking water</strong></p>
<p><img alt="" src="/upload/images/Table%201%20Principle%20source%20of%20drinking%20water.PNG" style="height:206px; width:877px" /></p>
<p>Source:&nbsp;NSS Report No. 589: Multiple Indicator Survey in India, Ministry of Statistics and Programme Implementation</p>
<p>&nbsp;</p>
<p>The table above reveals that 60.5 percent of urban houselholds and 29 percent of rural households have access to drinking water within the dwelling. The all-India average works out to 39.1 percent. 21.2 percent of urban and 30 percent of rural households&#39; primary source of drinking water is outside the dwelling, but within the premesis of residence, whereas 18.4 percent of urban and 41.1 percent of rural households have to step outside the premesis to get their water.&nbsp;&nbsp;</p>
<p>&nbsp;</p>
<p><strong>Donut Chart</strong></p>
<p><iframe class="flourish-embed-iframe" frameborder="0" scrolling="no" src="https://flo.uri.sh/visualisation/13626204/embed" style="width:100%;height:600px;" title="Interactive or visual content"></iframe></p>
<div style="margin-top:4px!important; text-align:right!important; width:100%!"><a class="flourish-credit" href="https://public.flourish.studio/visualisation/13626204/?utm_source=embed&amp;utm_campaign=visualisation/13626204" style="text-decoration:none!important" target="_top"><img alt="Made with Flourish" src="https://public.flourish.studio/resources/made_with_flourish.svg" style="border:none!important; height:16px!important; margin:0!important; width:105px!important" /> </a></div>
<p>&nbsp;</p>
<p>A household was considered to have&nbsp;access to a latrine if majority of the household members had the facility of using latrine irrespective of whether it was used by them or not. Information on access to latrine was collected in terms of six categories:&nbsp;(i) exclusive use of household, (ii) common use of households in the building, (iii) public/community use without payment, (iv) public/community use with payment, (v) others and (vi) no latrine. The chart above gives the average of urban and rural households. Breaking it down into the two categories, 80.8 percent of urban households had exclusive use of a latrine, while among rural households that number was just 68.8 percent. Significantly, 21.3 percent of rural households had no access to a latrine.&nbsp;</p>
<p>&nbsp;</p>
<p><strong>Chart 1: Percentage distribution of households by primary source of energy used for cooking</strong></p>
<p><iframe class="flourish-embed-iframe" frameborder="0" scrolling="no" src="https://flo.uri.sh/visualisation/13625833/embed" style="width:100%;height:600px;" title="Interactive or visual content"></iframe></p>
<div style="margin-top:4px!important; text-align:right!important; width:100%!"><a class="flourish-credit" href="https://public.flourish.studio/visualisation/13625833/?utm_source=embed&amp;utm_campaign=visualisation/13625833" style="text-decoration:none!important" target="_top"><img alt="Made with Flourish" src="https://public.flourish.studio/resources/made_with_flourish.svg" style="border:none!important; height:16px!important; margin:0!important; width:105px!important" /> </a></div>
<p>&nbsp;</p>
<p>&nbsp;</p>
<p><strong>Chart 2: Persons aged 18 and above who have an active mobile and SIM&nbsp;card in the&nbsp;three months prior to survey</strong></p>
<p><iframe class="flourish-embed-iframe" frameborder="0" scrolling="no" src="https://flo.uri.sh/visualisation/13626482/embed" style="width:100%;height:600px;" title="Interactive or visual content"></iframe></p>
<div style="margin-top:4px!important; text-align:right!important; width:100%!"><a class="flourish-credit" href="https://public.flourish.studio/visualisation/13626482/?utm_source=embed&amp;utm_campaign=visualisation/13626482" style="text-decoration:none!important" target="_top"><img alt="Made with Flourish" src="https://public.flourish.studio/resources/made_with_flourish.svg" style="border:none!important; height:16px!important; margin:0!important; width:105px!important" /> </a></div>
<p>&nbsp;</p>
<p>&nbsp;</p>
<p><strong>Table 2:&nbsp;Percentage of persons who have an account individually or jointly in any bank/ other financial institution/mobile money service provider</strong></p>
<p><img alt="" src="/upload/images/tablw%202%20persons%20with%20bank%20account.PNG" style="height:192px; width:936px" /></p>
<p>&nbsp;</p>
<p>The survey was initially planned for January-December, 2020, but due to Covid 19 pandemic, but the the data collection was extended to August 2021. For the central sample, the survey was spread over 14,266 first stage units (8,469 in rural areas and 5,797 in urban areas) covering 2,76,409 sample households (1,64,529 in rural areas and 1,11,880 in urban areas).&nbsp;</p>
<p>Please click here to access the<a href="/upload/files/MultipleIndicatorSurveyinIndiaf_0.pdf"> NSSO Report</a><br />
Photo Credit:&nbsp;Salahuddin, <a href="https://www.downtoearth.org.in/news/water/nearly-80-per-cent-indian-households-without-piped-water-connection-67928">Down to Earth</a></p>
<p>References<br />
NSS Report No. 589: Multiple Indicator Survey in India (78th round), Ministry of Statistics and Programme Implementation, March 2023</p>
',
'credit_writer' => 'National Sample Survey Organization, https://www.mospi.gov.in/sites/default/files/publication_reports/MultipleIndicatorSurveyinIndiaf_0.pdf',
'article_img' => '0.79217900_1574689453_dig015840.jpg',
'article_img_thumb' => '0.79217900_1574689453_dig015840.jpg',
'status' => (int) 1,
'show_on_home' => (int) 1,
'lang' => 'EN',
'category_id' => (int) 4,
'tag_keyword' => '',
'seo_url' => 'nsso-survey-only-39-1-of-all-households-have-drinking-water-within-dwelling-46-7-of-rural-households-use-firewood-for-cooking',
'meta_title' => '',
'meta_keywords' => '',
'meta_description' => '',
'noindex' => (int) 1,
'publish_date' => object(Cake\I18n\FrozenDate) {},
'most_visit_section_id' => null,
'article_big_img' => null,
'liveid' => null,
'created' => object(Cake\I18n\FrozenTime) {},
'modified' => object(Cake\I18n\FrozenTime) {},
'edate' => '',
'tags' => [
(int) 0 => object(Cake\ORM\Entity) {},
(int) 1 => object(Cake\ORM\Entity) {},
(int) 2 => object(Cake\ORM\Entity) {},
(int) 3 => object(Cake\ORM\Entity) {},
(int) 4 => object(Cake\ORM\Entity) {},
(int) 5 => object(Cake\ORM\Entity) {},
(int) 6 => object(Cake\ORM\Entity) {},
(int) 7 => object(Cake\ORM\Entity) {},
(int) 8 => object(Cake\ORM\Entity) {},
(int) 9 => object(Cake\ORM\Entity) {},
(int) 10 => object(Cake\ORM\Entity) {},
(int) 11 => object(Cake\ORM\Entity) {}
],
'category' => object(App\Model\Entity\Category) {},
'[new]' => false,
'[accessible]' => [
'*' => true,
'id' => false
],
'[dirty]' => [],
'[original]' => [],
'[virtual]' => [],
'[hasErrors]' => false,
'[errors]' => [],
'[invalid]' => [],
'[repository]' => 'Articles'
}
$articleid = (int) 64981
$metaTitle = 'NEWS ALERTS | NSSO Survey: Only 39.1% of all Households have Drinking Water Within Dwelling, 46.7% of Rural Households use Firewood for Cooking'
$metaKeywords = '78th Round,Drinking Water,Education,Financial Inclusion,Household Energy Use,Mass Media,Migration,Mobile Broadband,Multiple Indicator Survey,National Sample Survey,NSSO,Sanitation'
$metaDesc = 'The National Sample Survey Organization&#39;s Multiple Indicator Survey - part of the 78th round - has revealed that only 39.1 percent of all Indian households have access to drinking water within the &nbsp;dwelling. When it come to cooking, 46.7% of...'
$disp = '<p>The National Sample Survey Organization&#39;s <a href="https://www.mospi.gov.in/sites/default/files/publication_reports/MultipleIndicatorSurveyinIndiaf_0.pdf" title="https://www.mospi.gov.in/sites/default/files/publication_reports/MultipleIndicatorSurveyinIndiaf_0.pdf">Multiple Indicator Survey</a> - part of the 78th round - has revealed that only 39.1 percent of all Indian households have access to drinking water within the &nbsp;dwelling. When it come to cooking, 46.7% of rural households use firewood.&nbsp;</p><p>These are some of the findings of the survey whose purpose was to collect data about the indicators of Sustainable Development Goals. Data was collected for households and population; drinking water and sanitation; household energy use; education and ICT skills; mobile/broadband and mass media; financial inclusion and indebtedness; birth registration; purchase/construction of new house; migration.</p><p>The key findings are:</p><ul><li>&nbsp;About 95.0 percent of the persons in the rural areas and about 97.2 percent of the persons in the urban areas used &lsquo;improved source of drinking water&#39;.&nbsp;</li><li>&nbsp;About 56.3 percent of the persons in the rural areas and about 76.3 percent of the persons in the urban areas used improved source of drinking water located in the household premises which was sufficiently available throughout the year. &nbsp;</li><li>Among the persons who had reported access to latrine and hand washing facility, about 73.3 percent of the persons in the rural areas and about 81.4 percent of the persons in the urban areas had exclusive access to improved latrine and hand washing facilities with water and soap/detergent within the household premises.</li><li>About 49.8 percent of households in the rural areas and about 92.0 percent of households in the urban areas used clean fuel as primary source of energy for cooking. Here clean fuel refers to LPG, other natural gas, gobar gas, other biogas, electricity.</li><li>&nbsp;About 33.0 percent of persons in rural areas and about 39.4 percent of persons in urban areas of age 15-29 years were in formal and non-formal education and training for the 12 months preceding the survey.</li><li>About 67.8 percent of persons of age 18 years and above in rural areas and about 83.7 percent of persons of age 18 years and above in urban areas used mobile telephone with active sim card during the three months preceding the date of the survey.</li><li>Among the persons of age 18 years and above, about 89.3 percent of persons in rural areas and about 89.6 percent of persons in urban areas had an account individually or jointly in any bank/ other financial institution/ mobile money service provider.</li><li>Out of 1,00,000 persons of age 18 years and above, 16,223 persons in rural areas and 14,889 persons in urban areas were indebted to any institutional/non-institutional agency as on the date of survey.</li><li>About 92.5 percent of households in rural areas reported availability of all-weather roads within 2 km from the place of living.</li><li>About 11.2 percent of households in rural areas and about 7.2 percent of households in urban areas purchased/constructed any new house/flat for residential purpose after 31.03.2014. &nbsp;</li></ul><p>&nbsp;</p><p><strong>Table 1:&nbsp;Percentage distribution of households by distance to the principal source of drinking water</strong></p><p><img alt="" src="/upload/images/Table%201%20Principle%20source%20of%20drinking%20water.PNG" style="height:206px; width:877px" /></p><p>Source:&nbsp;NSS Report No. 589: Multiple Indicator Survey in India, Ministry of Statistics and Programme Implementation</p><p>&nbsp;</p><p>The table above reveals that 60.5 percent of urban houselholds and 29 percent of rural households have access to drinking water within the dwelling. The all-India average works out to 39.1 percent. 21.2 percent of urban and 30 percent of rural households&#39; primary source of drinking water is outside the dwelling, but within the premesis of residence, whereas 18.4 percent of urban and 41.1 percent of rural households have to step outside the premesis to get their water.&nbsp;&nbsp;</p><p>&nbsp;</p><p><strong>Donut Chart</strong></p><p><iframe class="flourish-embed-iframe" frameborder="0" scrolling="no" src="https://flo.uri.sh/visualisation/13626204/embed" style="width:100%;height:600px;" title="Interactive or visual content"></iframe></p><div style="margin-top:4px!important; text-align:right!important; width:100%!"><a href="https://public.flourish.studio/visualisation/13626204/?utm_source=embed&amp;utm_campaign=visualisation/13626204" style="text-decoration:none!important" target="_top" title="https://public.flourish.studio/visualisation/13626204/?utm_source=embed&amp;utm_campaign=visualisation/13626204" style="text-decoration:none!important" target="_top"> </a></div><p>&nbsp;</p><p>A household was considered to have&nbsp;access to a latrine if majority of the household members had the facility of using latrine irrespective of whether it was used by them or not. Information on access to latrine was collected in terms of six categories:&nbsp;(i) exclusive use of household, (ii) common use of households in the building, (iii) public/community use without payment, (iv) public/community use with payment, (v) others and (vi) no latrine. The chart above gives the average of urban and rural households. Breaking it down into the two categories, 80.8 percent of urban households had exclusive use of a latrine, while among rural households that number was just 68.8 percent. Significantly, 21.3 percent of rural households had no access to a latrine.&nbsp;</p><p>&nbsp;</p><p><strong>Chart 1: Percentage distribution of households by primary source of energy used for cooking</strong></p><p><iframe class="flourish-embed-iframe" frameborder="0" scrolling="no" src="https://flo.uri.sh/visualisation/13625833/embed" style="width:100%;height:600px;" title="Interactive or visual content"></iframe></p><div style="margin-top:4px!important; text-align:right!important; width:100%!"><a href="https://public.flourish.studio/visualisation/13625833/?utm_source=embed&amp;utm_campaign=visualisation/13625833" style="text-decoration:none!important" target="_top" title="https://public.flourish.studio/visualisation/13625833/?utm_source=embed&amp;utm_campaign=visualisation/13625833" style="text-decoration:none!important" target="_top"> </a></div><p>&nbsp;</p><p>&nbsp;</p><p><strong>Chart 2: Persons aged 18 and above who have an active mobile and SIM&nbsp;card in the&nbsp;three months prior to survey</strong></p><p><iframe class="flourish-embed-iframe" frameborder="0" scrolling="no" src="https://flo.uri.sh/visualisation/13626482/embed" style="width:100%;height:600px;" title="Interactive or visual content"></iframe></p><div style="margin-top:4px!important; text-align:right!important; width:100%!"><a href="https://public.flourish.studio/visualisation/13626482/?utm_source=embed&amp;utm_campaign=visualisation/13626482" style="text-decoration:none!important" target="_top" title="https://public.flourish.studio/visualisation/13626482/?utm_source=embed&amp;utm_campaign=visualisation/13626482" style="text-decoration:none!important" target="_top"> </a></div><p>&nbsp;</p><p>&nbsp;</p><p><strong>Table 2:&nbsp;Percentage of persons who have an account individually or jointly in any bank/ other financial institution/mobile money service provider</strong></p><p><img alt="" src="/upload/images/tablw%202%20persons%20with%20bank%20account.PNG" style="height:192px; width:936px" /></p><p>&nbsp;</p><p>The survey was initially planned for January-December, 2020, but due to Covid 19 pandemic, but the the data collection was extended to August 2021. For the central sample, the survey was spread over 14,266 first stage units (8,469 in rural areas and 5,797 in urban areas) covering 2,76,409 sample households (1,64,529 in rural areas and 1,11,880 in urban areas).&nbsp;</p><p>Please click here to access the<a href="/upload/files/MultipleIndicatorSurveyinIndiaf_0.pdf" title="/upload/files/MultipleIndicatorSurveyinIndiaf_0.pdf"> NSSO Report</a><br />Photo Credit:&nbsp;Salahuddin, <a href="https://www.downtoearth.org.in/news/water/nearly-80-per-cent-indian-households-without-piped-water-connection-67928" title="https://www.downtoearth.org.in/news/water/nearly-80-per-cent-indian-households-without-piped-water-connection-67928">Down to Earth</a></p><p>References<br />NSS Report No. 589: Multiple Indicator Survey in India (78th round), Ministry of Statistics and Programme Implementation, March 2023</p>'
$lang = 'English'
$SITE_URL = 'https://im4change.in/'
$site_title = 'im4change'
$adminprix = 'admin'</pre><pre class="stack-trace">include - APP/Template/Layout/printlayout.ctp, line 8
Cake\View\View::_evaluate() - CORE/src/View/View.php, line 1413
Cake\View\View::_render() - CORE/src/View/View.php, line 1374
Cake\View\View::renderLayout() - CORE/src/View/View.php, line 927
Cake\View\View::render() - CORE/src/View/View.php, line 885
Cake\Controller\Controller::render() - CORE/src/Controller/Controller.php, line 791
Cake\Http\ActionDispatcher::_invoke() - CORE/src/Http/ActionDispatcher.php, line 126
Cake\Http\ActionDispatcher::dispatch() - CORE/src/Http/ActionDispatcher.php, line 94
Cake\Http\BaseApplication::__invoke() - CORE/src/Http/BaseApplication.php, line 235
Cake\Http\Runner::__invoke() - CORE/src/Http/Runner.php, line 65
Cake\Routing\Middleware\RoutingMiddleware::__invoke() - CORE/src/Routing/Middleware/RoutingMiddleware.php, line 162
Cake\Http\Runner::__invoke() - CORE/src/Http/Runner.php, line 65
Cake\Routing\Middleware\AssetMiddleware::__invoke() - CORE/src/Routing/Middleware/AssetMiddleware.php, line 88
Cake\Http\Runner::__invoke() - CORE/src/Http/Runner.php, line 65
Cake\Error\Middleware\ErrorHandlerMiddleware::__invoke() - CORE/src/Error/Middleware/ErrorHandlerMiddleware.php, line 96
Cake\Http\Runner::__invoke() - CORE/src/Http/Runner.php, line 65
Cake\Http\Runner::run() - CORE/src/Http/Runner.php, line 51</pre></div></pre>news-alerts-57/nsso-survey-only-39-1-of-all-households-have-drinking-water-within-dwelling-46-7-of-rural-households-use-firewood-for-cooking.html"/>
<meta http-equiv="Content-Type" content="text/html; charset=utf-8"/>
<link href="https://im4change.in/css/control.css" rel="stylesheet" type="text/css"
media="all"/>
<title>NEWS ALERTS | NSSO Survey: Only 39.1% of all Households have Drinking Water Within Dwelling, 46.7% of Rural Households use Firewood for Cooking | Im4change.org</title>
<meta name="description" content="The National Sample Survey Organization's Multiple Indicator Survey - part of the 78th round - has revealed that only 39.1 percent of all Indian households have access to drinking water within the dwelling. When it come to cooking, 46.7% of..."/>
<script src="https://im4change.in/js/jquery-1.10.2.js"></script>
<script type="text/javascript" src="https://im4change.in/js/jquery-migrate.min.js"></script>
<script language="javascript" type="text/javascript">
$(document).ready(function () {
var img = $("img")[0]; // Get my img elem
var pic_real_width, pic_real_height;
$("<img/>") // Make in memory copy of image to avoid css issues
.attr("src", $(img).attr("src"))
.load(function () {
pic_real_width = this.width; // Note: $(this).width() will not
pic_real_height = this.height; // work for in memory images.
});
});
</script>
<style type="text/css">
@media screen {
div.divFooter {
display: block;
}
}
@media print {
.printbutton {
display: none !important;
}
}
</style>
</head>
<body>
<table cellpadding="0" cellspacing="0" border="0" width="98%" align="center">
<tr>
<td class="top_bg">
<div class="divFooter">
<img src="https://im4change.in/images/logo1.jpg" height="59" border="0"
alt="Resource centre on India's rural distress" style="padding-top:14px;"/>
</div>
</td>
</tr>
<tr>
<td id="topspace"> </td>
</tr>
<tr id="topspace">
<td> </td>
</tr>
<tr>
<td height="50" style="border-bottom:1px solid #000; padding-top:10px;" class="printbutton">
<form><input type="button" value=" Print this page "
onclick="window.print();return false;"/></form>
</td>
</tr>
<tr>
<td width="100%">
<h1 class="news_headlines" style="font-style:normal">
<strong>NSSO Survey: Only 39.1% of all Households have Drinking Water Within Dwelling, 46.7% of Rural Households use Firewood for Cooking</strong></h1>
</td>
</tr>
<tr>
<td width="100%" style="font-family:Arial, 'Segoe Script', 'Segoe UI', sans-serif, serif"><font size="3">
<p>The National Sample Survey Organization's <a href="https://www.mospi.gov.in/sites/default/files/publication_reports/MultipleIndicatorSurveyinIndiaf_0.pdf" title="https://www.mospi.gov.in/sites/default/files/publication_reports/MultipleIndicatorSurveyinIndiaf_0.pdf">Multiple Indicator Survey</a> - part of the 78th round - has revealed that only 39.1 percent of all Indian households have access to drinking water within the dwelling. When it come to cooking, 46.7% of rural households use firewood. </p><p>These are some of the findings of the survey whose purpose was to collect data about the indicators of Sustainable Development Goals. Data was collected for households and population; drinking water and sanitation; household energy use; education and ICT skills; mobile/broadband and mass media; financial inclusion and indebtedness; birth registration; purchase/construction of new house; migration.</p><p>The key findings are:</p><ul><li> About 95.0 percent of the persons in the rural areas and about 97.2 percent of the persons in the urban areas used ‘improved source of drinking water'. </li><li> About 56.3 percent of the persons in the rural areas and about 76.3 percent of the persons in the urban areas used improved source of drinking water located in the household premises which was sufficiently available throughout the year. </li><li>Among the persons who had reported access to latrine and hand washing facility, about 73.3 percent of the persons in the rural areas and about 81.4 percent of the persons in the urban areas had exclusive access to improved latrine and hand washing facilities with water and soap/detergent within the household premises.</li><li>About 49.8 percent of households in the rural areas and about 92.0 percent of households in the urban areas used clean fuel as primary source of energy for cooking. Here clean fuel refers to LPG, other natural gas, gobar gas, other biogas, electricity.</li><li> About 33.0 percent of persons in rural areas and about 39.4 percent of persons in urban areas of age 15-29 years were in formal and non-formal education and training for the 12 months preceding the survey.</li><li>About 67.8 percent of persons of age 18 years and above in rural areas and about 83.7 percent of persons of age 18 years and above in urban areas used mobile telephone with active sim card during the three months preceding the date of the survey.</li><li>Among the persons of age 18 years and above, about 89.3 percent of persons in rural areas and about 89.6 percent of persons in urban areas had an account individually or jointly in any bank/ other financial institution/ mobile money service provider.</li><li>Out of 1,00,000 persons of age 18 years and above, 16,223 persons in rural areas and 14,889 persons in urban areas were indebted to any institutional/non-institutional agency as on the date of survey.</li><li>About 92.5 percent of households in rural areas reported availability of all-weather roads within 2 km from the place of living.</li><li>About 11.2 percent of households in rural areas and about 7.2 percent of households in urban areas purchased/constructed any new house/flat for residential purpose after 31.03.2014. </li></ul><p> </p><p><strong>Table 1: Percentage distribution of households by distance to the principal source of drinking water</strong></p><p><img alt="" src="/upload/images/Table%201%20Principle%20source%20of%20drinking%20water.PNG" style="height:206px; width:877px" /></p><p>Source: NSS Report No. 589: Multiple Indicator Survey in India, Ministry of Statistics and Programme Implementation</p><p> </p><p>The table above reveals that 60.5 percent of urban houselholds and 29 percent of rural households have access to drinking water within the dwelling. The all-India average works out to 39.1 percent. 21.2 percent of urban and 30 percent of rural households' primary source of drinking water is outside the dwelling, but within the premesis of residence, whereas 18.4 percent of urban and 41.1 percent of rural households have to step outside the premesis to get their water. </p><p> </p><p><strong>Donut Chart</strong></p><p><iframe class="flourish-embed-iframe" frameborder="0" scrolling="no" src="https://flo.uri.sh/visualisation/13626204/embed" style="width:100%;height:600px;" title="Interactive or visual content"></iframe></p><div style="margin-top:4px!important; text-align:right!important; width:100%!"><a href="https://public.flourish.studio/visualisation/13626204/?utm_source=embed&utm_campaign=visualisation/13626204" style="text-decoration:none!important" target="_top" title="https://public.flourish.studio/visualisation/13626204/?utm_source=embed&utm_campaign=visualisation/13626204" style="text-decoration:none!important" target="_top"> </a></div><p> </p><p>A household was considered to have access to a latrine if majority of the household members had the facility of using latrine irrespective of whether it was used by them or not. Information on access to latrine was collected in terms of six categories: (i) exclusive use of household, (ii) common use of households in the building, (iii) public/community use without payment, (iv) public/community use with payment, (v) others and (vi) no latrine. The chart above gives the average of urban and rural households. Breaking it down into the two categories, 80.8 percent of urban households had exclusive use of a latrine, while among rural households that number was just 68.8 percent. Significantly, 21.3 percent of rural households had no access to a latrine. </p><p> </p><p><strong>Chart 1: Percentage distribution of households by primary source of energy used for cooking</strong></p><p><iframe class="flourish-embed-iframe" frameborder="0" scrolling="no" src="https://flo.uri.sh/visualisation/13625833/embed" style="width:100%;height:600px;" title="Interactive or visual content"></iframe></p><div style="margin-top:4px!important; text-align:right!important; width:100%!"><a href="https://public.flourish.studio/visualisation/13625833/?utm_source=embed&utm_campaign=visualisation/13625833" style="text-decoration:none!important" target="_top" title="https://public.flourish.studio/visualisation/13625833/?utm_source=embed&utm_campaign=visualisation/13625833" style="text-decoration:none!important" target="_top"> </a></div><p> </p><p> </p><p><strong>Chart 2: Persons aged 18 and above who have an active mobile and SIM card in the three months prior to survey</strong></p><p><iframe class="flourish-embed-iframe" frameborder="0" scrolling="no" src="https://flo.uri.sh/visualisation/13626482/embed" style="width:100%;height:600px;" title="Interactive or visual content"></iframe></p><div style="margin-top:4px!important; text-align:right!important; width:100%!"><a href="https://public.flourish.studio/visualisation/13626482/?utm_source=embed&utm_campaign=visualisation/13626482" style="text-decoration:none!important" target="_top" title="https://public.flourish.studio/visualisation/13626482/?utm_source=embed&utm_campaign=visualisation/13626482" style="text-decoration:none!important" target="_top"> </a></div><p> </p><p> </p><p><strong>Table 2: Percentage of persons who have an account individually or jointly in any bank/ other financial institution/mobile money service provider</strong></p><p><img alt="" src="/upload/images/tablw%202%20persons%20with%20bank%20account.PNG" style="height:192px; width:936px" /></p><p> </p><p>The survey was initially planned for January-December, 2020, but due to Covid 19 pandemic, but the the data collection was extended to August 2021. For the central sample, the survey was spread over 14,266 first stage units (8,469 in rural areas and 5,797 in urban areas) covering 2,76,409 sample households (1,64,529 in rural areas and 1,11,880 in urban areas). </p><p>Please click here to access the<a href="/upload/files/MultipleIndicatorSurveyinIndiaf_0.pdf" title="/upload/files/MultipleIndicatorSurveyinIndiaf_0.pdf"> NSSO Report</a><br />Photo Credit: Salahuddin, <a href="https://www.downtoearth.org.in/news/water/nearly-80-per-cent-indian-households-without-piped-water-connection-67928" title="https://www.downtoearth.org.in/news/water/nearly-80-per-cent-indian-households-without-piped-water-connection-67928">Down to Earth</a></p><p>References<br />NSS Report No. 589: Multiple Indicator Survey in India (78th round), Ministry of Statistics and Programme Implementation, March 2023</p> </font>
</td>
</tr>
<tr>
<td> </td>
</tr>
<tr>
<td height="50" style="border-top:1px solid #000; border-bottom:1px solid #000;padding-top:10px;">
<form><input type="button" value=" Print this page "
onclick="window.print();return false;"/></form>
</td>
</tr>
</table></body>
</html>'
}
$maxBufferLength = (int) 8192
$file = '/home/brlfuser/public_html/vendor/cakephp/cakephp/src/Error/Debugger.php'
$line = (int) 853
$message = 'Unable to emit headers. Headers sent in file=/home/brlfuser/public_html/vendor/cakephp/cakephp/src/Error/Debugger.php line=853'
Cake\Http\ResponseEmitter::emit() - CORE/src/Http/ResponseEmitter.php, line 48
Cake\Http\Server::emit() - CORE/src/Http/Server.php, line 141
[main] - ROOT/webroot/index.php, line 39
Warning (2): Cannot modify header information - headers already sent by (output started at /home/brlfuser/public_html/vendor/cakephp/cakephp/src/Error/Debugger.php:853) [CORE/src/Http/ResponseEmitter.php, line 148]
$response = object(Cake\Http\Response) {
'status' => (int) 200,
'contentType' => 'text/html',
'headers' => [
'Content-Type' => [
[maximum depth reached]
]
],
'file' => null,
'fileRange' => [],
'cookies' => object(Cake\Http\Cookie\CookieCollection) {},
'cacheDirectives' => [],
'body' => '<!DOCTYPE html PUBLIC "-//W3C//DTD XHTML 1.0 Transitional//EN"
"http://www.w3.org/TR/xhtml1/DTD/xhtml1-transitional.dtd">
<html xmlns="http://www.w3.org/1999/xhtml">
<head>
<link rel="canonical" href="https://im4change.in/<pre class="cake-error"><a href="javascript:void(0);" onclick="document.getElementById('cakeErr67eb7b2c4e81e-trace').style.display = (document.getElementById('cakeErr67eb7b2c4e81e-trace').style.display == 'none' ? '' : 'none');"><b>Notice</b> (8)</a>: Undefined variable: urlPrefix [<b>APP/Template/Layout/printlayout.ctp</b>, line <b>8</b>]<div id="cakeErr67eb7b2c4e81e-trace" class="cake-stack-trace" style="display: none;"><a href="javascript:void(0);" onclick="document.getElementById('cakeErr67eb7b2c4e81e-code').style.display = (document.getElementById('cakeErr67eb7b2c4e81e-code').style.display == 'none' ? '' : 'none')">Code</a> <a href="javascript:void(0);" onclick="document.getElementById('cakeErr67eb7b2c4e81e-context').style.display = (document.getElementById('cakeErr67eb7b2c4e81e-context').style.display == 'none' ? '' : 'none')">Context</a><pre id="cakeErr67eb7b2c4e81e-code" class="cake-code-dump" style="display: none;"><code><span style="color: #000000"><span style="color: #0000BB"></span><span style="color: #007700"><</span><span style="color: #0000BB">head</span><span style="color: #007700">>
</span></span></code>
<span class="code-highlight"><code><span style="color: #000000"> <link rel="canonical" href="<span style="color: #0000BB"><?php </span><span style="color: #007700">echo </span><span style="color: #0000BB">Configure</span><span style="color: #007700">::</span><span style="color: #0000BB">read</span><span style="color: #007700">(</span><span style="color: #DD0000">'SITE_URL'</span><span style="color: #007700">); </span><span style="color: #0000BB">?><?php </span><span style="color: #007700">echo </span><span style="color: #0000BB">$urlPrefix</span><span style="color: #007700">;</span><span style="color: #0000BB">?><?php </span><span style="color: #007700">echo </span><span style="color: #0000BB">$article_current</span><span style="color: #007700">-></span><span style="color: #0000BB">category</span><span style="color: #007700">-></span><span style="color: #0000BB">slug</span><span style="color: #007700">; </span><span style="color: #0000BB">?></span>/<span style="color: #0000BB"><?php </span><span style="color: #007700">echo </span><span style="color: #0000BB">$article_current</span><span style="color: #007700">-></span><span style="color: #0000BB">seo_url</span><span style="color: #007700">; </span><span style="color: #0000BB">?></span>.html"/>
</span></code></span>
<code><span style="color: #000000"><span style="color: #0000BB"> </span><span style="color: #007700"><</span><span style="color: #0000BB">meta http</span><span style="color: #007700">-</span><span style="color: #0000BB">equiv</span><span style="color: #007700">=</span><span style="color: #DD0000">"Content-Type" </span><span style="color: #0000BB">content</span><span style="color: #007700">=</span><span style="color: #DD0000">"text/html; charset=utf-8"</span><span style="color: #007700">/>
</span></span></code></pre><pre id="cakeErr67eb7b2c4e81e-context" class="cake-context" style="display: none;">$viewFile = '/home/brlfuser/public_html/src/Template/Layout/printlayout.ctp'
$dataForView = [
'article_current' => object(App\Model\Entity\Article) {
'id' => (int) 64981,
'title' => 'NSSO Survey: Only 39.1% of all Households have Drinking Water Within Dwelling, 46.7% of Rural Households use Firewood for Cooking',
'subheading' => null,
'description' => '<p>The National Sample Survey Organization&#39;s <a href="https://www.mospi.gov.in/sites/default/files/publication_reports/MultipleIndicatorSurveyinIndiaf_0.pdf">Multiple Indicator Survey</a> - part of the 78th round - has revealed that only 39.1 percent of all Indian households have access to drinking water within the &nbsp;dwelling. When it come to cooking, 46.7% of rural households use firewood.&nbsp;</p>
<p>These are some of the findings of the survey whose purpose was to collect data about the indicators of Sustainable Development Goals. Data was collected for households and population; drinking water and sanitation; household energy use; education and ICT skills; mobile/broadband and mass media; financial inclusion and indebtedness; birth registration; purchase/construction of new house; migration.</p>
<p>The key findings are:</p>
<ul>
<li>&nbsp;About 95.0 percent of the persons in the rural areas and about 97.2 percent of the persons in the urban areas used &lsquo;improved source of drinking water&#39;.&nbsp;</li>
<li>&nbsp;About 56.3 percent of the persons in the rural areas and about 76.3 percent of the persons in the urban areas used improved source of drinking water located in the household premises which was sufficiently available throughout the year. &nbsp;</li>
<li>Among the persons who had reported access to latrine and hand washing facility, about 73.3 percent of the persons in the rural areas and about 81.4 percent of the persons in the urban areas had exclusive access to improved latrine and hand washing facilities with water and soap/detergent within the household premises.</li>
<li>About 49.8 percent of households in the rural areas and about 92.0 percent of households in the urban areas used clean fuel as primary source of energy for cooking. Here clean fuel refers to LPG, other natural gas, gobar gas, other biogas, electricity.</li>
<li>&nbsp;About 33.0 percent of persons in rural areas and about 39.4 percent of persons in urban areas of age 15-29 years were in formal and non-formal education and training for the 12 months preceding the survey.</li>
<li>About 67.8 percent of persons of age 18 years and above in rural areas and about 83.7 percent of persons of age 18 years and above in urban areas used mobile telephone with active sim card during the three months preceding the date of the survey.</li>
<li>Among the persons of age 18 years and above, about 89.3 percent of persons in rural areas and about 89.6 percent of persons in urban areas had an account individually or jointly in any bank/ other financial institution/ mobile money service provider.</li>
<li>Out of 1,00,000 persons of age 18 years and above, 16,223 persons in rural areas and 14,889 persons in urban areas were indebted to any institutional/non-institutional agency as on the date of survey.</li>
<li>About 92.5 percent of households in rural areas reported availability of all-weather roads within 2 km from the place of living.</li>
<li>About 11.2 percent of households in rural areas and about 7.2 percent of households in urban areas purchased/constructed any new house/flat for residential purpose after 31.03.2014. &nbsp;</li>
</ul>
<p>&nbsp;</p>
<p><strong>Table 1:&nbsp;Percentage distribution of households by distance to the principal source of drinking water</strong></p>
<p><img alt="" src="/upload/images/Table%201%20Principle%20source%20of%20drinking%20water.PNG" style="height:206px; width:877px" /></p>
<p>Source:&nbsp;NSS Report No. 589: Multiple Indicator Survey in India, Ministry of Statistics and Programme Implementation</p>
<p>&nbsp;</p>
<p>The table above reveals that 60.5 percent of urban houselholds and 29 percent of rural households have access to drinking water within the dwelling. The all-India average works out to 39.1 percent. 21.2 percent of urban and 30 percent of rural households&#39; primary source of drinking water is outside the dwelling, but within the premesis of residence, whereas 18.4 percent of urban and 41.1 percent of rural households have to step outside the premesis to get their water.&nbsp;&nbsp;</p>
<p>&nbsp;</p>
<p><strong>Donut Chart</strong></p>
<p><iframe class="flourish-embed-iframe" frameborder="0" scrolling="no" src="https://flo.uri.sh/visualisation/13626204/embed" style="width:100%;height:600px;" title="Interactive or visual content"></iframe></p>
<div style="margin-top:4px!important; text-align:right!important; width:100%!"><a class="flourish-credit" href="https://public.flourish.studio/visualisation/13626204/?utm_source=embed&amp;utm_campaign=visualisation/13626204" style="text-decoration:none!important" target="_top"><img alt="Made with Flourish" src="https://public.flourish.studio/resources/made_with_flourish.svg" style="border:none!important; height:16px!important; margin:0!important; width:105px!important" /> </a></div>
<p>&nbsp;</p>
<p>A household was considered to have&nbsp;access to a latrine if majority of the household members had the facility of using latrine irrespective of whether it was used by them or not. Information on access to latrine was collected in terms of six categories:&nbsp;(i) exclusive use of household, (ii) common use of households in the building, (iii) public/community use without payment, (iv) public/community use with payment, (v) others and (vi) no latrine. The chart above gives the average of urban and rural households. Breaking it down into the two categories, 80.8 percent of urban households had exclusive use of a latrine, while among rural households that number was just 68.8 percent. Significantly, 21.3 percent of rural households had no access to a latrine.&nbsp;</p>
<p>&nbsp;</p>
<p><strong>Chart 1: Percentage distribution of households by primary source of energy used for cooking</strong></p>
<p><iframe class="flourish-embed-iframe" frameborder="0" scrolling="no" src="https://flo.uri.sh/visualisation/13625833/embed" style="width:100%;height:600px;" title="Interactive or visual content"></iframe></p>
<div style="margin-top:4px!important; text-align:right!important; width:100%!"><a class="flourish-credit" href="https://public.flourish.studio/visualisation/13625833/?utm_source=embed&amp;utm_campaign=visualisation/13625833" style="text-decoration:none!important" target="_top"><img alt="Made with Flourish" src="https://public.flourish.studio/resources/made_with_flourish.svg" style="border:none!important; height:16px!important; margin:0!important; width:105px!important" /> </a></div>
<p>&nbsp;</p>
<p>&nbsp;</p>
<p><strong>Chart 2: Persons aged 18 and above who have an active mobile and SIM&nbsp;card in the&nbsp;three months prior to survey</strong></p>
<p><iframe class="flourish-embed-iframe" frameborder="0" scrolling="no" src="https://flo.uri.sh/visualisation/13626482/embed" style="width:100%;height:600px;" title="Interactive or visual content"></iframe></p>
<div style="margin-top:4px!important; text-align:right!important; width:100%!"><a class="flourish-credit" href="https://public.flourish.studio/visualisation/13626482/?utm_source=embed&amp;utm_campaign=visualisation/13626482" style="text-decoration:none!important" target="_top"><img alt="Made with Flourish" src="https://public.flourish.studio/resources/made_with_flourish.svg" style="border:none!important; height:16px!important; margin:0!important; width:105px!important" /> </a></div>
<p>&nbsp;</p>
<p>&nbsp;</p>
<p><strong>Table 2:&nbsp;Percentage of persons who have an account individually or jointly in any bank/ other financial institution/mobile money service provider</strong></p>
<p><img alt="" src="/upload/images/tablw%202%20persons%20with%20bank%20account.PNG" style="height:192px; width:936px" /></p>
<p>&nbsp;</p>
<p>The survey was initially planned for January-December, 2020, but due to Covid 19 pandemic, but the the data collection was extended to August 2021. For the central sample, the survey was spread over 14,266 first stage units (8,469 in rural areas and 5,797 in urban areas) covering 2,76,409 sample households (1,64,529 in rural areas and 1,11,880 in urban areas).&nbsp;</p>
<p>Please click here to access the<a href="/upload/files/MultipleIndicatorSurveyinIndiaf_0.pdf"> NSSO Report</a><br />
Photo Credit:&nbsp;Salahuddin, <a href="https://www.downtoearth.org.in/news/water/nearly-80-per-cent-indian-households-without-piped-water-connection-67928">Down to Earth</a></p>
<p>References<br />
NSS Report No. 589: Multiple Indicator Survey in India (78th round), Ministry of Statistics and Programme Implementation, March 2023</p>
',
'credit_writer' => 'National Sample Survey Organization, https://www.mospi.gov.in/sites/default/files/publication_reports/MultipleIndicatorSurveyinIndiaf_0.pdf',
'article_img' => '0.79217900_1574689453_dig015840.jpg',
'article_img_thumb' => '0.79217900_1574689453_dig015840.jpg',
'status' => (int) 1,
'show_on_home' => (int) 1,
'lang' => 'EN',
'category_id' => (int) 4,
'tag_keyword' => '',
'seo_url' => 'nsso-survey-only-39-1-of-all-households-have-drinking-water-within-dwelling-46-7-of-rural-households-use-firewood-for-cooking',
'meta_title' => '',
'meta_keywords' => '',
'meta_description' => '',
'noindex' => (int) 1,
'publish_date' => object(Cake\I18n\FrozenDate) {},
'most_visit_section_id' => null,
'article_big_img' => null,
'liveid' => null,
'created' => object(Cake\I18n\FrozenTime) {},
'modified' => object(Cake\I18n\FrozenTime) {},
'edate' => '',
'tags' => [
[maximum depth reached]
],
'category' => object(App\Model\Entity\Category) {},
'[new]' => false,
'[accessible]' => [
[maximum depth reached]
],
'[dirty]' => [[maximum depth reached]],
'[original]' => [[maximum depth reached]],
'[virtual]' => [[maximum depth reached]],
'[hasErrors]' => false,
'[errors]' => [[maximum depth reached]],
'[invalid]' => [[maximum depth reached]],
'[repository]' => 'Articles'
},
'articleid' => (int) 64981,
'metaTitle' => 'NEWS ALERTS | NSSO Survey: Only 39.1% of all Households have Drinking Water Within Dwelling, 46.7% of Rural Households use Firewood for Cooking',
'metaKeywords' => '78th Round,Drinking Water,Education,Financial Inclusion,Household Energy Use,Mass Media,Migration,Mobile Broadband,Multiple Indicator Survey,National Sample Survey,NSSO,Sanitation',
'metaDesc' => 'The National Sample Survey Organization&#39;s Multiple Indicator Survey - part of the 78th round - has revealed that only 39.1 percent of all Indian households have access to drinking water within the &nbsp;dwelling. When it come to cooking, 46.7% of...',
'disp' => '<p>The National Sample Survey Organization&#39;s <a href="https://www.mospi.gov.in/sites/default/files/publication_reports/MultipleIndicatorSurveyinIndiaf_0.pdf" title="https://www.mospi.gov.in/sites/default/files/publication_reports/MultipleIndicatorSurveyinIndiaf_0.pdf">Multiple Indicator Survey</a> - part of the 78th round - has revealed that only 39.1 percent of all Indian households have access to drinking water within the &nbsp;dwelling. When it come to cooking, 46.7% of rural households use firewood.&nbsp;</p><p>These are some of the findings of the survey whose purpose was to collect data about the indicators of Sustainable Development Goals. Data was collected for households and population; drinking water and sanitation; household energy use; education and ICT skills; mobile/broadband and mass media; financial inclusion and indebtedness; birth registration; purchase/construction of new house; migration.</p><p>The key findings are:</p><ul><li>&nbsp;About 95.0 percent of the persons in the rural areas and about 97.2 percent of the persons in the urban areas used &lsquo;improved source of drinking water&#39;.&nbsp;</li><li>&nbsp;About 56.3 percent of the persons in the rural areas and about 76.3 percent of the persons in the urban areas used improved source of drinking water located in the household premises which was sufficiently available throughout the year. &nbsp;</li><li>Among the persons who had reported access to latrine and hand washing facility, about 73.3 percent of the persons in the rural areas and about 81.4 percent of the persons in the urban areas had exclusive access to improved latrine and hand washing facilities with water and soap/detergent within the household premises.</li><li>About 49.8 percent of households in the rural areas and about 92.0 percent of households in the urban areas used clean fuel as primary source of energy for cooking. Here clean fuel refers to LPG, other natural gas, gobar gas, other biogas, electricity.</li><li>&nbsp;About 33.0 percent of persons in rural areas and about 39.4 percent of persons in urban areas of age 15-29 years were in formal and non-formal education and training for the 12 months preceding the survey.</li><li>About 67.8 percent of persons of age 18 years and above in rural areas and about 83.7 percent of persons of age 18 years and above in urban areas used mobile telephone with active sim card during the three months preceding the date of the survey.</li><li>Among the persons of age 18 years and above, about 89.3 percent of persons in rural areas and about 89.6 percent of persons in urban areas had an account individually or jointly in any bank/ other financial institution/ mobile money service provider.</li><li>Out of 1,00,000 persons of age 18 years and above, 16,223 persons in rural areas and 14,889 persons in urban areas were indebted to any institutional/non-institutional agency as on the date of survey.</li><li>About 92.5 percent of households in rural areas reported availability of all-weather roads within 2 km from the place of living.</li><li>About 11.2 percent of households in rural areas and about 7.2 percent of households in urban areas purchased/constructed any new house/flat for residential purpose after 31.03.2014. &nbsp;</li></ul><p>&nbsp;</p><p><strong>Table 1:&nbsp;Percentage distribution of households by distance to the principal source of drinking water</strong></p><p><img alt="" src="/upload/images/Table%201%20Principle%20source%20of%20drinking%20water.PNG" style="height:206px; width:877px" /></p><p>Source:&nbsp;NSS Report No. 589: Multiple Indicator Survey in India, Ministry of Statistics and Programme Implementation</p><p>&nbsp;</p><p>The table above reveals that 60.5 percent of urban houselholds and 29 percent of rural households have access to drinking water within the dwelling. The all-India average works out to 39.1 percent. 21.2 percent of urban and 30 percent of rural households&#39; primary source of drinking water is outside the dwelling, but within the premesis of residence, whereas 18.4 percent of urban and 41.1 percent of rural households have to step outside the premesis to get their water.&nbsp;&nbsp;</p><p>&nbsp;</p><p><strong>Donut Chart</strong></p><p><iframe class="flourish-embed-iframe" frameborder="0" scrolling="no" src="https://flo.uri.sh/visualisation/13626204/embed" style="width:100%;height:600px;" title="Interactive or visual content"></iframe></p><div style="margin-top:4px!important; text-align:right!important; width:100%!"><a href="https://public.flourish.studio/visualisation/13626204/?utm_source=embed&amp;utm_campaign=visualisation/13626204" style="text-decoration:none!important" target="_top" title="https://public.flourish.studio/visualisation/13626204/?utm_source=embed&amp;utm_campaign=visualisation/13626204" style="text-decoration:none!important" target="_top"> </a></div><p>&nbsp;</p><p>A household was considered to have&nbsp;access to a latrine if majority of the household members had the facility of using latrine irrespective of whether it was used by them or not. Information on access to latrine was collected in terms of six categories:&nbsp;(i) exclusive use of household, (ii) common use of households in the building, (iii) public/community use without payment, (iv) public/community use with payment, (v) others and (vi) no latrine. The chart above gives the average of urban and rural households. Breaking it down into the two categories, 80.8 percent of urban households had exclusive use of a latrine, while among rural households that number was just 68.8 percent. Significantly, 21.3 percent of rural households had no access to a latrine.&nbsp;</p><p>&nbsp;</p><p><strong>Chart 1: Percentage distribution of households by primary source of energy used for cooking</strong></p><p><iframe class="flourish-embed-iframe" frameborder="0" scrolling="no" src="https://flo.uri.sh/visualisation/13625833/embed" style="width:100%;height:600px;" title="Interactive or visual content"></iframe></p><div style="margin-top:4px!important; text-align:right!important; width:100%!"><a href="https://public.flourish.studio/visualisation/13625833/?utm_source=embed&amp;utm_campaign=visualisation/13625833" style="text-decoration:none!important" target="_top" title="https://public.flourish.studio/visualisation/13625833/?utm_source=embed&amp;utm_campaign=visualisation/13625833" style="text-decoration:none!important" target="_top"> </a></div><p>&nbsp;</p><p>&nbsp;</p><p><strong>Chart 2: Persons aged 18 and above who have an active mobile and SIM&nbsp;card in the&nbsp;three months prior to survey</strong></p><p><iframe class="flourish-embed-iframe" frameborder="0" scrolling="no" src="https://flo.uri.sh/visualisation/13626482/embed" style="width:100%;height:600px;" title="Interactive or visual content"></iframe></p><div style="margin-top:4px!important; text-align:right!important; width:100%!"><a href="https://public.flourish.studio/visualisation/13626482/?utm_source=embed&amp;utm_campaign=visualisation/13626482" style="text-decoration:none!important" target="_top" title="https://public.flourish.studio/visualisation/13626482/?utm_source=embed&amp;utm_campaign=visualisation/13626482" style="text-decoration:none!important" target="_top"> </a></div><p>&nbsp;</p><p>&nbsp;</p><p><strong>Table 2:&nbsp;Percentage of persons who have an account individually or jointly in any bank/ other financial institution/mobile money service provider</strong></p><p><img alt="" src="/upload/images/tablw%202%20persons%20with%20bank%20account.PNG" style="height:192px; width:936px" /></p><p>&nbsp;</p><p>The survey was initially planned for January-December, 2020, but due to Covid 19 pandemic, but the the data collection was extended to August 2021. For the central sample, the survey was spread over 14,266 first stage units (8,469 in rural areas and 5,797 in urban areas) covering 2,76,409 sample households (1,64,529 in rural areas and 1,11,880 in urban areas).&nbsp;</p><p>Please click here to access the<a href="/upload/files/MultipleIndicatorSurveyinIndiaf_0.pdf" title="/upload/files/MultipleIndicatorSurveyinIndiaf_0.pdf"> NSSO Report</a><br />Photo Credit:&nbsp;Salahuddin, <a href="https://www.downtoearth.org.in/news/water/nearly-80-per-cent-indian-households-without-piped-water-connection-67928" title="https://www.downtoearth.org.in/news/water/nearly-80-per-cent-indian-households-without-piped-water-connection-67928">Down to Earth</a></p><p>References<br />NSS Report No. 589: Multiple Indicator Survey in India (78th round), Ministry of Statistics and Programme Implementation, March 2023</p>',
'lang' => 'English',
'SITE_URL' => 'https://im4change.in/',
'site_title' => 'im4change',
'adminprix' => 'admin'
]
$article_current = object(App\Model\Entity\Article) {
'id' => (int) 64981,
'title' => 'NSSO Survey: Only 39.1% of all Households have Drinking Water Within Dwelling, 46.7% of Rural Households use Firewood for Cooking',
'subheading' => null,
'description' => '<p>The National Sample Survey Organization&#39;s <a href="https://www.mospi.gov.in/sites/default/files/publication_reports/MultipleIndicatorSurveyinIndiaf_0.pdf">Multiple Indicator Survey</a> - part of the 78th round - has revealed that only 39.1 percent of all Indian households have access to drinking water within the &nbsp;dwelling. When it come to cooking, 46.7% of rural households use firewood.&nbsp;</p>
<p>These are some of the findings of the survey whose purpose was to collect data about the indicators of Sustainable Development Goals. Data was collected for households and population; drinking water and sanitation; household energy use; education and ICT skills; mobile/broadband and mass media; financial inclusion and indebtedness; birth registration; purchase/construction of new house; migration.</p>
<p>The key findings are:</p>
<ul>
<li>&nbsp;About 95.0 percent of the persons in the rural areas and about 97.2 percent of the persons in the urban areas used &lsquo;improved source of drinking water&#39;.&nbsp;</li>
<li>&nbsp;About 56.3 percent of the persons in the rural areas and about 76.3 percent of the persons in the urban areas used improved source of drinking water located in the household premises which was sufficiently available throughout the year. &nbsp;</li>
<li>Among the persons who had reported access to latrine and hand washing facility, about 73.3 percent of the persons in the rural areas and about 81.4 percent of the persons in the urban areas had exclusive access to improved latrine and hand washing facilities with water and soap/detergent within the household premises.</li>
<li>About 49.8 percent of households in the rural areas and about 92.0 percent of households in the urban areas used clean fuel as primary source of energy for cooking. Here clean fuel refers to LPG, other natural gas, gobar gas, other biogas, electricity.</li>
<li>&nbsp;About 33.0 percent of persons in rural areas and about 39.4 percent of persons in urban areas of age 15-29 years were in formal and non-formal education and training for the 12 months preceding the survey.</li>
<li>About 67.8 percent of persons of age 18 years and above in rural areas and about 83.7 percent of persons of age 18 years and above in urban areas used mobile telephone with active sim card during the three months preceding the date of the survey.</li>
<li>Among the persons of age 18 years and above, about 89.3 percent of persons in rural areas and about 89.6 percent of persons in urban areas had an account individually or jointly in any bank/ other financial institution/ mobile money service provider.</li>
<li>Out of 1,00,000 persons of age 18 years and above, 16,223 persons in rural areas and 14,889 persons in urban areas were indebted to any institutional/non-institutional agency as on the date of survey.</li>
<li>About 92.5 percent of households in rural areas reported availability of all-weather roads within 2 km from the place of living.</li>
<li>About 11.2 percent of households in rural areas and about 7.2 percent of households in urban areas purchased/constructed any new house/flat for residential purpose after 31.03.2014. &nbsp;</li>
</ul>
<p>&nbsp;</p>
<p><strong>Table 1:&nbsp;Percentage distribution of households by distance to the principal source of drinking water</strong></p>
<p><img alt="" src="/upload/images/Table%201%20Principle%20source%20of%20drinking%20water.PNG" style="height:206px; width:877px" /></p>
<p>Source:&nbsp;NSS Report No. 589: Multiple Indicator Survey in India, Ministry of Statistics and Programme Implementation</p>
<p>&nbsp;</p>
<p>The table above reveals that 60.5 percent of urban houselholds and 29 percent of rural households have access to drinking water within the dwelling. The all-India average works out to 39.1 percent. 21.2 percent of urban and 30 percent of rural households&#39; primary source of drinking water is outside the dwelling, but within the premesis of residence, whereas 18.4 percent of urban and 41.1 percent of rural households have to step outside the premesis to get their water.&nbsp;&nbsp;</p>
<p>&nbsp;</p>
<p><strong>Donut Chart</strong></p>
<p><iframe class="flourish-embed-iframe" frameborder="0" scrolling="no" src="https://flo.uri.sh/visualisation/13626204/embed" style="width:100%;height:600px;" title="Interactive or visual content"></iframe></p>
<div style="margin-top:4px!important; text-align:right!important; width:100%!"><a class="flourish-credit" href="https://public.flourish.studio/visualisation/13626204/?utm_source=embed&amp;utm_campaign=visualisation/13626204" style="text-decoration:none!important" target="_top"><img alt="Made with Flourish" src="https://public.flourish.studio/resources/made_with_flourish.svg" style="border:none!important; height:16px!important; margin:0!important; width:105px!important" /> </a></div>
<p>&nbsp;</p>
<p>A household was considered to have&nbsp;access to a latrine if majority of the household members had the facility of using latrine irrespective of whether it was used by them or not. Information on access to latrine was collected in terms of six categories:&nbsp;(i) exclusive use of household, (ii) common use of households in the building, (iii) public/community use without payment, (iv) public/community use with payment, (v) others and (vi) no latrine. The chart above gives the average of urban and rural households. Breaking it down into the two categories, 80.8 percent of urban households had exclusive use of a latrine, while among rural households that number was just 68.8 percent. Significantly, 21.3 percent of rural households had no access to a latrine.&nbsp;</p>
<p>&nbsp;</p>
<p><strong>Chart 1: Percentage distribution of households by primary source of energy used for cooking</strong></p>
<p><iframe class="flourish-embed-iframe" frameborder="0" scrolling="no" src="https://flo.uri.sh/visualisation/13625833/embed" style="width:100%;height:600px;" title="Interactive or visual content"></iframe></p>
<div style="margin-top:4px!important; text-align:right!important; width:100%!"><a class="flourish-credit" href="https://public.flourish.studio/visualisation/13625833/?utm_source=embed&amp;utm_campaign=visualisation/13625833" style="text-decoration:none!important" target="_top"><img alt="Made with Flourish" src="https://public.flourish.studio/resources/made_with_flourish.svg" style="border:none!important; height:16px!important; margin:0!important; width:105px!important" /> </a></div>
<p>&nbsp;</p>
<p>&nbsp;</p>
<p><strong>Chart 2: Persons aged 18 and above who have an active mobile and SIM&nbsp;card in the&nbsp;three months prior to survey</strong></p>
<p><iframe class="flourish-embed-iframe" frameborder="0" scrolling="no" src="https://flo.uri.sh/visualisation/13626482/embed" style="width:100%;height:600px;" title="Interactive or visual content"></iframe></p>
<div style="margin-top:4px!important; text-align:right!important; width:100%!"><a class="flourish-credit" href="https://public.flourish.studio/visualisation/13626482/?utm_source=embed&amp;utm_campaign=visualisation/13626482" style="text-decoration:none!important" target="_top"><img alt="Made with Flourish" src="https://public.flourish.studio/resources/made_with_flourish.svg" style="border:none!important; height:16px!important; margin:0!important; width:105px!important" /> </a></div>
<p>&nbsp;</p>
<p>&nbsp;</p>
<p><strong>Table 2:&nbsp;Percentage of persons who have an account individually or jointly in any bank/ other financial institution/mobile money service provider</strong></p>
<p><img alt="" src="/upload/images/tablw%202%20persons%20with%20bank%20account.PNG" style="height:192px; width:936px" /></p>
<p>&nbsp;</p>
<p>The survey was initially planned for January-December, 2020, but due to Covid 19 pandemic, but the the data collection was extended to August 2021. For the central sample, the survey was spread over 14,266 first stage units (8,469 in rural areas and 5,797 in urban areas) covering 2,76,409 sample households (1,64,529 in rural areas and 1,11,880 in urban areas).&nbsp;</p>
<p>Please click here to access the<a href="/upload/files/MultipleIndicatorSurveyinIndiaf_0.pdf"> NSSO Report</a><br />
Photo Credit:&nbsp;Salahuddin, <a href="https://www.downtoearth.org.in/news/water/nearly-80-per-cent-indian-households-without-piped-water-connection-67928">Down to Earth</a></p>
<p>References<br />
NSS Report No. 589: Multiple Indicator Survey in India (78th round), Ministry of Statistics and Programme Implementation, March 2023</p>
',
'credit_writer' => 'National Sample Survey Organization, https://www.mospi.gov.in/sites/default/files/publication_reports/MultipleIndicatorSurveyinIndiaf_0.pdf',
'article_img' => '0.79217900_1574689453_dig015840.jpg',
'article_img_thumb' => '0.79217900_1574689453_dig015840.jpg',
'status' => (int) 1,
'show_on_home' => (int) 1,
'lang' => 'EN',
'category_id' => (int) 4,
'tag_keyword' => '',
'seo_url' => 'nsso-survey-only-39-1-of-all-households-have-drinking-water-within-dwelling-46-7-of-rural-households-use-firewood-for-cooking',
'meta_title' => '',
'meta_keywords' => '',
'meta_description' => '',
'noindex' => (int) 1,
'publish_date' => object(Cake\I18n\FrozenDate) {},
'most_visit_section_id' => null,
'article_big_img' => null,
'liveid' => null,
'created' => object(Cake\I18n\FrozenTime) {},
'modified' => object(Cake\I18n\FrozenTime) {},
'edate' => '',
'tags' => [
(int) 0 => object(Cake\ORM\Entity) {},
(int) 1 => object(Cake\ORM\Entity) {},
(int) 2 => object(Cake\ORM\Entity) {},
(int) 3 => object(Cake\ORM\Entity) {},
(int) 4 => object(Cake\ORM\Entity) {},
(int) 5 => object(Cake\ORM\Entity) {},
(int) 6 => object(Cake\ORM\Entity) {},
(int) 7 => object(Cake\ORM\Entity) {},
(int) 8 => object(Cake\ORM\Entity) {},
(int) 9 => object(Cake\ORM\Entity) {},
(int) 10 => object(Cake\ORM\Entity) {},
(int) 11 => object(Cake\ORM\Entity) {}
],
'category' => object(App\Model\Entity\Category) {},
'[new]' => false,
'[accessible]' => [
'*' => true,
'id' => false
],
'[dirty]' => [],
'[original]' => [],
'[virtual]' => [],
'[hasErrors]' => false,
'[errors]' => [],
'[invalid]' => [],
'[repository]' => 'Articles'
}
$articleid = (int) 64981
$metaTitle = 'NEWS ALERTS | NSSO Survey: Only 39.1% of all Households have Drinking Water Within Dwelling, 46.7% of Rural Households use Firewood for Cooking'
$metaKeywords = '78th Round,Drinking Water,Education,Financial Inclusion,Household Energy Use,Mass Media,Migration,Mobile Broadband,Multiple Indicator Survey,National Sample Survey,NSSO,Sanitation'
$metaDesc = 'The National Sample Survey Organization&#39;s Multiple Indicator Survey - part of the 78th round - has revealed that only 39.1 percent of all Indian households have access to drinking water within the &nbsp;dwelling. When it come to cooking, 46.7% of...'
$disp = '<p>The National Sample Survey Organization&#39;s <a href="https://www.mospi.gov.in/sites/default/files/publication_reports/MultipleIndicatorSurveyinIndiaf_0.pdf" title="https://www.mospi.gov.in/sites/default/files/publication_reports/MultipleIndicatorSurveyinIndiaf_0.pdf">Multiple Indicator Survey</a> - part of the 78th round - has revealed that only 39.1 percent of all Indian households have access to drinking water within the &nbsp;dwelling. When it come to cooking, 46.7% of rural households use firewood.&nbsp;</p><p>These are some of the findings of the survey whose purpose was to collect data about the indicators of Sustainable Development Goals. Data was collected for households and population; drinking water and sanitation; household energy use; education and ICT skills; mobile/broadband and mass media; financial inclusion and indebtedness; birth registration; purchase/construction of new house; migration.</p><p>The key findings are:</p><ul><li>&nbsp;About 95.0 percent of the persons in the rural areas and about 97.2 percent of the persons in the urban areas used &lsquo;improved source of drinking water&#39;.&nbsp;</li><li>&nbsp;About 56.3 percent of the persons in the rural areas and about 76.3 percent of the persons in the urban areas used improved source of drinking water located in the household premises which was sufficiently available throughout the year. &nbsp;</li><li>Among the persons who had reported access to latrine and hand washing facility, about 73.3 percent of the persons in the rural areas and about 81.4 percent of the persons in the urban areas had exclusive access to improved latrine and hand washing facilities with water and soap/detergent within the household premises.</li><li>About 49.8 percent of households in the rural areas and about 92.0 percent of households in the urban areas used clean fuel as primary source of energy for cooking. Here clean fuel refers to LPG, other natural gas, gobar gas, other biogas, electricity.</li><li>&nbsp;About 33.0 percent of persons in rural areas and about 39.4 percent of persons in urban areas of age 15-29 years were in formal and non-formal education and training for the 12 months preceding the survey.</li><li>About 67.8 percent of persons of age 18 years and above in rural areas and about 83.7 percent of persons of age 18 years and above in urban areas used mobile telephone with active sim card during the three months preceding the date of the survey.</li><li>Among the persons of age 18 years and above, about 89.3 percent of persons in rural areas and about 89.6 percent of persons in urban areas had an account individually or jointly in any bank/ other financial institution/ mobile money service provider.</li><li>Out of 1,00,000 persons of age 18 years and above, 16,223 persons in rural areas and 14,889 persons in urban areas were indebted to any institutional/non-institutional agency as on the date of survey.</li><li>About 92.5 percent of households in rural areas reported availability of all-weather roads within 2 km from the place of living.</li><li>About 11.2 percent of households in rural areas and about 7.2 percent of households in urban areas purchased/constructed any new house/flat for residential purpose after 31.03.2014. &nbsp;</li></ul><p>&nbsp;</p><p><strong>Table 1:&nbsp;Percentage distribution of households by distance to the principal source of drinking water</strong></p><p><img alt="" src="/upload/images/Table%201%20Principle%20source%20of%20drinking%20water.PNG" style="height:206px; width:877px" /></p><p>Source:&nbsp;NSS Report No. 589: Multiple Indicator Survey in India, Ministry of Statistics and Programme Implementation</p><p>&nbsp;</p><p>The table above reveals that 60.5 percent of urban houselholds and 29 percent of rural households have access to drinking water within the dwelling. The all-India average works out to 39.1 percent. 21.2 percent of urban and 30 percent of rural households&#39; primary source of drinking water is outside the dwelling, but within the premesis of residence, whereas 18.4 percent of urban and 41.1 percent of rural households have to step outside the premesis to get their water.&nbsp;&nbsp;</p><p>&nbsp;</p><p><strong>Donut Chart</strong></p><p><iframe class="flourish-embed-iframe" frameborder="0" scrolling="no" src="https://flo.uri.sh/visualisation/13626204/embed" style="width:100%;height:600px;" title="Interactive or visual content"></iframe></p><div style="margin-top:4px!important; text-align:right!important; width:100%!"><a href="https://public.flourish.studio/visualisation/13626204/?utm_source=embed&amp;utm_campaign=visualisation/13626204" style="text-decoration:none!important" target="_top" title="https://public.flourish.studio/visualisation/13626204/?utm_source=embed&amp;utm_campaign=visualisation/13626204" style="text-decoration:none!important" target="_top"> </a></div><p>&nbsp;</p><p>A household was considered to have&nbsp;access to a latrine if majority of the household members had the facility of using latrine irrespective of whether it was used by them or not. Information on access to latrine was collected in terms of six categories:&nbsp;(i) exclusive use of household, (ii) common use of households in the building, (iii) public/community use without payment, (iv) public/community use with payment, (v) others and (vi) no latrine. The chart above gives the average of urban and rural households. Breaking it down into the two categories, 80.8 percent of urban households had exclusive use of a latrine, while among rural households that number was just 68.8 percent. Significantly, 21.3 percent of rural households had no access to a latrine.&nbsp;</p><p>&nbsp;</p><p><strong>Chart 1: Percentage distribution of households by primary source of energy used for cooking</strong></p><p><iframe class="flourish-embed-iframe" frameborder="0" scrolling="no" src="https://flo.uri.sh/visualisation/13625833/embed" style="width:100%;height:600px;" title="Interactive or visual content"></iframe></p><div style="margin-top:4px!important; text-align:right!important; width:100%!"><a href="https://public.flourish.studio/visualisation/13625833/?utm_source=embed&amp;utm_campaign=visualisation/13625833" style="text-decoration:none!important" target="_top" title="https://public.flourish.studio/visualisation/13625833/?utm_source=embed&amp;utm_campaign=visualisation/13625833" style="text-decoration:none!important" target="_top"> </a></div><p>&nbsp;</p><p>&nbsp;</p><p><strong>Chart 2: Persons aged 18 and above who have an active mobile and SIM&nbsp;card in the&nbsp;three months prior to survey</strong></p><p><iframe class="flourish-embed-iframe" frameborder="0" scrolling="no" src="https://flo.uri.sh/visualisation/13626482/embed" style="width:100%;height:600px;" title="Interactive or visual content"></iframe></p><div style="margin-top:4px!important; text-align:right!important; width:100%!"><a href="https://public.flourish.studio/visualisation/13626482/?utm_source=embed&amp;utm_campaign=visualisation/13626482" style="text-decoration:none!important" target="_top" title="https://public.flourish.studio/visualisation/13626482/?utm_source=embed&amp;utm_campaign=visualisation/13626482" style="text-decoration:none!important" target="_top"> </a></div><p>&nbsp;</p><p>&nbsp;</p><p><strong>Table 2:&nbsp;Percentage of persons who have an account individually or jointly in any bank/ other financial institution/mobile money service provider</strong></p><p><img alt="" src="/upload/images/tablw%202%20persons%20with%20bank%20account.PNG" style="height:192px; width:936px" /></p><p>&nbsp;</p><p>The survey was initially planned for January-December, 2020, but due to Covid 19 pandemic, but the the data collection was extended to August 2021. For the central sample, the survey was spread over 14,266 first stage units (8,469 in rural areas and 5,797 in urban areas) covering 2,76,409 sample households (1,64,529 in rural areas and 1,11,880 in urban areas).&nbsp;</p><p>Please click here to access the<a href="/upload/files/MultipleIndicatorSurveyinIndiaf_0.pdf" title="/upload/files/MultipleIndicatorSurveyinIndiaf_0.pdf"> NSSO Report</a><br />Photo Credit:&nbsp;Salahuddin, <a href="https://www.downtoearth.org.in/news/water/nearly-80-per-cent-indian-households-without-piped-water-connection-67928" title="https://www.downtoearth.org.in/news/water/nearly-80-per-cent-indian-households-without-piped-water-connection-67928">Down to Earth</a></p><p>References<br />NSS Report No. 589: Multiple Indicator Survey in India (78th round), Ministry of Statistics and Programme Implementation, March 2023</p>'
$lang = 'English'
$SITE_URL = 'https://im4change.in/'
$site_title = 'im4change'
$adminprix = 'admin'</pre><pre class="stack-trace">include - APP/Template/Layout/printlayout.ctp, line 8
Cake\View\View::_evaluate() - CORE/src/View/View.php, line 1413
Cake\View\View::_render() - CORE/src/View/View.php, line 1374
Cake\View\View::renderLayout() - CORE/src/View/View.php, line 927
Cake\View\View::render() - CORE/src/View/View.php, line 885
Cake\Controller\Controller::render() - CORE/src/Controller/Controller.php, line 791
Cake\Http\ActionDispatcher::_invoke() - CORE/src/Http/ActionDispatcher.php, line 126
Cake\Http\ActionDispatcher::dispatch() - CORE/src/Http/ActionDispatcher.php, line 94
Cake\Http\BaseApplication::__invoke() - CORE/src/Http/BaseApplication.php, line 235
Cake\Http\Runner::__invoke() - CORE/src/Http/Runner.php, line 65
Cake\Routing\Middleware\RoutingMiddleware::__invoke() - CORE/src/Routing/Middleware/RoutingMiddleware.php, line 162
Cake\Http\Runner::__invoke() - CORE/src/Http/Runner.php, line 65
Cake\Routing\Middleware\AssetMiddleware::__invoke() - CORE/src/Routing/Middleware/AssetMiddleware.php, line 88
Cake\Http\Runner::__invoke() - CORE/src/Http/Runner.php, line 65
Cake\Error\Middleware\ErrorHandlerMiddleware::__invoke() - CORE/src/Error/Middleware/ErrorHandlerMiddleware.php, line 96
Cake\Http\Runner::__invoke() - CORE/src/Http/Runner.php, line 65
Cake\Http\Runner::run() - CORE/src/Http/Runner.php, line 51</pre></div></pre>news-alerts-57/nsso-survey-only-39-1-of-all-households-have-drinking-water-within-dwelling-46-7-of-rural-households-use-firewood-for-cooking.html"/>
<meta http-equiv="Content-Type" content="text/html; charset=utf-8"/>
<link href="https://im4change.in/css/control.css" rel="stylesheet" type="text/css"
media="all"/>
<title>NEWS ALERTS | NSSO Survey: Only 39.1% of all Households have Drinking Water Within Dwelling, 46.7% of Rural Households use Firewood for Cooking | Im4change.org</title>
<meta name="description" content="The National Sample Survey Organization's Multiple Indicator Survey - part of the 78th round - has revealed that only 39.1 percent of all Indian households have access to drinking water within the dwelling. When it come to cooking, 46.7% of..."/>
<script src="https://im4change.in/js/jquery-1.10.2.js"></script>
<script type="text/javascript" src="https://im4change.in/js/jquery-migrate.min.js"></script>
<script language="javascript" type="text/javascript">
$(document).ready(function () {
var img = $("img")[0]; // Get my img elem
var pic_real_width, pic_real_height;
$("<img/>") // Make in memory copy of image to avoid css issues
.attr("src", $(img).attr("src"))
.load(function () {
pic_real_width = this.width; // Note: $(this).width() will not
pic_real_height = this.height; // work for in memory images.
});
});
</script>
<style type="text/css">
@media screen {
div.divFooter {
display: block;
}
}
@media print {
.printbutton {
display: none !important;
}
}
</style>
</head>
<body>
<table cellpadding="0" cellspacing="0" border="0" width="98%" align="center">
<tr>
<td class="top_bg">
<div class="divFooter">
<img src="https://im4change.in/images/logo1.jpg" height="59" border="0"
alt="Resource centre on India's rural distress" style="padding-top:14px;"/>
</div>
</td>
</tr>
<tr>
<td id="topspace"> </td>
</tr>
<tr id="topspace">
<td> </td>
</tr>
<tr>
<td height="50" style="border-bottom:1px solid #000; padding-top:10px;" class="printbutton">
<form><input type="button" value=" Print this page "
onclick="window.print();return false;"/></form>
</td>
</tr>
<tr>
<td width="100%">
<h1 class="news_headlines" style="font-style:normal">
<strong>NSSO Survey: Only 39.1% of all Households have Drinking Water Within Dwelling, 46.7% of Rural Households use Firewood for Cooking</strong></h1>
</td>
</tr>
<tr>
<td width="100%" style="font-family:Arial, 'Segoe Script', 'Segoe UI', sans-serif, serif"><font size="3">
<p>The National Sample Survey Organization's <a href="https://www.mospi.gov.in/sites/default/files/publication_reports/MultipleIndicatorSurveyinIndiaf_0.pdf" title="https://www.mospi.gov.in/sites/default/files/publication_reports/MultipleIndicatorSurveyinIndiaf_0.pdf">Multiple Indicator Survey</a> - part of the 78th round - has revealed that only 39.1 percent of all Indian households have access to drinking water within the dwelling. When it come to cooking, 46.7% of rural households use firewood. </p><p>These are some of the findings of the survey whose purpose was to collect data about the indicators of Sustainable Development Goals. Data was collected for households and population; drinking water and sanitation; household energy use; education and ICT skills; mobile/broadband and mass media; financial inclusion and indebtedness; birth registration; purchase/construction of new house; migration.</p><p>The key findings are:</p><ul><li> About 95.0 percent of the persons in the rural areas and about 97.2 percent of the persons in the urban areas used ‘improved source of drinking water'. </li><li> About 56.3 percent of the persons in the rural areas and about 76.3 percent of the persons in the urban areas used improved source of drinking water located in the household premises which was sufficiently available throughout the year. </li><li>Among the persons who had reported access to latrine and hand washing facility, about 73.3 percent of the persons in the rural areas and about 81.4 percent of the persons in the urban areas had exclusive access to improved latrine and hand washing facilities with water and soap/detergent within the household premises.</li><li>About 49.8 percent of households in the rural areas and about 92.0 percent of households in the urban areas used clean fuel as primary source of energy for cooking. Here clean fuel refers to LPG, other natural gas, gobar gas, other biogas, electricity.</li><li> About 33.0 percent of persons in rural areas and about 39.4 percent of persons in urban areas of age 15-29 years were in formal and non-formal education and training for the 12 months preceding the survey.</li><li>About 67.8 percent of persons of age 18 years and above in rural areas and about 83.7 percent of persons of age 18 years and above in urban areas used mobile telephone with active sim card during the three months preceding the date of the survey.</li><li>Among the persons of age 18 years and above, about 89.3 percent of persons in rural areas and about 89.6 percent of persons in urban areas had an account individually or jointly in any bank/ other financial institution/ mobile money service provider.</li><li>Out of 1,00,000 persons of age 18 years and above, 16,223 persons in rural areas and 14,889 persons in urban areas were indebted to any institutional/non-institutional agency as on the date of survey.</li><li>About 92.5 percent of households in rural areas reported availability of all-weather roads within 2 km from the place of living.</li><li>About 11.2 percent of households in rural areas and about 7.2 percent of households in urban areas purchased/constructed any new house/flat for residential purpose after 31.03.2014. </li></ul><p> </p><p><strong>Table 1: Percentage distribution of households by distance to the principal source of drinking water</strong></p><p><img alt="" src="/upload/images/Table%201%20Principle%20source%20of%20drinking%20water.PNG" style="height:206px; width:877px" /></p><p>Source: NSS Report No. 589: Multiple Indicator Survey in India, Ministry of Statistics and Programme Implementation</p><p> </p><p>The table above reveals that 60.5 percent of urban houselholds and 29 percent of rural households have access to drinking water within the dwelling. The all-India average works out to 39.1 percent. 21.2 percent of urban and 30 percent of rural households' primary source of drinking water is outside the dwelling, but within the premesis of residence, whereas 18.4 percent of urban and 41.1 percent of rural households have to step outside the premesis to get their water. </p><p> </p><p><strong>Donut Chart</strong></p><p><iframe class="flourish-embed-iframe" frameborder="0" scrolling="no" src="https://flo.uri.sh/visualisation/13626204/embed" style="width:100%;height:600px;" title="Interactive or visual content"></iframe></p><div style="margin-top:4px!important; text-align:right!important; width:100%!"><a href="https://public.flourish.studio/visualisation/13626204/?utm_source=embed&utm_campaign=visualisation/13626204" style="text-decoration:none!important" target="_top" title="https://public.flourish.studio/visualisation/13626204/?utm_source=embed&utm_campaign=visualisation/13626204" style="text-decoration:none!important" target="_top"> </a></div><p> </p><p>A household was considered to have access to a latrine if majority of the household members had the facility of using latrine irrespective of whether it was used by them or not. Information on access to latrine was collected in terms of six categories: (i) exclusive use of household, (ii) common use of households in the building, (iii) public/community use without payment, (iv) public/community use with payment, (v) others and (vi) no latrine. The chart above gives the average of urban and rural households. Breaking it down into the two categories, 80.8 percent of urban households had exclusive use of a latrine, while among rural households that number was just 68.8 percent. Significantly, 21.3 percent of rural households had no access to a latrine. </p><p> </p><p><strong>Chart 1: Percentage distribution of households by primary source of energy used for cooking</strong></p><p><iframe class="flourish-embed-iframe" frameborder="0" scrolling="no" src="https://flo.uri.sh/visualisation/13625833/embed" style="width:100%;height:600px;" title="Interactive or visual content"></iframe></p><div style="margin-top:4px!important; text-align:right!important; width:100%!"><a href="https://public.flourish.studio/visualisation/13625833/?utm_source=embed&utm_campaign=visualisation/13625833" style="text-decoration:none!important" target="_top" title="https://public.flourish.studio/visualisation/13625833/?utm_source=embed&utm_campaign=visualisation/13625833" style="text-decoration:none!important" target="_top"> </a></div><p> </p><p> </p><p><strong>Chart 2: Persons aged 18 and above who have an active mobile and SIM card in the three months prior to survey</strong></p><p><iframe class="flourish-embed-iframe" frameborder="0" scrolling="no" src="https://flo.uri.sh/visualisation/13626482/embed" style="width:100%;height:600px;" title="Interactive or visual content"></iframe></p><div style="margin-top:4px!important; text-align:right!important; width:100%!"><a href="https://public.flourish.studio/visualisation/13626482/?utm_source=embed&utm_campaign=visualisation/13626482" style="text-decoration:none!important" target="_top" title="https://public.flourish.studio/visualisation/13626482/?utm_source=embed&utm_campaign=visualisation/13626482" style="text-decoration:none!important" target="_top"> </a></div><p> </p><p> </p><p><strong>Table 2: Percentage of persons who have an account individually or jointly in any bank/ other financial institution/mobile money service provider</strong></p><p><img alt="" src="/upload/images/tablw%202%20persons%20with%20bank%20account.PNG" style="height:192px; width:936px" /></p><p> </p><p>The survey was initially planned for January-December, 2020, but due to Covid 19 pandemic, but the the data collection was extended to August 2021. For the central sample, the survey was spread over 14,266 first stage units (8,469 in rural areas and 5,797 in urban areas) covering 2,76,409 sample households (1,64,529 in rural areas and 1,11,880 in urban areas). </p><p>Please click here to access the<a href="/upload/files/MultipleIndicatorSurveyinIndiaf_0.pdf" title="/upload/files/MultipleIndicatorSurveyinIndiaf_0.pdf"> NSSO Report</a><br />Photo Credit: Salahuddin, <a href="https://www.downtoearth.org.in/news/water/nearly-80-per-cent-indian-households-without-piped-water-connection-67928" title="https://www.downtoearth.org.in/news/water/nearly-80-per-cent-indian-households-without-piped-water-connection-67928">Down to Earth</a></p><p>References<br />NSS Report No. 589: Multiple Indicator Survey in India (78th round), Ministry of Statistics and Programme Implementation, March 2023</p> </font>
</td>
</tr>
<tr>
<td> </td>
</tr>
<tr>
<td height="50" style="border-top:1px solid #000; border-bottom:1px solid #000;padding-top:10px;">
<form><input type="button" value=" Print this page "
onclick="window.print();return false;"/></form>
</td>
</tr>
</table></body>
</html>'
}
$reasonPhrase = 'OK'
header - [internal], line ??
Cake\Http\ResponseEmitter::emitStatusLine() - CORE/src/Http/ResponseEmitter.php, line 148
Cake\Http\ResponseEmitter::emit() - CORE/src/Http/ResponseEmitter.php, line 54
Cake\Http\Server::emit() - CORE/src/Http/Server.php, line 141
[main] - ROOT/webroot/index.php, line 39
Warning (2): Cannot modify header information - headers already sent by (output started at /home/brlfuser/public_html/vendor/cakephp/cakephp/src/Error/Debugger.php:853) [CORE/src/Http/ResponseEmitter.php, line 181]
$response = object(Cake\Http\Response) {
'status' => (int) 200,
'contentType' => 'text/html',
'headers' => [
'Content-Type' => [
[maximum depth reached]
]
],
'file' => null,
'fileRange' => [],
'cookies' => object(Cake\Http\Cookie\CookieCollection) {},
'cacheDirectives' => [],
'body' => '<!DOCTYPE html PUBLIC "-//W3C//DTD XHTML 1.0 Transitional//EN"
"http://www.w3.org/TR/xhtml1/DTD/xhtml1-transitional.dtd">
<html xmlns="http://www.w3.org/1999/xhtml">
<head>
<link rel="canonical" href="https://im4change.in/<pre class="cake-error"><a href="javascript:void(0);" onclick="document.getElementById('cakeErr67eb7b2c4e81e-trace').style.display = (document.getElementById('cakeErr67eb7b2c4e81e-trace').style.display == 'none' ? '' : 'none');"><b>Notice</b> (8)</a>: Undefined variable: urlPrefix [<b>APP/Template/Layout/printlayout.ctp</b>, line <b>8</b>]<div id="cakeErr67eb7b2c4e81e-trace" class="cake-stack-trace" style="display: none;"><a href="javascript:void(0);" onclick="document.getElementById('cakeErr67eb7b2c4e81e-code').style.display = (document.getElementById('cakeErr67eb7b2c4e81e-code').style.display == 'none' ? '' : 'none')">Code</a> <a href="javascript:void(0);" onclick="document.getElementById('cakeErr67eb7b2c4e81e-context').style.display = (document.getElementById('cakeErr67eb7b2c4e81e-context').style.display == 'none' ? '' : 'none')">Context</a><pre id="cakeErr67eb7b2c4e81e-code" class="cake-code-dump" style="display: none;"><code><span style="color: #000000"><span style="color: #0000BB"></span><span style="color: #007700"><</span><span style="color: #0000BB">head</span><span style="color: #007700">>
</span></span></code>
<span class="code-highlight"><code><span style="color: #000000"> <link rel="canonical" href="<span style="color: #0000BB"><?php </span><span style="color: #007700">echo </span><span style="color: #0000BB">Configure</span><span style="color: #007700">::</span><span style="color: #0000BB">read</span><span style="color: #007700">(</span><span style="color: #DD0000">'SITE_URL'</span><span style="color: #007700">); </span><span style="color: #0000BB">?><?php </span><span style="color: #007700">echo </span><span style="color: #0000BB">$urlPrefix</span><span style="color: #007700">;</span><span style="color: #0000BB">?><?php </span><span style="color: #007700">echo </span><span style="color: #0000BB">$article_current</span><span style="color: #007700">-></span><span style="color: #0000BB">category</span><span style="color: #007700">-></span><span style="color: #0000BB">slug</span><span style="color: #007700">; </span><span style="color: #0000BB">?></span>/<span style="color: #0000BB"><?php </span><span style="color: #007700">echo </span><span style="color: #0000BB">$article_current</span><span style="color: #007700">-></span><span style="color: #0000BB">seo_url</span><span style="color: #007700">; </span><span style="color: #0000BB">?></span>.html"/>
</span></code></span>
<code><span style="color: #000000"><span style="color: #0000BB"> </span><span style="color: #007700"><</span><span style="color: #0000BB">meta http</span><span style="color: #007700">-</span><span style="color: #0000BB">equiv</span><span style="color: #007700">=</span><span style="color: #DD0000">"Content-Type" </span><span style="color: #0000BB">content</span><span style="color: #007700">=</span><span style="color: #DD0000">"text/html; charset=utf-8"</span><span style="color: #007700">/>
</span></span></code></pre><pre id="cakeErr67eb7b2c4e81e-context" class="cake-context" style="display: none;">$viewFile = '/home/brlfuser/public_html/src/Template/Layout/printlayout.ctp'
$dataForView = [
'article_current' => object(App\Model\Entity\Article) {
'id' => (int) 64981,
'title' => 'NSSO Survey: Only 39.1% of all Households have Drinking Water Within Dwelling, 46.7% of Rural Households use Firewood for Cooking',
'subheading' => null,
'description' => '<p>The National Sample Survey Organization&#39;s <a href="https://www.mospi.gov.in/sites/default/files/publication_reports/MultipleIndicatorSurveyinIndiaf_0.pdf">Multiple Indicator Survey</a> - part of the 78th round - has revealed that only 39.1 percent of all Indian households have access to drinking water within the &nbsp;dwelling. When it come to cooking, 46.7% of rural households use firewood.&nbsp;</p>
<p>These are some of the findings of the survey whose purpose was to collect data about the indicators of Sustainable Development Goals. Data was collected for households and population; drinking water and sanitation; household energy use; education and ICT skills; mobile/broadband and mass media; financial inclusion and indebtedness; birth registration; purchase/construction of new house; migration.</p>
<p>The key findings are:</p>
<ul>
<li>&nbsp;About 95.0 percent of the persons in the rural areas and about 97.2 percent of the persons in the urban areas used &lsquo;improved source of drinking water&#39;.&nbsp;</li>
<li>&nbsp;About 56.3 percent of the persons in the rural areas and about 76.3 percent of the persons in the urban areas used improved source of drinking water located in the household premises which was sufficiently available throughout the year. &nbsp;</li>
<li>Among the persons who had reported access to latrine and hand washing facility, about 73.3 percent of the persons in the rural areas and about 81.4 percent of the persons in the urban areas had exclusive access to improved latrine and hand washing facilities with water and soap/detergent within the household premises.</li>
<li>About 49.8 percent of households in the rural areas and about 92.0 percent of households in the urban areas used clean fuel as primary source of energy for cooking. Here clean fuel refers to LPG, other natural gas, gobar gas, other biogas, electricity.</li>
<li>&nbsp;About 33.0 percent of persons in rural areas and about 39.4 percent of persons in urban areas of age 15-29 years were in formal and non-formal education and training for the 12 months preceding the survey.</li>
<li>About 67.8 percent of persons of age 18 years and above in rural areas and about 83.7 percent of persons of age 18 years and above in urban areas used mobile telephone with active sim card during the three months preceding the date of the survey.</li>
<li>Among the persons of age 18 years and above, about 89.3 percent of persons in rural areas and about 89.6 percent of persons in urban areas had an account individually or jointly in any bank/ other financial institution/ mobile money service provider.</li>
<li>Out of 1,00,000 persons of age 18 years and above, 16,223 persons in rural areas and 14,889 persons in urban areas were indebted to any institutional/non-institutional agency as on the date of survey.</li>
<li>About 92.5 percent of households in rural areas reported availability of all-weather roads within 2 km from the place of living.</li>
<li>About 11.2 percent of households in rural areas and about 7.2 percent of households in urban areas purchased/constructed any new house/flat for residential purpose after 31.03.2014. &nbsp;</li>
</ul>
<p>&nbsp;</p>
<p><strong>Table 1:&nbsp;Percentage distribution of households by distance to the principal source of drinking water</strong></p>
<p><img alt="" src="/upload/images/Table%201%20Principle%20source%20of%20drinking%20water.PNG" style="height:206px; width:877px" /></p>
<p>Source:&nbsp;NSS Report No. 589: Multiple Indicator Survey in India, Ministry of Statistics and Programme Implementation</p>
<p>&nbsp;</p>
<p>The table above reveals that 60.5 percent of urban houselholds and 29 percent of rural households have access to drinking water within the dwelling. The all-India average works out to 39.1 percent. 21.2 percent of urban and 30 percent of rural households&#39; primary source of drinking water is outside the dwelling, but within the premesis of residence, whereas 18.4 percent of urban and 41.1 percent of rural households have to step outside the premesis to get their water.&nbsp;&nbsp;</p>
<p>&nbsp;</p>
<p><strong>Donut Chart</strong></p>
<p><iframe class="flourish-embed-iframe" frameborder="0" scrolling="no" src="https://flo.uri.sh/visualisation/13626204/embed" style="width:100%;height:600px;" title="Interactive or visual content"></iframe></p>
<div style="margin-top:4px!important; text-align:right!important; width:100%!"><a class="flourish-credit" href="https://public.flourish.studio/visualisation/13626204/?utm_source=embed&amp;utm_campaign=visualisation/13626204" style="text-decoration:none!important" target="_top"><img alt="Made with Flourish" src="https://public.flourish.studio/resources/made_with_flourish.svg" style="border:none!important; height:16px!important; margin:0!important; width:105px!important" /> </a></div>
<p>&nbsp;</p>
<p>A household was considered to have&nbsp;access to a latrine if majority of the household members had the facility of using latrine irrespective of whether it was used by them or not. Information on access to latrine was collected in terms of six categories:&nbsp;(i) exclusive use of household, (ii) common use of households in the building, (iii) public/community use without payment, (iv) public/community use with payment, (v) others and (vi) no latrine. The chart above gives the average of urban and rural households. Breaking it down into the two categories, 80.8 percent of urban households had exclusive use of a latrine, while among rural households that number was just 68.8 percent. Significantly, 21.3 percent of rural households had no access to a latrine.&nbsp;</p>
<p>&nbsp;</p>
<p><strong>Chart 1: Percentage distribution of households by primary source of energy used for cooking</strong></p>
<p><iframe class="flourish-embed-iframe" frameborder="0" scrolling="no" src="https://flo.uri.sh/visualisation/13625833/embed" style="width:100%;height:600px;" title="Interactive or visual content"></iframe></p>
<div style="margin-top:4px!important; text-align:right!important; width:100%!"><a class="flourish-credit" href="https://public.flourish.studio/visualisation/13625833/?utm_source=embed&amp;utm_campaign=visualisation/13625833" style="text-decoration:none!important" target="_top"><img alt="Made with Flourish" src="https://public.flourish.studio/resources/made_with_flourish.svg" style="border:none!important; height:16px!important; margin:0!important; width:105px!important" /> </a></div>
<p>&nbsp;</p>
<p>&nbsp;</p>
<p><strong>Chart 2: Persons aged 18 and above who have an active mobile and SIM&nbsp;card in the&nbsp;three months prior to survey</strong></p>
<p><iframe class="flourish-embed-iframe" frameborder="0" scrolling="no" src="https://flo.uri.sh/visualisation/13626482/embed" style="width:100%;height:600px;" title="Interactive or visual content"></iframe></p>
<div style="margin-top:4px!important; text-align:right!important; width:100%!"><a class="flourish-credit" href="https://public.flourish.studio/visualisation/13626482/?utm_source=embed&amp;utm_campaign=visualisation/13626482" style="text-decoration:none!important" target="_top"><img alt="Made with Flourish" src="https://public.flourish.studio/resources/made_with_flourish.svg" style="border:none!important; height:16px!important; margin:0!important; width:105px!important" /> </a></div>
<p>&nbsp;</p>
<p>&nbsp;</p>
<p><strong>Table 2:&nbsp;Percentage of persons who have an account individually or jointly in any bank/ other financial institution/mobile money service provider</strong></p>
<p><img alt="" src="/upload/images/tablw%202%20persons%20with%20bank%20account.PNG" style="height:192px; width:936px" /></p>
<p>&nbsp;</p>
<p>The survey was initially planned for January-December, 2020, but due to Covid 19 pandemic, but the the data collection was extended to August 2021. For the central sample, the survey was spread over 14,266 first stage units (8,469 in rural areas and 5,797 in urban areas) covering 2,76,409 sample households (1,64,529 in rural areas and 1,11,880 in urban areas).&nbsp;</p>
<p>Please click here to access the<a href="/upload/files/MultipleIndicatorSurveyinIndiaf_0.pdf"> NSSO Report</a><br />
Photo Credit:&nbsp;Salahuddin, <a href="https://www.downtoearth.org.in/news/water/nearly-80-per-cent-indian-households-without-piped-water-connection-67928">Down to Earth</a></p>
<p>References<br />
NSS Report No. 589: Multiple Indicator Survey in India (78th round), Ministry of Statistics and Programme Implementation, March 2023</p>
',
'credit_writer' => 'National Sample Survey Organization, https://www.mospi.gov.in/sites/default/files/publication_reports/MultipleIndicatorSurveyinIndiaf_0.pdf',
'article_img' => '0.79217900_1574689453_dig015840.jpg',
'article_img_thumb' => '0.79217900_1574689453_dig015840.jpg',
'status' => (int) 1,
'show_on_home' => (int) 1,
'lang' => 'EN',
'category_id' => (int) 4,
'tag_keyword' => '',
'seo_url' => 'nsso-survey-only-39-1-of-all-households-have-drinking-water-within-dwelling-46-7-of-rural-households-use-firewood-for-cooking',
'meta_title' => '',
'meta_keywords' => '',
'meta_description' => '',
'noindex' => (int) 1,
'publish_date' => object(Cake\I18n\FrozenDate) {},
'most_visit_section_id' => null,
'article_big_img' => null,
'liveid' => null,
'created' => object(Cake\I18n\FrozenTime) {},
'modified' => object(Cake\I18n\FrozenTime) {},
'edate' => '',
'tags' => [
[maximum depth reached]
],
'category' => object(App\Model\Entity\Category) {},
'[new]' => false,
'[accessible]' => [
[maximum depth reached]
],
'[dirty]' => [[maximum depth reached]],
'[original]' => [[maximum depth reached]],
'[virtual]' => [[maximum depth reached]],
'[hasErrors]' => false,
'[errors]' => [[maximum depth reached]],
'[invalid]' => [[maximum depth reached]],
'[repository]' => 'Articles'
},
'articleid' => (int) 64981,
'metaTitle' => 'NEWS ALERTS | NSSO Survey: Only 39.1% of all Households have Drinking Water Within Dwelling, 46.7% of Rural Households use Firewood for Cooking',
'metaKeywords' => '78th Round,Drinking Water,Education,Financial Inclusion,Household Energy Use,Mass Media,Migration,Mobile Broadband,Multiple Indicator Survey,National Sample Survey,NSSO,Sanitation',
'metaDesc' => 'The National Sample Survey Organization&#39;s Multiple Indicator Survey - part of the 78th round - has revealed that only 39.1 percent of all Indian households have access to drinking water within the &nbsp;dwelling. When it come to cooking, 46.7% of...',
'disp' => '<p>The National Sample Survey Organization&#39;s <a href="https://www.mospi.gov.in/sites/default/files/publication_reports/MultipleIndicatorSurveyinIndiaf_0.pdf" title="https://www.mospi.gov.in/sites/default/files/publication_reports/MultipleIndicatorSurveyinIndiaf_0.pdf">Multiple Indicator Survey</a> - part of the 78th round - has revealed that only 39.1 percent of all Indian households have access to drinking water within the &nbsp;dwelling. When it come to cooking, 46.7% of rural households use firewood.&nbsp;</p><p>These are some of the findings of the survey whose purpose was to collect data about the indicators of Sustainable Development Goals. Data was collected for households and population; drinking water and sanitation; household energy use; education and ICT skills; mobile/broadband and mass media; financial inclusion and indebtedness; birth registration; purchase/construction of new house; migration.</p><p>The key findings are:</p><ul><li>&nbsp;About 95.0 percent of the persons in the rural areas and about 97.2 percent of the persons in the urban areas used &lsquo;improved source of drinking water&#39;.&nbsp;</li><li>&nbsp;About 56.3 percent of the persons in the rural areas and about 76.3 percent of the persons in the urban areas used improved source of drinking water located in the household premises which was sufficiently available throughout the year. &nbsp;</li><li>Among the persons who had reported access to latrine and hand washing facility, about 73.3 percent of the persons in the rural areas and about 81.4 percent of the persons in the urban areas had exclusive access to improved latrine and hand washing facilities with water and soap/detergent within the household premises.</li><li>About 49.8 percent of households in the rural areas and about 92.0 percent of households in the urban areas used clean fuel as primary source of energy for cooking. Here clean fuel refers to LPG, other natural gas, gobar gas, other biogas, electricity.</li><li>&nbsp;About 33.0 percent of persons in rural areas and about 39.4 percent of persons in urban areas of age 15-29 years were in formal and non-formal education and training for the 12 months preceding the survey.</li><li>About 67.8 percent of persons of age 18 years and above in rural areas and about 83.7 percent of persons of age 18 years and above in urban areas used mobile telephone with active sim card during the three months preceding the date of the survey.</li><li>Among the persons of age 18 years and above, about 89.3 percent of persons in rural areas and about 89.6 percent of persons in urban areas had an account individually or jointly in any bank/ other financial institution/ mobile money service provider.</li><li>Out of 1,00,000 persons of age 18 years and above, 16,223 persons in rural areas and 14,889 persons in urban areas were indebted to any institutional/non-institutional agency as on the date of survey.</li><li>About 92.5 percent of households in rural areas reported availability of all-weather roads within 2 km from the place of living.</li><li>About 11.2 percent of households in rural areas and about 7.2 percent of households in urban areas purchased/constructed any new house/flat for residential purpose after 31.03.2014. &nbsp;</li></ul><p>&nbsp;</p><p><strong>Table 1:&nbsp;Percentage distribution of households by distance to the principal source of drinking water</strong></p><p><img alt="" src="/upload/images/Table%201%20Principle%20source%20of%20drinking%20water.PNG" style="height:206px; width:877px" /></p><p>Source:&nbsp;NSS Report No. 589: Multiple Indicator Survey in India, Ministry of Statistics and Programme Implementation</p><p>&nbsp;</p><p>The table above reveals that 60.5 percent of urban houselholds and 29 percent of rural households have access to drinking water within the dwelling. The all-India average works out to 39.1 percent. 21.2 percent of urban and 30 percent of rural households&#39; primary source of drinking water is outside the dwelling, but within the premesis of residence, whereas 18.4 percent of urban and 41.1 percent of rural households have to step outside the premesis to get their water.&nbsp;&nbsp;</p><p>&nbsp;</p><p><strong>Donut Chart</strong></p><p><iframe class="flourish-embed-iframe" frameborder="0" scrolling="no" src="https://flo.uri.sh/visualisation/13626204/embed" style="width:100%;height:600px;" title="Interactive or visual content"></iframe></p><div style="margin-top:4px!important; text-align:right!important; width:100%!"><a href="https://public.flourish.studio/visualisation/13626204/?utm_source=embed&amp;utm_campaign=visualisation/13626204" style="text-decoration:none!important" target="_top" title="https://public.flourish.studio/visualisation/13626204/?utm_source=embed&amp;utm_campaign=visualisation/13626204" style="text-decoration:none!important" target="_top"> </a></div><p>&nbsp;</p><p>A household was considered to have&nbsp;access to a latrine if majority of the household members had the facility of using latrine irrespective of whether it was used by them or not. Information on access to latrine was collected in terms of six categories:&nbsp;(i) exclusive use of household, (ii) common use of households in the building, (iii) public/community use without payment, (iv) public/community use with payment, (v) others and (vi) no latrine. The chart above gives the average of urban and rural households. Breaking it down into the two categories, 80.8 percent of urban households had exclusive use of a latrine, while among rural households that number was just 68.8 percent. Significantly, 21.3 percent of rural households had no access to a latrine.&nbsp;</p><p>&nbsp;</p><p><strong>Chart 1: Percentage distribution of households by primary source of energy used for cooking</strong></p><p><iframe class="flourish-embed-iframe" frameborder="0" scrolling="no" src="https://flo.uri.sh/visualisation/13625833/embed" style="width:100%;height:600px;" title="Interactive or visual content"></iframe></p><div style="margin-top:4px!important; text-align:right!important; width:100%!"><a href="https://public.flourish.studio/visualisation/13625833/?utm_source=embed&amp;utm_campaign=visualisation/13625833" style="text-decoration:none!important" target="_top" title="https://public.flourish.studio/visualisation/13625833/?utm_source=embed&amp;utm_campaign=visualisation/13625833" style="text-decoration:none!important" target="_top"> </a></div><p>&nbsp;</p><p>&nbsp;</p><p><strong>Chart 2: Persons aged 18 and above who have an active mobile and SIM&nbsp;card in the&nbsp;three months prior to survey</strong></p><p><iframe class="flourish-embed-iframe" frameborder="0" scrolling="no" src="https://flo.uri.sh/visualisation/13626482/embed" style="width:100%;height:600px;" title="Interactive or visual content"></iframe></p><div style="margin-top:4px!important; text-align:right!important; width:100%!"><a href="https://public.flourish.studio/visualisation/13626482/?utm_source=embed&amp;utm_campaign=visualisation/13626482" style="text-decoration:none!important" target="_top" title="https://public.flourish.studio/visualisation/13626482/?utm_source=embed&amp;utm_campaign=visualisation/13626482" style="text-decoration:none!important" target="_top"> </a></div><p>&nbsp;</p><p>&nbsp;</p><p><strong>Table 2:&nbsp;Percentage of persons who have an account individually or jointly in any bank/ other financial institution/mobile money service provider</strong></p><p><img alt="" src="/upload/images/tablw%202%20persons%20with%20bank%20account.PNG" style="height:192px; width:936px" /></p><p>&nbsp;</p><p>The survey was initially planned for January-December, 2020, but due to Covid 19 pandemic, but the the data collection was extended to August 2021. For the central sample, the survey was spread over 14,266 first stage units (8,469 in rural areas and 5,797 in urban areas) covering 2,76,409 sample households (1,64,529 in rural areas and 1,11,880 in urban areas).&nbsp;</p><p>Please click here to access the<a href="/upload/files/MultipleIndicatorSurveyinIndiaf_0.pdf" title="/upload/files/MultipleIndicatorSurveyinIndiaf_0.pdf"> NSSO Report</a><br />Photo Credit:&nbsp;Salahuddin, <a href="https://www.downtoearth.org.in/news/water/nearly-80-per-cent-indian-households-without-piped-water-connection-67928" title="https://www.downtoearth.org.in/news/water/nearly-80-per-cent-indian-households-without-piped-water-connection-67928">Down to Earth</a></p><p>References<br />NSS Report No. 589: Multiple Indicator Survey in India (78th round), Ministry of Statistics and Programme Implementation, March 2023</p>',
'lang' => 'English',
'SITE_URL' => 'https://im4change.in/',
'site_title' => 'im4change',
'adminprix' => 'admin'
]
$article_current = object(App\Model\Entity\Article) {
'id' => (int) 64981,
'title' => 'NSSO Survey: Only 39.1% of all Households have Drinking Water Within Dwelling, 46.7% of Rural Households use Firewood for Cooking',
'subheading' => null,
'description' => '<p>The National Sample Survey Organization&#39;s <a href="https://www.mospi.gov.in/sites/default/files/publication_reports/MultipleIndicatorSurveyinIndiaf_0.pdf">Multiple Indicator Survey</a> - part of the 78th round - has revealed that only 39.1 percent of all Indian households have access to drinking water within the &nbsp;dwelling. When it come to cooking, 46.7% of rural households use firewood.&nbsp;</p>
<p>These are some of the findings of the survey whose purpose was to collect data about the indicators of Sustainable Development Goals. Data was collected for households and population; drinking water and sanitation; household energy use; education and ICT skills; mobile/broadband and mass media; financial inclusion and indebtedness; birth registration; purchase/construction of new house; migration.</p>
<p>The key findings are:</p>
<ul>
<li>&nbsp;About 95.0 percent of the persons in the rural areas and about 97.2 percent of the persons in the urban areas used &lsquo;improved source of drinking water&#39;.&nbsp;</li>
<li>&nbsp;About 56.3 percent of the persons in the rural areas and about 76.3 percent of the persons in the urban areas used improved source of drinking water located in the household premises which was sufficiently available throughout the year. &nbsp;</li>
<li>Among the persons who had reported access to latrine and hand washing facility, about 73.3 percent of the persons in the rural areas and about 81.4 percent of the persons in the urban areas had exclusive access to improved latrine and hand washing facilities with water and soap/detergent within the household premises.</li>
<li>About 49.8 percent of households in the rural areas and about 92.0 percent of households in the urban areas used clean fuel as primary source of energy for cooking. Here clean fuel refers to LPG, other natural gas, gobar gas, other biogas, electricity.</li>
<li>&nbsp;About 33.0 percent of persons in rural areas and about 39.4 percent of persons in urban areas of age 15-29 years were in formal and non-formal education and training for the 12 months preceding the survey.</li>
<li>About 67.8 percent of persons of age 18 years and above in rural areas and about 83.7 percent of persons of age 18 years and above in urban areas used mobile telephone with active sim card during the three months preceding the date of the survey.</li>
<li>Among the persons of age 18 years and above, about 89.3 percent of persons in rural areas and about 89.6 percent of persons in urban areas had an account individually or jointly in any bank/ other financial institution/ mobile money service provider.</li>
<li>Out of 1,00,000 persons of age 18 years and above, 16,223 persons in rural areas and 14,889 persons in urban areas were indebted to any institutional/non-institutional agency as on the date of survey.</li>
<li>About 92.5 percent of households in rural areas reported availability of all-weather roads within 2 km from the place of living.</li>
<li>About 11.2 percent of households in rural areas and about 7.2 percent of households in urban areas purchased/constructed any new house/flat for residential purpose after 31.03.2014. &nbsp;</li>
</ul>
<p>&nbsp;</p>
<p><strong>Table 1:&nbsp;Percentage distribution of households by distance to the principal source of drinking water</strong></p>
<p><img alt="" src="/upload/images/Table%201%20Principle%20source%20of%20drinking%20water.PNG" style="height:206px; width:877px" /></p>
<p>Source:&nbsp;NSS Report No. 589: Multiple Indicator Survey in India, Ministry of Statistics and Programme Implementation</p>
<p>&nbsp;</p>
<p>The table above reveals that 60.5 percent of urban houselholds and 29 percent of rural households have access to drinking water within the dwelling. The all-India average works out to 39.1 percent. 21.2 percent of urban and 30 percent of rural households&#39; primary source of drinking water is outside the dwelling, but within the premesis of residence, whereas 18.4 percent of urban and 41.1 percent of rural households have to step outside the premesis to get their water.&nbsp;&nbsp;</p>
<p>&nbsp;</p>
<p><strong>Donut Chart</strong></p>
<p><iframe class="flourish-embed-iframe" frameborder="0" scrolling="no" src="https://flo.uri.sh/visualisation/13626204/embed" style="width:100%;height:600px;" title="Interactive or visual content"></iframe></p>
<div style="margin-top:4px!important; text-align:right!important; width:100%!"><a class="flourish-credit" href="https://public.flourish.studio/visualisation/13626204/?utm_source=embed&amp;utm_campaign=visualisation/13626204" style="text-decoration:none!important" target="_top"><img alt="Made with Flourish" src="https://public.flourish.studio/resources/made_with_flourish.svg" style="border:none!important; height:16px!important; margin:0!important; width:105px!important" /> </a></div>
<p>&nbsp;</p>
<p>A household was considered to have&nbsp;access to a latrine if majority of the household members had the facility of using latrine irrespective of whether it was used by them or not. Information on access to latrine was collected in terms of six categories:&nbsp;(i) exclusive use of household, (ii) common use of households in the building, (iii) public/community use without payment, (iv) public/community use with payment, (v) others and (vi) no latrine. The chart above gives the average of urban and rural households. Breaking it down into the two categories, 80.8 percent of urban households had exclusive use of a latrine, while among rural households that number was just 68.8 percent. Significantly, 21.3 percent of rural households had no access to a latrine.&nbsp;</p>
<p>&nbsp;</p>
<p><strong>Chart 1: Percentage distribution of households by primary source of energy used for cooking</strong></p>
<p><iframe class="flourish-embed-iframe" frameborder="0" scrolling="no" src="https://flo.uri.sh/visualisation/13625833/embed" style="width:100%;height:600px;" title="Interactive or visual content"></iframe></p>
<div style="margin-top:4px!important; text-align:right!important; width:100%!"><a class="flourish-credit" href="https://public.flourish.studio/visualisation/13625833/?utm_source=embed&amp;utm_campaign=visualisation/13625833" style="text-decoration:none!important" target="_top"><img alt="Made with Flourish" src="https://public.flourish.studio/resources/made_with_flourish.svg" style="border:none!important; height:16px!important; margin:0!important; width:105px!important" /> </a></div>
<p>&nbsp;</p>
<p>&nbsp;</p>
<p><strong>Chart 2: Persons aged 18 and above who have an active mobile and SIM&nbsp;card in the&nbsp;three months prior to survey</strong></p>
<p><iframe class="flourish-embed-iframe" frameborder="0" scrolling="no" src="https://flo.uri.sh/visualisation/13626482/embed" style="width:100%;height:600px;" title="Interactive or visual content"></iframe></p>
<div style="margin-top:4px!important; text-align:right!important; width:100%!"><a class="flourish-credit" href="https://public.flourish.studio/visualisation/13626482/?utm_source=embed&amp;utm_campaign=visualisation/13626482" style="text-decoration:none!important" target="_top"><img alt="Made with Flourish" src="https://public.flourish.studio/resources/made_with_flourish.svg" style="border:none!important; height:16px!important; margin:0!important; width:105px!important" /> </a></div>
<p>&nbsp;</p>
<p>&nbsp;</p>
<p><strong>Table 2:&nbsp;Percentage of persons who have an account individually or jointly in any bank/ other financial institution/mobile money service provider</strong></p>
<p><img alt="" src="/upload/images/tablw%202%20persons%20with%20bank%20account.PNG" style="height:192px; width:936px" /></p>
<p>&nbsp;</p>
<p>The survey was initially planned for January-December, 2020, but due to Covid 19 pandemic, but the the data collection was extended to August 2021. For the central sample, the survey was spread over 14,266 first stage units (8,469 in rural areas and 5,797 in urban areas) covering 2,76,409 sample households (1,64,529 in rural areas and 1,11,880 in urban areas).&nbsp;</p>
<p>Please click here to access the<a href="/upload/files/MultipleIndicatorSurveyinIndiaf_0.pdf"> NSSO Report</a><br />
Photo Credit:&nbsp;Salahuddin, <a href="https://www.downtoearth.org.in/news/water/nearly-80-per-cent-indian-households-without-piped-water-connection-67928">Down to Earth</a></p>
<p>References<br />
NSS Report No. 589: Multiple Indicator Survey in India (78th round), Ministry of Statistics and Programme Implementation, March 2023</p>
',
'credit_writer' => 'National Sample Survey Organization, https://www.mospi.gov.in/sites/default/files/publication_reports/MultipleIndicatorSurveyinIndiaf_0.pdf',
'article_img' => '0.79217900_1574689453_dig015840.jpg',
'article_img_thumb' => '0.79217900_1574689453_dig015840.jpg',
'status' => (int) 1,
'show_on_home' => (int) 1,
'lang' => 'EN',
'category_id' => (int) 4,
'tag_keyword' => '',
'seo_url' => 'nsso-survey-only-39-1-of-all-households-have-drinking-water-within-dwelling-46-7-of-rural-households-use-firewood-for-cooking',
'meta_title' => '',
'meta_keywords' => '',
'meta_description' => '',
'noindex' => (int) 1,
'publish_date' => object(Cake\I18n\FrozenDate) {},
'most_visit_section_id' => null,
'article_big_img' => null,
'liveid' => null,
'created' => object(Cake\I18n\FrozenTime) {},
'modified' => object(Cake\I18n\FrozenTime) {},
'edate' => '',
'tags' => [
(int) 0 => object(Cake\ORM\Entity) {},
(int) 1 => object(Cake\ORM\Entity) {},
(int) 2 => object(Cake\ORM\Entity) {},
(int) 3 => object(Cake\ORM\Entity) {},
(int) 4 => object(Cake\ORM\Entity) {},
(int) 5 => object(Cake\ORM\Entity) {},
(int) 6 => object(Cake\ORM\Entity) {},
(int) 7 => object(Cake\ORM\Entity) {},
(int) 8 => object(Cake\ORM\Entity) {},
(int) 9 => object(Cake\ORM\Entity) {},
(int) 10 => object(Cake\ORM\Entity) {},
(int) 11 => object(Cake\ORM\Entity) {}
],
'category' => object(App\Model\Entity\Category) {},
'[new]' => false,
'[accessible]' => [
'*' => true,
'id' => false
],
'[dirty]' => [],
'[original]' => [],
'[virtual]' => [],
'[hasErrors]' => false,
'[errors]' => [],
'[invalid]' => [],
'[repository]' => 'Articles'
}
$articleid = (int) 64981
$metaTitle = 'NEWS ALERTS | NSSO Survey: Only 39.1% of all Households have Drinking Water Within Dwelling, 46.7% of Rural Households use Firewood for Cooking'
$metaKeywords = '78th Round,Drinking Water,Education,Financial Inclusion,Household Energy Use,Mass Media,Migration,Mobile Broadband,Multiple Indicator Survey,National Sample Survey,NSSO,Sanitation'
$metaDesc = 'The National Sample Survey Organization&#39;s Multiple Indicator Survey - part of the 78th round - has revealed that only 39.1 percent of all Indian households have access to drinking water within the &nbsp;dwelling. When it come to cooking, 46.7% of...'
$disp = '<p>The National Sample Survey Organization&#39;s <a href="https://www.mospi.gov.in/sites/default/files/publication_reports/MultipleIndicatorSurveyinIndiaf_0.pdf" title="https://www.mospi.gov.in/sites/default/files/publication_reports/MultipleIndicatorSurveyinIndiaf_0.pdf">Multiple Indicator Survey</a> - part of the 78th round - has revealed that only 39.1 percent of all Indian households have access to drinking water within the &nbsp;dwelling. When it come to cooking, 46.7% of rural households use firewood.&nbsp;</p><p>These are some of the findings of the survey whose purpose was to collect data about the indicators of Sustainable Development Goals. Data was collected for households and population; drinking water and sanitation; household energy use; education and ICT skills; mobile/broadband and mass media; financial inclusion and indebtedness; birth registration; purchase/construction of new house; migration.</p><p>The key findings are:</p><ul><li>&nbsp;About 95.0 percent of the persons in the rural areas and about 97.2 percent of the persons in the urban areas used &lsquo;improved source of drinking water&#39;.&nbsp;</li><li>&nbsp;About 56.3 percent of the persons in the rural areas and about 76.3 percent of the persons in the urban areas used improved source of drinking water located in the household premises which was sufficiently available throughout the year. &nbsp;</li><li>Among the persons who had reported access to latrine and hand washing facility, about 73.3 percent of the persons in the rural areas and about 81.4 percent of the persons in the urban areas had exclusive access to improved latrine and hand washing facilities with water and soap/detergent within the household premises.</li><li>About 49.8 percent of households in the rural areas and about 92.0 percent of households in the urban areas used clean fuel as primary source of energy for cooking. Here clean fuel refers to LPG, other natural gas, gobar gas, other biogas, electricity.</li><li>&nbsp;About 33.0 percent of persons in rural areas and about 39.4 percent of persons in urban areas of age 15-29 years were in formal and non-formal education and training for the 12 months preceding the survey.</li><li>About 67.8 percent of persons of age 18 years and above in rural areas and about 83.7 percent of persons of age 18 years and above in urban areas used mobile telephone with active sim card during the three months preceding the date of the survey.</li><li>Among the persons of age 18 years and above, about 89.3 percent of persons in rural areas and about 89.6 percent of persons in urban areas had an account individually or jointly in any bank/ other financial institution/ mobile money service provider.</li><li>Out of 1,00,000 persons of age 18 years and above, 16,223 persons in rural areas and 14,889 persons in urban areas were indebted to any institutional/non-institutional agency as on the date of survey.</li><li>About 92.5 percent of households in rural areas reported availability of all-weather roads within 2 km from the place of living.</li><li>About 11.2 percent of households in rural areas and about 7.2 percent of households in urban areas purchased/constructed any new house/flat for residential purpose after 31.03.2014. &nbsp;</li></ul><p>&nbsp;</p><p><strong>Table 1:&nbsp;Percentage distribution of households by distance to the principal source of drinking water</strong></p><p><img alt="" src="/upload/images/Table%201%20Principle%20source%20of%20drinking%20water.PNG" style="height:206px; width:877px" /></p><p>Source:&nbsp;NSS Report No. 589: Multiple Indicator Survey in India, Ministry of Statistics and Programme Implementation</p><p>&nbsp;</p><p>The table above reveals that 60.5 percent of urban houselholds and 29 percent of rural households have access to drinking water within the dwelling. The all-India average works out to 39.1 percent. 21.2 percent of urban and 30 percent of rural households&#39; primary source of drinking water is outside the dwelling, but within the premesis of residence, whereas 18.4 percent of urban and 41.1 percent of rural households have to step outside the premesis to get their water.&nbsp;&nbsp;</p><p>&nbsp;</p><p><strong>Donut Chart</strong></p><p><iframe class="flourish-embed-iframe" frameborder="0" scrolling="no" src="https://flo.uri.sh/visualisation/13626204/embed" style="width:100%;height:600px;" title="Interactive or visual content"></iframe></p><div style="margin-top:4px!important; text-align:right!important; width:100%!"><a href="https://public.flourish.studio/visualisation/13626204/?utm_source=embed&amp;utm_campaign=visualisation/13626204" style="text-decoration:none!important" target="_top" title="https://public.flourish.studio/visualisation/13626204/?utm_source=embed&amp;utm_campaign=visualisation/13626204" style="text-decoration:none!important" target="_top"> </a></div><p>&nbsp;</p><p>A household was considered to have&nbsp;access to a latrine if majority of the household members had the facility of using latrine irrespective of whether it was used by them or not. Information on access to latrine was collected in terms of six categories:&nbsp;(i) exclusive use of household, (ii) common use of households in the building, (iii) public/community use without payment, (iv) public/community use with payment, (v) others and (vi) no latrine. The chart above gives the average of urban and rural households. Breaking it down into the two categories, 80.8 percent of urban households had exclusive use of a latrine, while among rural households that number was just 68.8 percent. Significantly, 21.3 percent of rural households had no access to a latrine.&nbsp;</p><p>&nbsp;</p><p><strong>Chart 1: Percentage distribution of households by primary source of energy used for cooking</strong></p><p><iframe class="flourish-embed-iframe" frameborder="0" scrolling="no" src="https://flo.uri.sh/visualisation/13625833/embed" style="width:100%;height:600px;" title="Interactive or visual content"></iframe></p><div style="margin-top:4px!important; text-align:right!important; width:100%!"><a href="https://public.flourish.studio/visualisation/13625833/?utm_source=embed&amp;utm_campaign=visualisation/13625833" style="text-decoration:none!important" target="_top" title="https://public.flourish.studio/visualisation/13625833/?utm_source=embed&amp;utm_campaign=visualisation/13625833" style="text-decoration:none!important" target="_top"> </a></div><p>&nbsp;</p><p>&nbsp;</p><p><strong>Chart 2: Persons aged 18 and above who have an active mobile and SIM&nbsp;card in the&nbsp;three months prior to survey</strong></p><p><iframe class="flourish-embed-iframe" frameborder="0" scrolling="no" src="https://flo.uri.sh/visualisation/13626482/embed" style="width:100%;height:600px;" title="Interactive or visual content"></iframe></p><div style="margin-top:4px!important; text-align:right!important; width:100%!"><a href="https://public.flourish.studio/visualisation/13626482/?utm_source=embed&amp;utm_campaign=visualisation/13626482" style="text-decoration:none!important" target="_top" title="https://public.flourish.studio/visualisation/13626482/?utm_source=embed&amp;utm_campaign=visualisation/13626482" style="text-decoration:none!important" target="_top"> </a></div><p>&nbsp;</p><p>&nbsp;</p><p><strong>Table 2:&nbsp;Percentage of persons who have an account individually or jointly in any bank/ other financial institution/mobile money service provider</strong></p><p><img alt="" src="/upload/images/tablw%202%20persons%20with%20bank%20account.PNG" style="height:192px; width:936px" /></p><p>&nbsp;</p><p>The survey was initially planned for January-December, 2020, but due to Covid 19 pandemic, but the the data collection was extended to August 2021. For the central sample, the survey was spread over 14,266 first stage units (8,469 in rural areas and 5,797 in urban areas) covering 2,76,409 sample households (1,64,529 in rural areas and 1,11,880 in urban areas).&nbsp;</p><p>Please click here to access the<a href="/upload/files/MultipleIndicatorSurveyinIndiaf_0.pdf" title="/upload/files/MultipleIndicatorSurveyinIndiaf_0.pdf"> NSSO Report</a><br />Photo Credit:&nbsp;Salahuddin, <a href="https://www.downtoearth.org.in/news/water/nearly-80-per-cent-indian-households-without-piped-water-connection-67928" title="https://www.downtoearth.org.in/news/water/nearly-80-per-cent-indian-households-without-piped-water-connection-67928">Down to Earth</a></p><p>References<br />NSS Report No. 589: Multiple Indicator Survey in India (78th round), Ministry of Statistics and Programme Implementation, March 2023</p>'
$lang = 'English'
$SITE_URL = 'https://im4change.in/'
$site_title = 'im4change'
$adminprix = 'admin'</pre><pre class="stack-trace">include - APP/Template/Layout/printlayout.ctp, line 8
Cake\View\View::_evaluate() - CORE/src/View/View.php, line 1413
Cake\View\View::_render() - CORE/src/View/View.php, line 1374
Cake\View\View::renderLayout() - CORE/src/View/View.php, line 927
Cake\View\View::render() - CORE/src/View/View.php, line 885
Cake\Controller\Controller::render() - CORE/src/Controller/Controller.php, line 791
Cake\Http\ActionDispatcher::_invoke() - CORE/src/Http/ActionDispatcher.php, line 126
Cake\Http\ActionDispatcher::dispatch() - CORE/src/Http/ActionDispatcher.php, line 94
Cake\Http\BaseApplication::__invoke() - CORE/src/Http/BaseApplication.php, line 235
Cake\Http\Runner::__invoke() - CORE/src/Http/Runner.php, line 65
Cake\Routing\Middleware\RoutingMiddleware::__invoke() - CORE/src/Routing/Middleware/RoutingMiddleware.php, line 162
Cake\Http\Runner::__invoke() - CORE/src/Http/Runner.php, line 65
Cake\Routing\Middleware\AssetMiddleware::__invoke() - CORE/src/Routing/Middleware/AssetMiddleware.php, line 88
Cake\Http\Runner::__invoke() - CORE/src/Http/Runner.php, line 65
Cake\Error\Middleware\ErrorHandlerMiddleware::__invoke() - CORE/src/Error/Middleware/ErrorHandlerMiddleware.php, line 96
Cake\Http\Runner::__invoke() - CORE/src/Http/Runner.php, line 65
Cake\Http\Runner::run() - CORE/src/Http/Runner.php, line 51</pre></div></pre>news-alerts-57/nsso-survey-only-39-1-of-all-households-have-drinking-water-within-dwelling-46-7-of-rural-households-use-firewood-for-cooking.html"/>
<meta http-equiv="Content-Type" content="text/html; charset=utf-8"/>
<link href="https://im4change.in/css/control.css" rel="stylesheet" type="text/css"
media="all"/>
<title>NEWS ALERTS | NSSO Survey: Only 39.1% of all Households have Drinking Water Within Dwelling, 46.7% of Rural Households use Firewood for Cooking | Im4change.org</title>
<meta name="description" content="The National Sample Survey Organization's Multiple Indicator Survey - part of the 78th round - has revealed that only 39.1 percent of all Indian households have access to drinking water within the dwelling. When it come to cooking, 46.7% of..."/>
<script src="https://im4change.in/js/jquery-1.10.2.js"></script>
<script type="text/javascript" src="https://im4change.in/js/jquery-migrate.min.js"></script>
<script language="javascript" type="text/javascript">
$(document).ready(function () {
var img = $("img")[0]; // Get my img elem
var pic_real_width, pic_real_height;
$("<img/>") // Make in memory copy of image to avoid css issues
.attr("src", $(img).attr("src"))
.load(function () {
pic_real_width = this.width; // Note: $(this).width() will not
pic_real_height = this.height; // work for in memory images.
});
});
</script>
<style type="text/css">
@media screen {
div.divFooter {
display: block;
}
}
@media print {
.printbutton {
display: none !important;
}
}
</style>
</head>
<body>
<table cellpadding="0" cellspacing="0" border="0" width="98%" align="center">
<tr>
<td class="top_bg">
<div class="divFooter">
<img src="https://im4change.in/images/logo1.jpg" height="59" border="0"
alt="Resource centre on India's rural distress" style="padding-top:14px;"/>
</div>
</td>
</tr>
<tr>
<td id="topspace"> </td>
</tr>
<tr id="topspace">
<td> </td>
</tr>
<tr>
<td height="50" style="border-bottom:1px solid #000; padding-top:10px;" class="printbutton">
<form><input type="button" value=" Print this page "
onclick="window.print();return false;"/></form>
</td>
</tr>
<tr>
<td width="100%">
<h1 class="news_headlines" style="font-style:normal">
<strong>NSSO Survey: Only 39.1% of all Households have Drinking Water Within Dwelling, 46.7% of Rural Households use Firewood for Cooking</strong></h1>
</td>
</tr>
<tr>
<td width="100%" style="font-family:Arial, 'Segoe Script', 'Segoe UI', sans-serif, serif"><font size="3">
<p>The National Sample Survey Organization's <a href="https://www.mospi.gov.in/sites/default/files/publication_reports/MultipleIndicatorSurveyinIndiaf_0.pdf" title="https://www.mospi.gov.in/sites/default/files/publication_reports/MultipleIndicatorSurveyinIndiaf_0.pdf">Multiple Indicator Survey</a> - part of the 78th round - has revealed that only 39.1 percent of all Indian households have access to drinking water within the dwelling. When it come to cooking, 46.7% of rural households use firewood. </p><p>These are some of the findings of the survey whose purpose was to collect data about the indicators of Sustainable Development Goals. Data was collected for households and population; drinking water and sanitation; household energy use; education and ICT skills; mobile/broadband and mass media; financial inclusion and indebtedness; birth registration; purchase/construction of new house; migration.</p><p>The key findings are:</p><ul><li> About 95.0 percent of the persons in the rural areas and about 97.2 percent of the persons in the urban areas used ‘improved source of drinking water'. </li><li> About 56.3 percent of the persons in the rural areas and about 76.3 percent of the persons in the urban areas used improved source of drinking water located in the household premises which was sufficiently available throughout the year. </li><li>Among the persons who had reported access to latrine and hand washing facility, about 73.3 percent of the persons in the rural areas and about 81.4 percent of the persons in the urban areas had exclusive access to improved latrine and hand washing facilities with water and soap/detergent within the household premises.</li><li>About 49.8 percent of households in the rural areas and about 92.0 percent of households in the urban areas used clean fuel as primary source of energy for cooking. Here clean fuel refers to LPG, other natural gas, gobar gas, other biogas, electricity.</li><li> About 33.0 percent of persons in rural areas and about 39.4 percent of persons in urban areas of age 15-29 years were in formal and non-formal education and training for the 12 months preceding the survey.</li><li>About 67.8 percent of persons of age 18 years and above in rural areas and about 83.7 percent of persons of age 18 years and above in urban areas used mobile telephone with active sim card during the three months preceding the date of the survey.</li><li>Among the persons of age 18 years and above, about 89.3 percent of persons in rural areas and about 89.6 percent of persons in urban areas had an account individually or jointly in any bank/ other financial institution/ mobile money service provider.</li><li>Out of 1,00,000 persons of age 18 years and above, 16,223 persons in rural areas and 14,889 persons in urban areas were indebted to any institutional/non-institutional agency as on the date of survey.</li><li>About 92.5 percent of households in rural areas reported availability of all-weather roads within 2 km from the place of living.</li><li>About 11.2 percent of households in rural areas and about 7.2 percent of households in urban areas purchased/constructed any new house/flat for residential purpose after 31.03.2014. </li></ul><p> </p><p><strong>Table 1: Percentage distribution of households by distance to the principal source of drinking water</strong></p><p><img alt="" src="/upload/images/Table%201%20Principle%20source%20of%20drinking%20water.PNG" style="height:206px; width:877px" /></p><p>Source: NSS Report No. 589: Multiple Indicator Survey in India, Ministry of Statistics and Programme Implementation</p><p> </p><p>The table above reveals that 60.5 percent of urban houselholds and 29 percent of rural households have access to drinking water within the dwelling. The all-India average works out to 39.1 percent. 21.2 percent of urban and 30 percent of rural households' primary source of drinking water is outside the dwelling, but within the premesis of residence, whereas 18.4 percent of urban and 41.1 percent of rural households have to step outside the premesis to get their water. </p><p> </p><p><strong>Donut Chart</strong></p><p><iframe class="flourish-embed-iframe" frameborder="0" scrolling="no" src="https://flo.uri.sh/visualisation/13626204/embed" style="width:100%;height:600px;" title="Interactive or visual content"></iframe></p><div style="margin-top:4px!important; text-align:right!important; width:100%!"><a href="https://public.flourish.studio/visualisation/13626204/?utm_source=embed&utm_campaign=visualisation/13626204" style="text-decoration:none!important" target="_top" title="https://public.flourish.studio/visualisation/13626204/?utm_source=embed&utm_campaign=visualisation/13626204" style="text-decoration:none!important" target="_top"> </a></div><p> </p><p>A household was considered to have access to a latrine if majority of the household members had the facility of using latrine irrespective of whether it was used by them or not. Information on access to latrine was collected in terms of six categories: (i) exclusive use of household, (ii) common use of households in the building, (iii) public/community use without payment, (iv) public/community use with payment, (v) others and (vi) no latrine. The chart above gives the average of urban and rural households. Breaking it down into the two categories, 80.8 percent of urban households had exclusive use of a latrine, while among rural households that number was just 68.8 percent. Significantly, 21.3 percent of rural households had no access to a latrine. </p><p> </p><p><strong>Chart 1: Percentage distribution of households by primary source of energy used for cooking</strong></p><p><iframe class="flourish-embed-iframe" frameborder="0" scrolling="no" src="https://flo.uri.sh/visualisation/13625833/embed" style="width:100%;height:600px;" title="Interactive or visual content"></iframe></p><div style="margin-top:4px!important; text-align:right!important; width:100%!"><a href="https://public.flourish.studio/visualisation/13625833/?utm_source=embed&utm_campaign=visualisation/13625833" style="text-decoration:none!important" target="_top" title="https://public.flourish.studio/visualisation/13625833/?utm_source=embed&utm_campaign=visualisation/13625833" style="text-decoration:none!important" target="_top"> </a></div><p> </p><p> </p><p><strong>Chart 2: Persons aged 18 and above who have an active mobile and SIM card in the three months prior to survey</strong></p><p><iframe class="flourish-embed-iframe" frameborder="0" scrolling="no" src="https://flo.uri.sh/visualisation/13626482/embed" style="width:100%;height:600px;" title="Interactive or visual content"></iframe></p><div style="margin-top:4px!important; text-align:right!important; width:100%!"><a href="https://public.flourish.studio/visualisation/13626482/?utm_source=embed&utm_campaign=visualisation/13626482" style="text-decoration:none!important" target="_top" title="https://public.flourish.studio/visualisation/13626482/?utm_source=embed&utm_campaign=visualisation/13626482" style="text-decoration:none!important" target="_top"> </a></div><p> </p><p> </p><p><strong>Table 2: Percentage of persons who have an account individually or jointly in any bank/ other financial institution/mobile money service provider</strong></p><p><img alt="" src="/upload/images/tablw%202%20persons%20with%20bank%20account.PNG" style="height:192px; width:936px" /></p><p> </p><p>The survey was initially planned for January-December, 2020, but due to Covid 19 pandemic, but the the data collection was extended to August 2021. For the central sample, the survey was spread over 14,266 first stage units (8,469 in rural areas and 5,797 in urban areas) covering 2,76,409 sample households (1,64,529 in rural areas and 1,11,880 in urban areas). </p><p>Please click here to access the<a href="/upload/files/MultipleIndicatorSurveyinIndiaf_0.pdf" title="/upload/files/MultipleIndicatorSurveyinIndiaf_0.pdf"> NSSO Report</a><br />Photo Credit: Salahuddin, <a href="https://www.downtoearth.org.in/news/water/nearly-80-per-cent-indian-households-without-piped-water-connection-67928" title="https://www.downtoearth.org.in/news/water/nearly-80-per-cent-indian-households-without-piped-water-connection-67928">Down to Earth</a></p><p>References<br />NSS Report No. 589: Multiple Indicator Survey in India (78th round), Ministry of Statistics and Programme Implementation, March 2023</p> </font>
</td>
</tr>
<tr>
<td> </td>
</tr>
<tr>
<td height="50" style="border-top:1px solid #000; border-bottom:1px solid #000;padding-top:10px;">
<form><input type="button" value=" Print this page "
onclick="window.print();return false;"/></form>
</td>
</tr>
</table></body>
</html>'
}
$cookies = []
$values = [
(int) 0 => 'text/html; charset=UTF-8'
]
$name = 'Content-Type'
$first = true
$value = 'text/html; charset=UTF-8'
header - [internal], line ??
Cake\Http\ResponseEmitter::emitHeaders() - CORE/src/Http/ResponseEmitter.php, line 181
Cake\Http\ResponseEmitter::emit() - CORE/src/Http/ResponseEmitter.php, line 55
Cake\Http\Server::emit() - CORE/src/Http/Server.php, line 141
[main] - ROOT/webroot/index.php, line 39
Notice (8): Undefined variable: urlPrefix [APP/Template/Layout/printlayout.ctp, line 8]
$viewFile = '/home/brlfuser/public_html/src/Template/Layout/printlayout.ctp'
$dataForView = [
'article_current' => object(App\Model\Entity\Article) {
'id' => (int) 64981,
'title' => 'NSSO Survey: Only 39.1% of all Households have Drinking Water Within Dwelling, 46.7% of Rural Households use Firewood for Cooking',
'subheading' => null,
'description' => '<p>The National Sample Survey Organization's <a href="https://www.mospi.gov.in/sites/default/files/publication_reports/MultipleIndicatorSurveyinIndiaf_0.pdf">Multiple Indicator Survey</a> - part of the 78th round - has revealed that only 39.1 percent of all Indian households have access to drinking water within the dwelling. When it come to cooking, 46.7% of rural households use firewood. </p>
<p>These are some of the findings of the survey whose purpose was to collect data about the indicators of Sustainable Development Goals. Data was collected for households and population; drinking water and sanitation; household energy use; education and ICT skills; mobile/broadband and mass media; financial inclusion and indebtedness; birth registration; purchase/construction of new house; migration.</p>
<p>The key findings are:</p>
<ul>
<li> About 95.0 percent of the persons in the rural areas and about 97.2 percent of the persons in the urban areas used ‘improved source of drinking water'. </li>
<li> About 56.3 percent of the persons in the rural areas and about 76.3 percent of the persons in the urban areas used improved source of drinking water located in the household premises which was sufficiently available throughout the year. </li>
<li>Among the persons who had reported access to latrine and hand washing facility, about 73.3 percent of the persons in the rural areas and about 81.4 percent of the persons in the urban areas had exclusive access to improved latrine and hand washing facilities with water and soap/detergent within the household premises.</li>
<li>About 49.8 percent of households in the rural areas and about 92.0 percent of households in the urban areas used clean fuel as primary source of energy for cooking. Here clean fuel refers to LPG, other natural gas, gobar gas, other biogas, electricity.</li>
<li> About 33.0 percent of persons in rural areas and about 39.4 percent of persons in urban areas of age 15-29 years were in formal and non-formal education and training for the 12 months preceding the survey.</li>
<li>About 67.8 percent of persons of age 18 years and above in rural areas and about 83.7 percent of persons of age 18 years and above in urban areas used mobile telephone with active sim card during the three months preceding the date of the survey.</li>
<li>Among the persons of age 18 years and above, about 89.3 percent of persons in rural areas and about 89.6 percent of persons in urban areas had an account individually or jointly in any bank/ other financial institution/ mobile money service provider.</li>
<li>Out of 1,00,000 persons of age 18 years and above, 16,223 persons in rural areas and 14,889 persons in urban areas were indebted to any institutional/non-institutional agency as on the date of survey.</li>
<li>About 92.5 percent of households in rural areas reported availability of all-weather roads within 2 km from the place of living.</li>
<li>About 11.2 percent of households in rural areas and about 7.2 percent of households in urban areas purchased/constructed any new house/flat for residential purpose after 31.03.2014. </li>
</ul>
<p> </p>
<p><strong>Table 1: Percentage distribution of households by distance to the principal source of drinking water</strong></p>
<p><img alt="" src="/upload/images/Table%201%20Principle%20source%20of%20drinking%20water.PNG" style="height:206px; width:877px" /></p>
<p>Source: NSS Report No. 589: Multiple Indicator Survey in India, Ministry of Statistics and Programme Implementation</p>
<p> </p>
<p>The table above reveals that 60.5 percent of urban houselholds and 29 percent of rural households have access to drinking water within the dwelling. The all-India average works out to 39.1 percent. 21.2 percent of urban and 30 percent of rural households' primary source of drinking water is outside the dwelling, but within the premesis of residence, whereas 18.4 percent of urban and 41.1 percent of rural households have to step outside the premesis to get their water. </p>
<p> </p>
<p><strong>Donut Chart</strong></p>
<p><iframe class="flourish-embed-iframe" frameborder="0" scrolling="no" src="https://flo.uri.sh/visualisation/13626204/embed" style="width:100%;height:600px;" title="Interactive or visual content"></iframe></p>
<div style="margin-top:4px!important; text-align:right!important; width:100%!"><a class="flourish-credit" href="https://public.flourish.studio/visualisation/13626204/?utm_source=embed&utm_campaign=visualisation/13626204" style="text-decoration:none!important" target="_top"><img alt="Made with Flourish" src="https://public.flourish.studio/resources/made_with_flourish.svg" style="border:none!important; height:16px!important; margin:0!important; width:105px!important" /> </a></div>
<p> </p>
<p>A household was considered to have access to a latrine if majority of the household members had the facility of using latrine irrespective of whether it was used by them or not. Information on access to latrine was collected in terms of six categories: (i) exclusive use of household, (ii) common use of households in the building, (iii) public/community use without payment, (iv) public/community use with payment, (v) others and (vi) no latrine. The chart above gives the average of urban and rural households. Breaking it down into the two categories, 80.8 percent of urban households had exclusive use of a latrine, while among rural households that number was just 68.8 percent. Significantly, 21.3 percent of rural households had no access to a latrine. </p>
<p> </p>
<p><strong>Chart 1: Percentage distribution of households by primary source of energy used for cooking</strong></p>
<p><iframe class="flourish-embed-iframe" frameborder="0" scrolling="no" src="https://flo.uri.sh/visualisation/13625833/embed" style="width:100%;height:600px;" title="Interactive or visual content"></iframe></p>
<div style="margin-top:4px!important; text-align:right!important; width:100%!"><a class="flourish-credit" href="https://public.flourish.studio/visualisation/13625833/?utm_source=embed&utm_campaign=visualisation/13625833" style="text-decoration:none!important" target="_top"><img alt="Made with Flourish" src="https://public.flourish.studio/resources/made_with_flourish.svg" style="border:none!important; height:16px!important; margin:0!important; width:105px!important" /> </a></div>
<p> </p>
<p> </p>
<p><strong>Chart 2: Persons aged 18 and above who have an active mobile and SIM card in the three months prior to survey</strong></p>
<p><iframe class="flourish-embed-iframe" frameborder="0" scrolling="no" src="https://flo.uri.sh/visualisation/13626482/embed" style="width:100%;height:600px;" title="Interactive or visual content"></iframe></p>
<div style="margin-top:4px!important; text-align:right!important; width:100%!"><a class="flourish-credit" href="https://public.flourish.studio/visualisation/13626482/?utm_source=embed&utm_campaign=visualisation/13626482" style="text-decoration:none!important" target="_top"><img alt="Made with Flourish" src="https://public.flourish.studio/resources/made_with_flourish.svg" style="border:none!important; height:16px!important; margin:0!important; width:105px!important" /> </a></div>
<p> </p>
<p> </p>
<p><strong>Table 2: Percentage of persons who have an account individually or jointly in any bank/ other financial institution/mobile money service provider</strong></p>
<p><img alt="" src="/upload/images/tablw%202%20persons%20with%20bank%20account.PNG" style="height:192px; width:936px" /></p>
<p> </p>
<p>The survey was initially planned for January-December, 2020, but due to Covid 19 pandemic, but the the data collection was extended to August 2021. For the central sample, the survey was spread over 14,266 first stage units (8,469 in rural areas and 5,797 in urban areas) covering 2,76,409 sample households (1,64,529 in rural areas and 1,11,880 in urban areas). </p>
<p>Please click here to access the<a href="/upload/files/MultipleIndicatorSurveyinIndiaf_0.pdf"> NSSO Report</a><br />
Photo Credit: Salahuddin, <a href="https://www.downtoearth.org.in/news/water/nearly-80-per-cent-indian-households-without-piped-water-connection-67928">Down to Earth</a></p>
<p>References<br />
NSS Report No. 589: Multiple Indicator Survey in India (78th round), Ministry of Statistics and Programme Implementation, March 2023</p>
',
'credit_writer' => 'National Sample Survey Organization, https://www.mospi.gov.in/sites/default/files/publication_reports/MultipleIndicatorSurveyinIndiaf_0.pdf',
'article_img' => '0.79217900_1574689453_dig015840.jpg',
'article_img_thumb' => '0.79217900_1574689453_dig015840.jpg',
'status' => (int) 1,
'show_on_home' => (int) 1,
'lang' => 'EN',
'category_id' => (int) 4,
'tag_keyword' => '',
'seo_url' => 'nsso-survey-only-39-1-of-all-households-have-drinking-water-within-dwelling-46-7-of-rural-households-use-firewood-for-cooking',
'meta_title' => '',
'meta_keywords' => '',
'meta_description' => '',
'noindex' => (int) 1,
'publish_date' => object(Cake\I18n\FrozenDate) {},
'most_visit_section_id' => null,
'article_big_img' => null,
'liveid' => null,
'created' => object(Cake\I18n\FrozenTime) {},
'modified' => object(Cake\I18n\FrozenTime) {},
'edate' => '',
'tags' => [
[maximum depth reached]
],
'category' => object(App\Model\Entity\Category) {},
'[new]' => false,
'[accessible]' => [
[maximum depth reached]
],
'[dirty]' => [[maximum depth reached]],
'[original]' => [[maximum depth reached]],
'[virtual]' => [[maximum depth reached]],
'[hasErrors]' => false,
'[errors]' => [[maximum depth reached]],
'[invalid]' => [[maximum depth reached]],
'[repository]' => 'Articles'
},
'articleid' => (int) 64981,
'metaTitle' => 'NEWS ALERTS | NSSO Survey: Only 39.1% of all Households have Drinking Water Within Dwelling, 46.7% of Rural Households use Firewood for Cooking',
'metaKeywords' => '78th Round,Drinking Water,Education,Financial Inclusion,Household Energy Use,Mass Media,Migration,Mobile Broadband,Multiple Indicator Survey,National Sample Survey,NSSO,Sanitation',
'metaDesc' => 'The National Sample Survey Organization's Multiple Indicator Survey - part of the 78th round - has revealed that only 39.1 percent of all Indian households have access to drinking water within the dwelling. When it come to cooking, 46.7% of...',
'disp' => '<p>The National Sample Survey Organization's <a href="https://www.mospi.gov.in/sites/default/files/publication_reports/MultipleIndicatorSurveyinIndiaf_0.pdf" title="https://www.mospi.gov.in/sites/default/files/publication_reports/MultipleIndicatorSurveyinIndiaf_0.pdf">Multiple Indicator Survey</a> - part of the 78th round - has revealed that only 39.1 percent of all Indian households have access to drinking water within the dwelling. When it come to cooking, 46.7% of rural households use firewood. </p><p>These are some of the findings of the survey whose purpose was to collect data about the indicators of Sustainable Development Goals. Data was collected for households and population; drinking water and sanitation; household energy use; education and ICT skills; mobile/broadband and mass media; financial inclusion and indebtedness; birth registration; purchase/construction of new house; migration.</p><p>The key findings are:</p><ul><li> About 95.0 percent of the persons in the rural areas and about 97.2 percent of the persons in the urban areas used ‘improved source of drinking water'. </li><li> About 56.3 percent of the persons in the rural areas and about 76.3 percent of the persons in the urban areas used improved source of drinking water located in the household premises which was sufficiently available throughout the year. </li><li>Among the persons who had reported access to latrine and hand washing facility, about 73.3 percent of the persons in the rural areas and about 81.4 percent of the persons in the urban areas had exclusive access to improved latrine and hand washing facilities with water and soap/detergent within the household premises.</li><li>About 49.8 percent of households in the rural areas and about 92.0 percent of households in the urban areas used clean fuel as primary source of energy for cooking. Here clean fuel refers to LPG, other natural gas, gobar gas, other biogas, electricity.</li><li> About 33.0 percent of persons in rural areas and about 39.4 percent of persons in urban areas of age 15-29 years were in formal and non-formal education and training for the 12 months preceding the survey.</li><li>About 67.8 percent of persons of age 18 years and above in rural areas and about 83.7 percent of persons of age 18 years and above in urban areas used mobile telephone with active sim card during the three months preceding the date of the survey.</li><li>Among the persons of age 18 years and above, about 89.3 percent of persons in rural areas and about 89.6 percent of persons in urban areas had an account individually or jointly in any bank/ other financial institution/ mobile money service provider.</li><li>Out of 1,00,000 persons of age 18 years and above, 16,223 persons in rural areas and 14,889 persons in urban areas were indebted to any institutional/non-institutional agency as on the date of survey.</li><li>About 92.5 percent of households in rural areas reported availability of all-weather roads within 2 km from the place of living.</li><li>About 11.2 percent of households in rural areas and about 7.2 percent of households in urban areas purchased/constructed any new house/flat for residential purpose after 31.03.2014. </li></ul><p> </p><p><strong>Table 1: Percentage distribution of households by distance to the principal source of drinking water</strong></p><p><img alt="" src="/upload/images/Table%201%20Principle%20source%20of%20drinking%20water.PNG" style="height:206px; width:877px" /></p><p>Source: NSS Report No. 589: Multiple Indicator Survey in India, Ministry of Statistics and Programme Implementation</p><p> </p><p>The table above reveals that 60.5 percent of urban houselholds and 29 percent of rural households have access to drinking water within the dwelling. The all-India average works out to 39.1 percent. 21.2 percent of urban and 30 percent of rural households' primary source of drinking water is outside the dwelling, but within the premesis of residence, whereas 18.4 percent of urban and 41.1 percent of rural households have to step outside the premesis to get their water. </p><p> </p><p><strong>Donut Chart</strong></p><p><iframe class="flourish-embed-iframe" frameborder="0" scrolling="no" src="https://flo.uri.sh/visualisation/13626204/embed" style="width:100%;height:600px;" title="Interactive or visual content"></iframe></p><div style="margin-top:4px!important; text-align:right!important; width:100%!"><a href="https://public.flourish.studio/visualisation/13626204/?utm_source=embed&utm_campaign=visualisation/13626204" style="text-decoration:none!important" target="_top" title="https://public.flourish.studio/visualisation/13626204/?utm_source=embed&utm_campaign=visualisation/13626204" style="text-decoration:none!important" target="_top"> </a></div><p> </p><p>A household was considered to have access to a latrine if majority of the household members had the facility of using latrine irrespective of whether it was used by them or not. Information on access to latrine was collected in terms of six categories: (i) exclusive use of household, (ii) common use of households in the building, (iii) public/community use without payment, (iv) public/community use with payment, (v) others and (vi) no latrine. The chart above gives the average of urban and rural households. Breaking it down into the two categories, 80.8 percent of urban households had exclusive use of a latrine, while among rural households that number was just 68.8 percent. Significantly, 21.3 percent of rural households had no access to a latrine. </p><p> </p><p><strong>Chart 1: Percentage distribution of households by primary source of energy used for cooking</strong></p><p><iframe class="flourish-embed-iframe" frameborder="0" scrolling="no" src="https://flo.uri.sh/visualisation/13625833/embed" style="width:100%;height:600px;" title="Interactive or visual content"></iframe></p><div style="margin-top:4px!important; text-align:right!important; width:100%!"><a href="https://public.flourish.studio/visualisation/13625833/?utm_source=embed&utm_campaign=visualisation/13625833" style="text-decoration:none!important" target="_top" title="https://public.flourish.studio/visualisation/13625833/?utm_source=embed&utm_campaign=visualisation/13625833" style="text-decoration:none!important" target="_top"> </a></div><p> </p><p> </p><p><strong>Chart 2: Persons aged 18 and above who have an active mobile and SIM card in the three months prior to survey</strong></p><p><iframe class="flourish-embed-iframe" frameborder="0" scrolling="no" src="https://flo.uri.sh/visualisation/13626482/embed" style="width:100%;height:600px;" title="Interactive or visual content"></iframe></p><div style="margin-top:4px!important; text-align:right!important; width:100%!"><a href="https://public.flourish.studio/visualisation/13626482/?utm_source=embed&utm_campaign=visualisation/13626482" style="text-decoration:none!important" target="_top" title="https://public.flourish.studio/visualisation/13626482/?utm_source=embed&utm_campaign=visualisation/13626482" style="text-decoration:none!important" target="_top"> </a></div><p> </p><p> </p><p><strong>Table 2: Percentage of persons who have an account individually or jointly in any bank/ other financial institution/mobile money service provider</strong></p><p><img alt="" src="/upload/images/tablw%202%20persons%20with%20bank%20account.PNG" style="height:192px; width:936px" /></p><p> </p><p>The survey was initially planned for January-December, 2020, but due to Covid 19 pandemic, but the the data collection was extended to August 2021. For the central sample, the survey was spread over 14,266 first stage units (8,469 in rural areas and 5,797 in urban areas) covering 2,76,409 sample households (1,64,529 in rural areas and 1,11,880 in urban areas). </p><p>Please click here to access the<a href="/upload/files/MultipleIndicatorSurveyinIndiaf_0.pdf" title="/upload/files/MultipleIndicatorSurveyinIndiaf_0.pdf"> NSSO Report</a><br />Photo Credit: Salahuddin, <a href="https://www.downtoearth.org.in/news/water/nearly-80-per-cent-indian-households-without-piped-water-connection-67928" title="https://www.downtoearth.org.in/news/water/nearly-80-per-cent-indian-households-without-piped-water-connection-67928">Down to Earth</a></p><p>References<br />NSS Report No. 589: Multiple Indicator Survey in India (78th round), Ministry of Statistics and Programme Implementation, March 2023</p>',
'lang' => 'English',
'SITE_URL' => 'https://im4change.in/',
'site_title' => 'im4change',
'adminprix' => 'admin'
]
$article_current = object(App\Model\Entity\Article) {
'id' => (int) 64981,
'title' => 'NSSO Survey: Only 39.1% of all Households have Drinking Water Within Dwelling, 46.7% of Rural Households use Firewood for Cooking',
'subheading' => null,
'description' => '<p>The National Sample Survey Organization's <a href="https://www.mospi.gov.in/sites/default/files/publication_reports/MultipleIndicatorSurveyinIndiaf_0.pdf">Multiple Indicator Survey</a> - part of the 78th round - has revealed that only 39.1 percent of all Indian households have access to drinking water within the dwelling. When it come to cooking, 46.7% of rural households use firewood. </p>
<p>These are some of the findings of the survey whose purpose was to collect data about the indicators of Sustainable Development Goals. Data was collected for households and population; drinking water and sanitation; household energy use; education and ICT skills; mobile/broadband and mass media; financial inclusion and indebtedness; birth registration; purchase/construction of new house; migration.</p>
<p>The key findings are:</p>
<ul>
<li> About 95.0 percent of the persons in the rural areas and about 97.2 percent of the persons in the urban areas used ‘improved source of drinking water'. </li>
<li> About 56.3 percent of the persons in the rural areas and about 76.3 percent of the persons in the urban areas used improved source of drinking water located in the household premises which was sufficiently available throughout the year. </li>
<li>Among the persons who had reported access to latrine and hand washing facility, about 73.3 percent of the persons in the rural areas and about 81.4 percent of the persons in the urban areas had exclusive access to improved latrine and hand washing facilities with water and soap/detergent within the household premises.</li>
<li>About 49.8 percent of households in the rural areas and about 92.0 percent of households in the urban areas used clean fuel as primary source of energy for cooking. Here clean fuel refers to LPG, other natural gas, gobar gas, other biogas, electricity.</li>
<li> About 33.0 percent of persons in rural areas and about 39.4 percent of persons in urban areas of age 15-29 years were in formal and non-formal education and training for the 12 months preceding the survey.</li>
<li>About 67.8 percent of persons of age 18 years and above in rural areas and about 83.7 percent of persons of age 18 years and above in urban areas used mobile telephone with active sim card during the three months preceding the date of the survey.</li>
<li>Among the persons of age 18 years and above, about 89.3 percent of persons in rural areas and about 89.6 percent of persons in urban areas had an account individually or jointly in any bank/ other financial institution/ mobile money service provider.</li>
<li>Out of 1,00,000 persons of age 18 years and above, 16,223 persons in rural areas and 14,889 persons in urban areas were indebted to any institutional/non-institutional agency as on the date of survey.</li>
<li>About 92.5 percent of households in rural areas reported availability of all-weather roads within 2 km from the place of living.</li>
<li>About 11.2 percent of households in rural areas and about 7.2 percent of households in urban areas purchased/constructed any new house/flat for residential purpose after 31.03.2014. </li>
</ul>
<p> </p>
<p><strong>Table 1: Percentage distribution of households by distance to the principal source of drinking water</strong></p>
<p><img alt="" src="/upload/images/Table%201%20Principle%20source%20of%20drinking%20water.PNG" style="height:206px; width:877px" /></p>
<p>Source: NSS Report No. 589: Multiple Indicator Survey in India, Ministry of Statistics and Programme Implementation</p>
<p> </p>
<p>The table above reveals that 60.5 percent of urban houselholds and 29 percent of rural households have access to drinking water within the dwelling. The all-India average works out to 39.1 percent. 21.2 percent of urban and 30 percent of rural households' primary source of drinking water is outside the dwelling, but within the premesis of residence, whereas 18.4 percent of urban and 41.1 percent of rural households have to step outside the premesis to get their water. </p>
<p> </p>
<p><strong>Donut Chart</strong></p>
<p><iframe class="flourish-embed-iframe" frameborder="0" scrolling="no" src="https://flo.uri.sh/visualisation/13626204/embed" style="width:100%;height:600px;" title="Interactive or visual content"></iframe></p>
<div style="margin-top:4px!important; text-align:right!important; width:100%!"><a class="flourish-credit" href="https://public.flourish.studio/visualisation/13626204/?utm_source=embed&utm_campaign=visualisation/13626204" style="text-decoration:none!important" target="_top"><img alt="Made with Flourish" src="https://public.flourish.studio/resources/made_with_flourish.svg" style="border:none!important; height:16px!important; margin:0!important; width:105px!important" /> </a></div>
<p> </p>
<p>A household was considered to have access to a latrine if majority of the household members had the facility of using latrine irrespective of whether it was used by them or not. Information on access to latrine was collected in terms of six categories: (i) exclusive use of household, (ii) common use of households in the building, (iii) public/community use without payment, (iv) public/community use with payment, (v) others and (vi) no latrine. The chart above gives the average of urban and rural households. Breaking it down into the two categories, 80.8 percent of urban households had exclusive use of a latrine, while among rural households that number was just 68.8 percent. Significantly, 21.3 percent of rural households had no access to a latrine. </p>
<p> </p>
<p><strong>Chart 1: Percentage distribution of households by primary source of energy used for cooking</strong></p>
<p><iframe class="flourish-embed-iframe" frameborder="0" scrolling="no" src="https://flo.uri.sh/visualisation/13625833/embed" style="width:100%;height:600px;" title="Interactive or visual content"></iframe></p>
<div style="margin-top:4px!important; text-align:right!important; width:100%!"><a class="flourish-credit" href="https://public.flourish.studio/visualisation/13625833/?utm_source=embed&utm_campaign=visualisation/13625833" style="text-decoration:none!important" target="_top"><img alt="Made with Flourish" src="https://public.flourish.studio/resources/made_with_flourish.svg" style="border:none!important; height:16px!important; margin:0!important; width:105px!important" /> </a></div>
<p> </p>
<p> </p>
<p><strong>Chart 2: Persons aged 18 and above who have an active mobile and SIM card in the three months prior to survey</strong></p>
<p><iframe class="flourish-embed-iframe" frameborder="0" scrolling="no" src="https://flo.uri.sh/visualisation/13626482/embed" style="width:100%;height:600px;" title="Interactive or visual content"></iframe></p>
<div style="margin-top:4px!important; text-align:right!important; width:100%!"><a class="flourish-credit" href="https://public.flourish.studio/visualisation/13626482/?utm_source=embed&utm_campaign=visualisation/13626482" style="text-decoration:none!important" target="_top"><img alt="Made with Flourish" src="https://public.flourish.studio/resources/made_with_flourish.svg" style="border:none!important; height:16px!important; margin:0!important; width:105px!important" /> </a></div>
<p> </p>
<p> </p>
<p><strong>Table 2: Percentage of persons who have an account individually or jointly in any bank/ other financial institution/mobile money service provider</strong></p>
<p><img alt="" src="/upload/images/tablw%202%20persons%20with%20bank%20account.PNG" style="height:192px; width:936px" /></p>
<p> </p>
<p>The survey was initially planned for January-December, 2020, but due to Covid 19 pandemic, but the the data collection was extended to August 2021. For the central sample, the survey was spread over 14,266 first stage units (8,469 in rural areas and 5,797 in urban areas) covering 2,76,409 sample households (1,64,529 in rural areas and 1,11,880 in urban areas). </p>
<p>Please click here to access the<a href="/upload/files/MultipleIndicatorSurveyinIndiaf_0.pdf"> NSSO Report</a><br />
Photo Credit: Salahuddin, <a href="https://www.downtoearth.org.in/news/water/nearly-80-per-cent-indian-households-without-piped-water-connection-67928">Down to Earth</a></p>
<p>References<br />
NSS Report No. 589: Multiple Indicator Survey in India (78th round), Ministry of Statistics and Programme Implementation, March 2023</p>
',
'credit_writer' => 'National Sample Survey Organization, https://www.mospi.gov.in/sites/default/files/publication_reports/MultipleIndicatorSurveyinIndiaf_0.pdf',
'article_img' => '0.79217900_1574689453_dig015840.jpg',
'article_img_thumb' => '0.79217900_1574689453_dig015840.jpg',
'status' => (int) 1,
'show_on_home' => (int) 1,
'lang' => 'EN',
'category_id' => (int) 4,
'tag_keyword' => '',
'seo_url' => 'nsso-survey-only-39-1-of-all-households-have-drinking-water-within-dwelling-46-7-of-rural-households-use-firewood-for-cooking',
'meta_title' => '',
'meta_keywords' => '',
'meta_description' => '',
'noindex' => (int) 1,
'publish_date' => object(Cake\I18n\FrozenDate) {},
'most_visit_section_id' => null,
'article_big_img' => null,
'liveid' => null,
'created' => object(Cake\I18n\FrozenTime) {},
'modified' => object(Cake\I18n\FrozenTime) {},
'edate' => '',
'tags' => [
(int) 0 => object(Cake\ORM\Entity) {},
(int) 1 => object(Cake\ORM\Entity) {},
(int) 2 => object(Cake\ORM\Entity) {},
(int) 3 => object(Cake\ORM\Entity) {},
(int) 4 => object(Cake\ORM\Entity) {},
(int) 5 => object(Cake\ORM\Entity) {},
(int) 6 => object(Cake\ORM\Entity) {},
(int) 7 => object(Cake\ORM\Entity) {},
(int) 8 => object(Cake\ORM\Entity) {},
(int) 9 => object(Cake\ORM\Entity) {},
(int) 10 => object(Cake\ORM\Entity) {},
(int) 11 => object(Cake\ORM\Entity) {}
],
'category' => object(App\Model\Entity\Category) {},
'[new]' => false,
'[accessible]' => [
'*' => true,
'id' => false
],
'[dirty]' => [],
'[original]' => [],
'[virtual]' => [],
'[hasErrors]' => false,
'[errors]' => [],
'[invalid]' => [],
'[repository]' => 'Articles'
}
$articleid = (int) 64981
$metaTitle = 'NEWS ALERTS | NSSO Survey: Only 39.1% of all Households have Drinking Water Within Dwelling, 46.7% of Rural Households use Firewood for Cooking'
$metaKeywords = '78th Round,Drinking Water,Education,Financial Inclusion,Household Energy Use,Mass Media,Migration,Mobile Broadband,Multiple Indicator Survey,National Sample Survey,NSSO,Sanitation'
$metaDesc = 'The National Sample Survey Organization's Multiple Indicator Survey - part of the 78th round - has revealed that only 39.1 percent of all Indian households have access to drinking water within the dwelling. When it come to cooking, 46.7% of...'
$disp = '<p>The National Sample Survey Organization's <a href="https://www.mospi.gov.in/sites/default/files/publication_reports/MultipleIndicatorSurveyinIndiaf_0.pdf" title="https://www.mospi.gov.in/sites/default/files/publication_reports/MultipleIndicatorSurveyinIndiaf_0.pdf">Multiple Indicator Survey</a> - part of the 78th round - has revealed that only 39.1 percent of all Indian households have access to drinking water within the dwelling. When it come to cooking, 46.7% of rural households use firewood. </p><p>These are some of the findings of the survey whose purpose was to collect data about the indicators of Sustainable Development Goals. Data was collected for households and population; drinking water and sanitation; household energy use; education and ICT skills; mobile/broadband and mass media; financial inclusion and indebtedness; birth registration; purchase/construction of new house; migration.</p><p>The key findings are:</p><ul><li> About 95.0 percent of the persons in the rural areas and about 97.2 percent of the persons in the urban areas used ‘improved source of drinking water'. </li><li> About 56.3 percent of the persons in the rural areas and about 76.3 percent of the persons in the urban areas used improved source of drinking water located in the household premises which was sufficiently available throughout the year. </li><li>Among the persons who had reported access to latrine and hand washing facility, about 73.3 percent of the persons in the rural areas and about 81.4 percent of the persons in the urban areas had exclusive access to improved latrine and hand washing facilities with water and soap/detergent within the household premises.</li><li>About 49.8 percent of households in the rural areas and about 92.0 percent of households in the urban areas used clean fuel as primary source of energy for cooking. Here clean fuel refers to LPG, other natural gas, gobar gas, other biogas, electricity.</li><li> About 33.0 percent of persons in rural areas and about 39.4 percent of persons in urban areas of age 15-29 years were in formal and non-formal education and training for the 12 months preceding the survey.</li><li>About 67.8 percent of persons of age 18 years and above in rural areas and about 83.7 percent of persons of age 18 years and above in urban areas used mobile telephone with active sim card during the three months preceding the date of the survey.</li><li>Among the persons of age 18 years and above, about 89.3 percent of persons in rural areas and about 89.6 percent of persons in urban areas had an account individually or jointly in any bank/ other financial institution/ mobile money service provider.</li><li>Out of 1,00,000 persons of age 18 years and above, 16,223 persons in rural areas and 14,889 persons in urban areas were indebted to any institutional/non-institutional agency as on the date of survey.</li><li>About 92.5 percent of households in rural areas reported availability of all-weather roads within 2 km from the place of living.</li><li>About 11.2 percent of households in rural areas and about 7.2 percent of households in urban areas purchased/constructed any new house/flat for residential purpose after 31.03.2014. </li></ul><p> </p><p><strong>Table 1: Percentage distribution of households by distance to the principal source of drinking water</strong></p><p><img alt="" src="/upload/images/Table%201%20Principle%20source%20of%20drinking%20water.PNG" style="height:206px; width:877px" /></p><p>Source: NSS Report No. 589: Multiple Indicator Survey in India, Ministry of Statistics and Programme Implementation</p><p> </p><p>The table above reveals that 60.5 percent of urban houselholds and 29 percent of rural households have access to drinking water within the dwelling. The all-India average works out to 39.1 percent. 21.2 percent of urban and 30 percent of rural households' primary source of drinking water is outside the dwelling, but within the premesis of residence, whereas 18.4 percent of urban and 41.1 percent of rural households have to step outside the premesis to get their water. </p><p> </p><p><strong>Donut Chart</strong></p><p><iframe class="flourish-embed-iframe" frameborder="0" scrolling="no" src="https://flo.uri.sh/visualisation/13626204/embed" style="width:100%;height:600px;" title="Interactive or visual content"></iframe></p><div style="margin-top:4px!important; text-align:right!important; width:100%!"><a href="https://public.flourish.studio/visualisation/13626204/?utm_source=embed&utm_campaign=visualisation/13626204" style="text-decoration:none!important" target="_top" title="https://public.flourish.studio/visualisation/13626204/?utm_source=embed&utm_campaign=visualisation/13626204" style="text-decoration:none!important" target="_top"> </a></div><p> </p><p>A household was considered to have access to a latrine if majority of the household members had the facility of using latrine irrespective of whether it was used by them or not. Information on access to latrine was collected in terms of six categories: (i) exclusive use of household, (ii) common use of households in the building, (iii) public/community use without payment, (iv) public/community use with payment, (v) others and (vi) no latrine. The chart above gives the average of urban and rural households. Breaking it down into the two categories, 80.8 percent of urban households had exclusive use of a latrine, while among rural households that number was just 68.8 percent. Significantly, 21.3 percent of rural households had no access to a latrine. </p><p> </p><p><strong>Chart 1: Percentage distribution of households by primary source of energy used for cooking</strong></p><p><iframe class="flourish-embed-iframe" frameborder="0" scrolling="no" src="https://flo.uri.sh/visualisation/13625833/embed" style="width:100%;height:600px;" title="Interactive or visual content"></iframe></p><div style="margin-top:4px!important; text-align:right!important; width:100%!"><a href="https://public.flourish.studio/visualisation/13625833/?utm_source=embed&utm_campaign=visualisation/13625833" style="text-decoration:none!important" target="_top" title="https://public.flourish.studio/visualisation/13625833/?utm_source=embed&utm_campaign=visualisation/13625833" style="text-decoration:none!important" target="_top"> </a></div><p> </p><p> </p><p><strong>Chart 2: Persons aged 18 and above who have an active mobile and SIM card in the three months prior to survey</strong></p><p><iframe class="flourish-embed-iframe" frameborder="0" scrolling="no" src="https://flo.uri.sh/visualisation/13626482/embed" style="width:100%;height:600px;" title="Interactive or visual content"></iframe></p><div style="margin-top:4px!important; text-align:right!important; width:100%!"><a href="https://public.flourish.studio/visualisation/13626482/?utm_source=embed&utm_campaign=visualisation/13626482" style="text-decoration:none!important" target="_top" title="https://public.flourish.studio/visualisation/13626482/?utm_source=embed&utm_campaign=visualisation/13626482" style="text-decoration:none!important" target="_top"> </a></div><p> </p><p> </p><p><strong>Table 2: Percentage of persons who have an account individually or jointly in any bank/ other financial institution/mobile money service provider</strong></p><p><img alt="" src="/upload/images/tablw%202%20persons%20with%20bank%20account.PNG" style="height:192px; width:936px" /></p><p> </p><p>The survey was initially planned for January-December, 2020, but due to Covid 19 pandemic, but the the data collection was extended to August 2021. For the central sample, the survey was spread over 14,266 first stage units (8,469 in rural areas and 5,797 in urban areas) covering 2,76,409 sample households (1,64,529 in rural areas and 1,11,880 in urban areas). </p><p>Please click here to access the<a href="/upload/files/MultipleIndicatorSurveyinIndiaf_0.pdf" title="/upload/files/MultipleIndicatorSurveyinIndiaf_0.pdf"> NSSO Report</a><br />Photo Credit: Salahuddin, <a href="https://www.downtoearth.org.in/news/water/nearly-80-per-cent-indian-households-without-piped-water-connection-67928" title="https://www.downtoearth.org.in/news/water/nearly-80-per-cent-indian-households-without-piped-water-connection-67928">Down to Earth</a></p><p>References<br />NSS Report No. 589: Multiple Indicator Survey in India (78th round), Ministry of Statistics and Programme Implementation, March 2023</p>'
$lang = 'English'
$SITE_URL = 'https://im4change.in/'
$site_title = 'im4change'
$adminprix = 'admin'
include - APP/Template/Layout/printlayout.ctp, line 8
Cake\View\View::_evaluate() - CORE/src/View/View.php, line 1413
Cake\View\View::_render() - CORE/src/View/View.php, line 1374
Cake\View\View::renderLayout() - CORE/src/View/View.php, line 927
Cake\View\View::render() - CORE/src/View/View.php, line 885
Cake\Controller\Controller::render() - CORE/src/Controller/Controller.php, line 791
Cake\Http\ActionDispatcher::_invoke() - CORE/src/Http/ActionDispatcher.php, line 126
Cake\Http\ActionDispatcher::dispatch() - CORE/src/Http/ActionDispatcher.php, line 94
Cake\Http\BaseApplication::__invoke() - CORE/src/Http/BaseApplication.php, line 235
Cake\Http\Runner::__invoke() - CORE/src/Http/Runner.php, line 65
Cake\Routing\Middleware\RoutingMiddleware::__invoke() - CORE/src/Routing/Middleware/RoutingMiddleware.php, line 162
Cake\Http\Runner::__invoke() - CORE/src/Http/Runner.php, line 65
Cake\Routing\Middleware\AssetMiddleware::__invoke() - CORE/src/Routing/Middleware/AssetMiddleware.php, line 88
Cake\Http\Runner::__invoke() - CORE/src/Http/Runner.php, line 65
Cake\Error\Middleware\ErrorHandlerMiddleware::__invoke() - CORE/src/Error/Middleware/ErrorHandlerMiddleware.php, line 96
Cake\Http\Runner::__invoke() - CORE/src/Http/Runner.php, line 65
Cake\Http\Runner::run() - CORE/src/Http/Runner.php, line 51
news-alerts-57/nsso-survey-only-39-1-of-all-households-have-drinking-water-within-dwelling-46-7-of-rural-households-use-firewood-for-cooking.html"/>
NEWS ALERTS | NSSO Survey: Only 39.1% of all Households have Drinking Water Within Dwelling, 46.7% of Rural Households use Firewood for Cooking | Im4change.org
NSSO Survey: Only 39.1% of all Households have Drinking Water Within Dwelling, 46.7% of Rural Households use Firewood for Cooking
The National Sample Survey Organization's Multiple Indicator Survey - part of the 78th round - has revealed that only 39.1 percent of all Indian households have access to drinking water within the dwelling. When it come to cooking, 46.7% of rural households use firewood.
These are some of the findings of the survey whose purpose was to collect data about the indicators of Sustainable Development Goals. Data was collected for households and population; drinking water and sanitation; household energy use; education and ICT skills; mobile/broadband and mass media; financial inclusion and indebtedness; birth registration; purchase/construction of new house; migration.
The key findings are:
About 95.0 percent of the persons in the rural areas and about 97.2 percent of the persons in the urban areas used ‘improved source of drinking water'.
About 56.3 percent of the persons in the rural areas and about 76.3 percent of the persons in the urban areas used improved source of drinking water located in the household premises which was sufficiently available throughout the year.
Among the persons who had reported access to latrine and hand washing facility, about 73.3 percent of the persons in the rural areas and about 81.4 percent of the persons in the urban areas had exclusive access to improved latrine and hand washing facilities with water and soap/detergent within the household premises.
About 49.8 percent of households in the rural areas and about 92.0 percent of households in the urban areas used clean fuel as primary source of energy for cooking. Here clean fuel refers to LPG, other natural gas, gobar gas, other biogas, electricity.
About 33.0 percent of persons in rural areas and about 39.4 percent of persons in urban areas of age 15-29 years were in formal and non-formal education and training for the 12 months preceding the survey.
About 67.8 percent of persons of age 18 years and above in rural areas and about 83.7 percent of persons of age 18 years and above in urban areas used mobile telephone with active sim card during the three months preceding the date of the survey.
Among the persons of age 18 years and above, about 89.3 percent of persons in rural areas and about 89.6 percent of persons in urban areas had an account individually or jointly in any bank/ other financial institution/ mobile money service provider.
Out of 1,00,000 persons of age 18 years and above, 16,223 persons in rural areas and 14,889 persons in urban areas were indebted to any institutional/non-institutional agency as on the date of survey.
About 92.5 percent of households in rural areas reported availability of all-weather roads within 2 km from the place of living.
About 11.2 percent of households in rural areas and about 7.2 percent of households in urban areas purchased/constructed any new house/flat for residential purpose after 31.03.2014.
Table 1: Percentage distribution of households by distance to the principal source of drinking water
Source: NSS Report No. 589: Multiple Indicator Survey in India, Ministry of Statistics and Programme Implementation
The table above reveals that 60.5 percent of urban houselholds and 29 percent of rural households have access to drinking water within the dwelling. The all-India average works out to 39.1 percent. 21.2 percent of urban and 30 percent of rural households' primary source of drinking water is outside the dwelling, but within the premesis of residence, whereas 18.4 percent of urban and 41.1 percent of rural households have to step outside the premesis to get their water.
Donut Chart
A household was considered to have access to a latrine if majority of the household members had the facility of using latrine irrespective of whether it was used by them or not. Information on access to latrine was collected in terms of six categories: (i) exclusive use of household, (ii) common use of households in the building, (iii) public/community use without payment, (iv) public/community use with payment, (v) others and (vi) no latrine. The chart above gives the average of urban and rural households. Breaking it down into the two categories, 80.8 percent of urban households had exclusive use of a latrine, while among rural households that number was just 68.8 percent. Significantly, 21.3 percent of rural households had no access to a latrine.
Chart 1: Percentage distribution of households by primary source of energy used for cooking
Chart 2: Persons aged 18 and above who have an active mobile and SIM card in the three months prior to survey
Table 2: Percentage of persons who have an account individually or jointly in any bank/ other financial institution/mobile money service provider
The survey was initially planned for January-December, 2020, but due to Covid 19 pandemic, but the the data collection was extended to August 2021. For the central sample, the survey was spread over 14,266 first stage units (8,469 in rural areas and 5,797 in urban areas) covering 2,76,409 sample households (1,64,529 in rural areas and 1,11,880 in urban areas).