Deprecated (16384): The ArrayAccess methods will be removed in 4.0.0.Use getParam(), getData() and getQuery() instead. - /home/brlfuser/public_html/src/Controller/ArtileDetailController.php, line: 73
You can disable deprecation warnings by setting `Error.errorLevel` to `E_ALL & ~E_USER_DEPRECATED` in your config/app.php. [CORE/src/Core/functions.php, line 311]
deprecationWarning - CORE/src/Core/functions.php, line 311
Cake\Http\ServerRequest::offsetGet() - CORE/src/Http/ServerRequest.php, line 2421
App\Controller\ArtileDetailController::printArticle() - APP/Controller/ArtileDetailController.php, line 73
Cake\Controller\Controller::invokeAction() - CORE/src/Controller/Controller.php, line 610
Cake\Http\ActionDispatcher::_invoke() - CORE/src/Http/ActionDispatcher.php, line 120
Cake\Http\ActionDispatcher::dispatch() - CORE/src/Http/ActionDispatcher.php, line 94
Cake\Http\BaseApplication::__invoke() - CORE/src/Http/BaseApplication.php, line 235
Cake\Http\Runner::__invoke() - CORE/src/Http/Runner.php, line 65
Cake\Routing\Middleware\RoutingMiddleware::__invoke() - CORE/src/Routing/Middleware/RoutingMiddleware.php, line 162
Cake\Http\Runner::__invoke() - CORE/src/Http/Runner.php, line 65
Cake\Routing\Middleware\AssetMiddleware::__invoke() - CORE/src/Routing/Middleware/AssetMiddleware.php, line 88
Cake\Http\Runner::__invoke() - CORE/src/Http/Runner.php, line 65
Cake\Error\Middleware\ErrorHandlerMiddleware::__invoke() - CORE/src/Error/Middleware/ErrorHandlerMiddleware.php, line 96
Cake\Http\Runner::__invoke() - CORE/src/Http/Runner.php, line 65
Cake\Http\Runner::run() - CORE/src/Http/Runner.php, line 51
Cake\Http\Server::run() - CORE/src/Http/Server.php, line 98
Deprecated (16384): The ArrayAccess methods will be removed in 4.0.0.Use getParam(), getData() and getQuery() instead. - /home/brlfuser/public_html/src/Controller/ArtileDetailController.php, line: 74
You can disable deprecation warnings by setting `Error.errorLevel` to `E_ALL & ~E_USER_DEPRECATED` in your config/app.php. [CORE/src/Core/functions.php, line 311]
deprecationWarning - CORE/src/Core/functions.php, line 311
Cake\Http\ServerRequest::offsetGet() - CORE/src/Http/ServerRequest.php, line 2421
App\Controller\ArtileDetailController::printArticle() - APP/Controller/ArtileDetailController.php, line 74
Cake\Controller\Controller::invokeAction() - CORE/src/Controller/Controller.php, line 610
Cake\Http\ActionDispatcher::_invoke() - CORE/src/Http/ActionDispatcher.php, line 120
Cake\Http\ActionDispatcher::dispatch() - CORE/src/Http/ActionDispatcher.php, line 94
Cake\Http\BaseApplication::__invoke() - CORE/src/Http/BaseApplication.php, line 235
Cake\Http\Runner::__invoke() - CORE/src/Http/Runner.php, line 65
Cake\Routing\Middleware\RoutingMiddleware::__invoke() - CORE/src/Routing/Middleware/RoutingMiddleware.php, line 162
Cake\Http\Runner::__invoke() - CORE/src/Http/Runner.php, line 65
Cake\Routing\Middleware\AssetMiddleware::__invoke() - CORE/src/Routing/Middleware/AssetMiddleware.php, line 88
Cake\Http\Runner::__invoke() - CORE/src/Http/Runner.php, line 65
Cake\Error\Middleware\ErrorHandlerMiddleware::__invoke() - CORE/src/Error/Middleware/ErrorHandlerMiddleware.php, line 96
Cake\Http\Runner::__invoke() - CORE/src/Http/Runner.php, line 65
Cake\Http\Runner::run() - CORE/src/Http/Runner.php, line 51
Cake\Http\Server::run() - CORE/src/Http/Server.php, line 98
Warning (512): Unable to emit headers. Headers sent in file=/home/brlfuser/public_html/vendor/cakephp/cakephp/src/Error/Debugger.php line=853 [CORE/src/Http/ResponseEmitter.php, line 48]
if (Configure::read('debug')) {
trigger_error($message, E_USER_WARNING);
} else {
$response = object(Cake\Http\Response) {
'status' => (int) 200,
'contentType' => 'text/html',
'headers' => [
'Content-Type' => [
[maximum depth reached]
]
],
'file' => null,
'fileRange' => [],
'cookies' => object(Cake\Http\Cookie\CookieCollection) {},
'cacheDirectives' => [],
'body' => '<!DOCTYPE html PUBLIC "-//W3C//DTD XHTML 1.0 Transitional//EN"
"http://www.w3.org/TR/xhtml1/DTD/xhtml1-transitional.dtd">
<html xmlns="http://www.w3.org/1999/xhtml">
<head>
<link rel="canonical" href="https://im4change.in/<pre class="cake-error"><a href="javascript:void(0);" onclick="document.getElementById('cakeErr67edc2d06b76a-trace').style.display = (document.getElementById('cakeErr67edc2d06b76a-trace').style.display == 'none' ? '' : 'none');"><b>Notice</b> (8)</a>: Undefined variable: urlPrefix [<b>APP/Template/Layout/printlayout.ctp</b>, line <b>8</b>]<div id="cakeErr67edc2d06b76a-trace" class="cake-stack-trace" style="display: none;"><a href="javascript:void(0);" onclick="document.getElementById('cakeErr67edc2d06b76a-code').style.display = (document.getElementById('cakeErr67edc2d06b76a-code').style.display == 'none' ? '' : 'none')">Code</a> <a href="javascript:void(0);" onclick="document.getElementById('cakeErr67edc2d06b76a-context').style.display = (document.getElementById('cakeErr67edc2d06b76a-context').style.display == 'none' ? '' : 'none')">Context</a><pre id="cakeErr67edc2d06b76a-code" class="cake-code-dump" style="display: none;"><code><span style="color: #000000"><span style="color: #0000BB"></span><span style="color: #007700"><</span><span style="color: #0000BB">head</span><span style="color: #007700">>
</span></span></code>
<span class="code-highlight"><code><span style="color: #000000"> <link rel="canonical" href="<span style="color: #0000BB"><?php </span><span style="color: #007700">echo </span><span style="color: #0000BB">Configure</span><span style="color: #007700">::</span><span style="color: #0000BB">read</span><span style="color: #007700">(</span><span style="color: #DD0000">'SITE_URL'</span><span style="color: #007700">); </span><span style="color: #0000BB">?><?php </span><span style="color: #007700">echo </span><span style="color: #0000BB">$urlPrefix</span><span style="color: #007700">;</span><span style="color: #0000BB">?><?php </span><span style="color: #007700">echo </span><span style="color: #0000BB">$article_current</span><span style="color: #007700">-></span><span style="color: #0000BB">category</span><span style="color: #007700">-></span><span style="color: #0000BB">slug</span><span style="color: #007700">; </span><span style="color: #0000BB">?></span>/<span style="color: #0000BB"><?php </span><span style="color: #007700">echo </span><span style="color: #0000BB">$article_current</span><span style="color: #007700">-></span><span style="color: #0000BB">seo_url</span><span style="color: #007700">; </span><span style="color: #0000BB">?></span>.html"/>
</span></code></span>
<code><span style="color: #000000"><span style="color: #0000BB"> </span><span style="color: #007700"><</span><span style="color: #0000BB">meta http</span><span style="color: #007700">-</span><span style="color: #0000BB">equiv</span><span style="color: #007700">=</span><span style="color: #DD0000">"Content-Type" </span><span style="color: #0000BB">content</span><span style="color: #007700">=</span><span style="color: #DD0000">"text/html; charset=utf-8"</span><span style="color: #007700">/>
</span></span></code></pre><pre id="cakeErr67edc2d06b76a-context" class="cake-context" style="display: none;">$viewFile = '/home/brlfuser/public_html/src/Template/Layout/printlayout.ctp'
$dataForView = [
'article_current' => object(App\Model\Entity\Article) {
'id' => (int) 62349,
'title' => 'Real wage rates of the rural workers hardly increased during the last 6 years',
'subheading' => null,
'description' => '<p style="text-align:justify">In the absence of income or expenditure-based headcount ratio, the growth in the real wages <em>(i.e., nominal wages adjusted against retail inflation)</em> of the manual workers is considered to be a good proxy to assess the trends in poverty. This is because the manual, unskilled/ semi-skilled labourers exist at the bottom of the pyramid or economic hierarchy, and most of them belong to the social categories Scheduled Castes (SCs) and Scheduled Tribes (STs). A positive growth in their real wages <em>(or real wage rates) </em>is anticipated to improve their purchasing power <em>(i.e., income or consumption expenditure)</em> and lift them out of the poverty trap. &nbsp;</p>
<p style="text-align:justify">Clearly, there exists inter-state differences in nominal wage rates, growth in nominal wage rates and growth in real wage rates, which we will see in this news alert.&nbsp;</p>
<p style="text-align:justify">Against the backdrop of the <a href="https://www.thehindubusinessline.com/markets/commodities/govt-reviews-cooking-oil-imports-as-ukraine-crisis-disrupts-supplies-prices-shoot-up/article65190879.ece">Russia-Ukraine conflict</a>, which is anticipated to cause both <a href="https://www.ndtv.com/business/indias-economy-faces-a-potential-stagflation-risk-from-ukraine-war-2796624">food and fuel retail inflation</a> in India in the coming times, it is even more important to look at the past trends in wage rate growth of the rural workers. It should be noted that the <a href="https://public.flourish.studio/visualisation/8706137">year-on-year inflation</a> in <a href="https://public.flourish.studio/visualisation/8706137">Consumer</a> <a href="https://public.flourish.studio/visualisation/8706137">Price Index Rural</a> exceeded the <a href="https://public.flourish.studio/visualisation/8706137">year-on-year inflation</a> in <a href="https://public.flourish.studio/visualisation/8706137">CPI Urban</a> during January 2022 at the national level. Even before the beginning of Russia-Ukraine conflict <em>(i.e., during January 2022)</em>, in rural areas, <a href="https://im4change.org/upload/files/CPI%20Press%20Release%20January%202022%281%29.pdf">retail inflation rate of 20.6 percent</a> was noticed for &#39;oils and fats&#39;, aside from&nbsp;<a href="https://im4change.org/upload/files/CPI%20Press%20Release%20January%202022%281%29.pdf">8.44 percent retail inflation for &#39;fuel and light&#39;</a>, <a href="https://im4change.org/upload/files/CPI%20Press%20Release%20January%202022%281%29.pdf">8.27 percent</a> for &#39;transport and communication&#39;, and <a href="https://im4change.org/upload/files/CPI%20Press%20Release%20January%202022%281%29.pdf">9.65 percent for &#39;clothing and footwear&#39;</a>.&nbsp; &nbsp;&nbsp;</p>
<p style="text-align:justify">At the national level, the average daily nominal wage rate&nbsp;for male construction workers in rural areas during the period from 2014-15 to 2020-21 was Rs. 316.9, which was greater than that of the male non-farm workers in rural areas. The average daily nominal wage rate&nbsp;for male non-agricultural labourers in rural areas during the period from 2014-15 to 2020-21 was Rs. 273.8, which exceeded the average daily nominal wage rates for male farm labourers in rural areas <em>(i.e., Rs. 265.1)</em>. However, in Andhra Pradesh, Haryana, Himachal Pradesh, Jammu and Kashmir,&nbsp;Karnataka, Kerala, Meghalaya, Punjab, and Tripura, the average daily nominal wage rates for male agricultural labourers in rural areas during the period from 2014-15 to 2020-21 exceeded the average daily nominal wage rates for male non-farm labourers in rural areas. Please see chart-1.</p>
<p style="text-align:justify"><img alt="" src="/upload/images/Chart%201.png" style="height:670px; width:1000px" /></p>
<p style="text-align:justify"><em><strong>Notes:</strong> The average (i.e., arithmetic mean) daily nominal wage rates for various categories of workers in rural India in the period from 2014-15 to 2020-21 has been calculated by the Inclusive Media for Change staff</em></p>
<p style="text-align:justify"><em>Please <a href="https://docs.google.com/spreadsheets/d/1avu0-WtaKV2RHXtz2eiP7iS8znGVBdKC/edit?usp=sharing&amp;ouid=112233925171588304692&amp;rtpof=true&amp;sd=true">click here</a> to access the data in spreadsheet format</em></p>
<p style="text-align:justify"><em><strong>Source:&nbsp;</strong>Handbook of Statistics on Indian States 2020-21, released in November 2021, please <a href="https://m.rbi.org.in/scripts/AnnualPublications.aspx?head=Handbook%20of%20Statistics%20on%20Indian%20States">click here</a> to access</em></p>
<p style="text-align:justify"><em>State-wise Average Daily Wage Rates in Rural India (Men - General Agricultural Labourers), RBI Handbook of Statistics on Indian States 2020-21, released in November 2021, please <a href="/upload/files/State-wise%20Average%20Daily%20Wage%20Rates%20in%20Rural%20India%20Men%20-%20General%20Agricultural%20Labourers.PDF">click here</a> to access&nbsp;</em></p>
<p style="text-align:justify"><em>State-wise Average Daily Wage Rates in Rural India (Men - Non-Agricultural Labourers), RBI Handbook of Statistics on Indian States 2020-21, released in November 2021, please <a href="/upload/files/State-wise%20Average%20Daily%20Wage%20Rates%20in%20Rural%20India%20Men%20-%20Non%20Agricultural%20Labourers.PDF">click here</a> to access&nbsp;</em></p>
<p style="text-align:justify"><em>State-wise Average Daily Wage Rates in Rural India (Men - Construction Workers), RBI Handbook of Statistics on Indian States 2020-21, released in November 2021, please <a href="/upload/files/State-wise%20Average%20Daily%20Wage%20Rates%20in%20Rural%20India%20Men%20-%20Construction%20Workers.PDF">click here</a> to access&nbsp;</em></p>
<p style="text-align:justify"><em>State-wise Average Inflation (CPI) - Inflation, RBI Handbook of Statistics on Indian States 2020-21, released in November 2021, please <a href="/upload/files/State-wise%20Average%20Inflation%20CPI%20-%20Inflation.PDF">click here</a> to access&nbsp;</em></p>
<p style="text-align:justify"><strong>---</strong></p>
<p style="text-align:justify">At the national level, the agricultural nominal wage rate&nbsp;grew faster than the non-farm wage&nbsp;rate&nbsp;on average for male labourers in rural areas during the period from 2015-16 to 2020-21. However, in states like Assam, Bihar, Haryana, Madhya Pradesh, Odisha, Punjab, and West Bengal, the non-farm nominal wage rates grew faster than the farm wage rates on average for male workers in rural areas during the period from 2015-16 to 2020-21. Please see chart-2.&nbsp;</p>
<p style="text-align:justify"><img alt="" src="/upload/images/Chart%202.png" style="height:653px; width:1000px" /></p>
<p style="text-align:justify"><em><strong>Notes: </strong>The average growth in daily nominal wage rates for various categories of workers in rural India in the period from 2015-16 to 2020-21 has been calculated by the Inclusive Media for Change staff</em></p>
<p style="text-align:justify"><em>Please <a href="https://docs.google.com/spreadsheets/d/1avu0-WtaKV2RHXtz2eiP7iS8znGVBdKC/edit?usp=sharing&amp;ouid=112233925171588304692&amp;rtpof=true&amp;sd=true">click here</a> to access the data in spreadsheet format</em></p>
<p style="text-align:justify"><em><strong>Source: </strong>Same as above</em><br />
<strong>---</strong></p>
<p style="text-align:justify">At the national level, the construction sector nominal wage rate&nbsp;grew slower than the non-agricultural wage&nbsp;rate&nbsp;on average for male labourers in rural areas during the period from 2015-16 to 2020-21. However, in states like Andhra Pradesh, Bihar, Himachal Pradesh, Maharashtra, Meghalaya, Punjab,&nbsp;Tamil Nadu, and Uttar Pradesh, the construction sector nominal wage rates grew faster than the non-farm wage rates on average for male workers in rural areas during the period from 2015-16 to 2020-21. Please take a look at chart-2. &nbsp;</p>
<p style="text-align:justify">At the national level, the agricultural wage rate&nbsp;in real terms grew faster than the non-farm wage rate&nbsp;on average for male labourers in rural areas during the period from 2015-16 to 2020-21. However, in states like Assam, Bihar, Haryana, Madhya Pradesh, Odisha, Punjab, and West Bengal, the non-farm wage rates in real terms grew faster than the farm wage rates on average for male workers in rural areas during the period from 2015-16 to 2020-21. Please see table-1.</p>
<p style="text-align:justify"><strong>Table 1: State-wise Growth in Average Daily Wage Rates in Real terms for Male Agricultural Labourers, Male Non-Agricultural Labourers, and Male Construction Workers in Rural India, in %</strong><br />
<img alt="" src="/upload/images/Table%201%20State-wise%20Growth%20in%20Average%20Daily%20Wage%20Rates%20in%20Real%20terms%20for%20Male%20Agricultural%20Labourers%20Male%20Non-Agricultural%20Labourers%20and%20Male%20Construction%20Workers%20in%20Rural%20India%20in%20percent.png" style="height:539px; width:750px" /></p>
<p style="text-align:justify"><em><strong>Notes: </strong>The average growth in daily wage rates in real terms for various categories of workers in rural India in the period from 2015-16 to 2020-21 has been calculated by the Inclusive Media for Change staff</em></p>
<p style="text-align:justify"><em>Please <a href="https://docs.google.com/spreadsheets/d/1avu0-WtaKV2RHXtz2eiP7iS8znGVBdKC/edit?usp=sharing&amp;ouid=112233925171588304692&amp;rtpof=true&amp;sd=true">click here</a> to access the data in spreadsheet format</em></p>
<p style="text-align:justify"><em><strong>Source: </strong>Same as above</em><br />
<strong>---</strong></p>
<p style="text-align:justify">At the national level, the construction sector wage rate&nbsp;in real terms grew slower than the non-agricultural wage rate&nbsp;on average for male labourers in rural areas during the period from 2015-16 to 2020-21. However, in states like Andhra Pradesh, Bihar, Himachal Pradesh, Maharashtra, Meghalaya, Punjab, Tamil Nadu, and Uttar Pradesh, the construction sector wage rates in real terms grew faster than the non-farm wage rates on average for male workers in rural areas during the period from 2015-16 to 2020-21. Please take a look at table-1. &nbsp;</p>
<p style="text-align:justify">In the following paragraphs, we have discussed the trends in agricultural wage rates, non-farm wage rates, and construction sector wage rates <em>(in rural areas)</em> in detail.&nbsp;</p>
<p style="text-align:justify"><strong>Agricultural wages in rural areas</strong></p>
<p style="text-align:justify">The highest <a href="https://im4change.org/upload/files/State%20wise%20average%20daily%20nominal%20wage%20rates%20in%20rural%20india%20men%20farm%20labourers.JPG">average daily nominal wage rate</a> <a href="https://im4change.org/upload/files/State%20wise%20average%20daily%20nominal%20wage%20rates%20in%20rural%20india%20men%20farm%20labourers.JPG">for male agricultural labourers</a> in rural India during the period from 2014-15 to 2020-21 was found in Kerala <em>(Rs. 653.93)</em>, followed by Jammu and Kashmir <em>(Rs. 429.19)</em>, Tamil Nadu <em>(Rs. 385.6)</em>, Haryana <em>(Rs. 368.53)</em>, Himachal Pradesh <em>(Rs. 366.23)</em>, and Punjab <em>(Rs. 325.31)</em>. Please have a look at chart-1.</p>
<p style="text-align:justify">The lowest <a href="https://im4change.org/upload/files/State%20wise%20average%20daily%20nominal%20wage%20rates%20in%20rural%20india%20men%20farm%20labourers.JPG">average daily nominal wage rate</a> <a href="https://im4change.org/upload/files/State%20wise%20average%20daily%20nominal%20wage%20rates%20in%20rural%20india%20men%20farm%20labourers.JPG">for male agricultural labourers</a> in rural India during the period from 2014-15 to 2020-21 was observed in Madhya Pradesh <em>(Rs. 183.97)</em>, followed by Gujarat <em>(Rs. 190.07)</em>, Maharashtra <em>(Rs. 215.71)</em>, Odisha <em>(Rs. 216.87)</em>, Meghalaya <em>(Rs. 219.93)</em>, Bihar <em>(Rs. 230.43)</em>, Uttar Pradesh <em>(Rs. 230.5)</em>, and Assam <em>(Rs. 237.3)</em>. The related national level figure was Rs. 265.09 during the period from 2014-15 to 2020-21. Please consult chart-1.&nbsp;</p>
<p style="text-align:justify">The highest <a href="https://im4change.org/upload/files/State%20wise%20growth%20in%20average%20daily%20nominal%20wage%20rates%20in%20rural%20india%20men%20farm%20labourers.JPG">average annual growth rate in</a> <a href="https://im4change.org/upload/files/State%20wise%20growth%20in%20average%20daily%20nominal%20wage%20rates%20in%20rural%20india%20men%20farm%20labourers.JPG">nominal wage rates</a> during the period from 2015-16 to 2020-21 was found in Karnataka <em>(7.3 percent)</em>, followed by Andhra Pradesh <em>(6.8 percent)</em>, Madhya Pradesh <em>(6.4 percent)</em>, Uttar Pradesh <em>(6.2 percent)</em>, Odisha <em>(6.1 percent)</em>, and Meghalaya <em>(6.0 percent)</em>. Please see chart-2.</p>
<p style="text-align:justify">The lowest <a href="https://im4change.org/upload/files/State%20wise%20growth%20in%20average%20daily%20nominal%20wage%20rates%20in%20rural%20india%20men%20farm%20labourers.JPG">average annual growth rate</a> <a href="https://im4change.org/upload/files/State%20wise%20growth%20in%20average%20daily%20nominal%20wage%20rates%20in%20rural%20india%20men%20farm%20labourers.JPG">in nominal wage rates</a> during the same period was noticed in Haryana <em>(2.1 percent)</em>, followed by Rajasthan <em>(3.3 percent)</em>, Kerala <em>(3.5 percent)</em>, Punjab <em>(3.9 percent)</em>, and Tamil Nadu <em>(4.5 percent)</em>. Please consult chart-2.</p>
<p style="text-align:justify">The average annual <a href="https://im4change.org/upload/files/State%20wise%20growth%20in%20average%20daily%20wage%20rates%20in%20real%20terms%20for%20male%20farm%20labourers%20in%20rural%20India.JPG">growth of agricultural labourers&rsquo;</a> <a href="https://im4change.org/upload/files/State%20wise%20growth%20in%20average%20daily%20wage%20rates%20in%20real%20terms%20for%20male%20farm%20labourers%20in%20rural%20India.JPG">wage rates in real terms</a> during the period from 2015-16 to 2020-21 were negative in Haryana <em>(-2.1 percent)</em>, Jammu and Kashmir <em>(-0.3 percent)</em>, Kerala <em>(-1.7 percent)</em>, Punjab <em>(-0.4 percent)</em>, Rajasthan <em>(-1.1 percent)</em>, Tamil Nadu <em>(-0.8 percent)</em>, Tripura <em>(-0.5 percent)</em>, and West Bengal <em>(-0.1 percent)</em>. It should be noted that the <a href="https://im4change.org/upload/files/State-wise%20Average%20Inflation%20CPI%20-%20Inflation.PDF">rate of inflation</a> in <a href="https://im4change.org/upload/files/State-wise%20Average%20Inflation%20CPI%20-%20Inflation.PDF">Consumer Price Index-General</a> has been used to get the average annual growth of agricultural labourers&rsquo; wage rates in real terms. Kindly consult table-1. &nbsp;</p>
<p style="text-align:justify">Some states witnessed negative <a href="https://im4change.org/upload/files/State%20wise%20growth%20in%20average%20daily%20wage%20rates%20in%20real%20terms%20for%20male%20farm%20labourers%20in%20rural%20India.JPG">growth in agricultural labourers&rsquo;</a> <a href="https://im4change.org/upload/files/State%20wise%20growth%20in%20average%20daily%20wage%20rates%20in%20real%20terms%20for%20male%20farm%20labourers%20in%20rural%20India.JPG">wage rates in real terms</a> for more than two years between 2015-16 and 2020-21. For example, <a href="https://im4change.org/upload/files/State%20wise%20growth%20in%20average%20daily%20wage%20rates%20in%20real%20terms%20for%20male%20farm%20labourers%20in%20rural%20India.JPG">Haryana</a> experienced negative growth in 2015-16, 2016-17, 2017-18, 2019-20, and 2020-21. Likewise, <a href="https://im4change.org/upload/files/State%20wise%20growth%20in%20average%20daily%20wage%20rates%20in%20real%20terms%20for%20male%20farm%20labourers%20in%20rural%20India.JPG">Kerala</a> faced negative growth in 2017-18, 2018-19, 2019-20, and 2020-21. &nbsp;</p>
<p style="text-align:justify">At the national level, the <a href="https://im4change.org/upload/files/State%20wise%20growth%20in%20average%20daily%20wage%20rates%20in%20real%20terms%20for%20male%20farm%20labourers%20in%20rural%20India.JPG">agricultural labourers&rsquo;</a> <a href="https://im4change.org/upload/files/State%20wise%20growth%20in%20average%20daily%20wage%20rates%20in%20real%20terms%20for%20male%20farm%20labourers%20in%20rural%20India.JPG">wage rates in real terms</a> on average grew by 1.0 percent annually during the period from 2015-16 to 2020-21.</p>
<p style="text-align:justify">Please <a href="https://docs.google.com/spreadsheets/d/1avu0-WtaKV2RHXtz2eiP7iS8znGVBdKC/edit?usp=sharing&amp;ouid=112233925171588304692&amp;rtpof=true&amp;sd=true">click here</a> to access the spreadsheet in order to look at the trends in <a href="/upload/files/State%20wise%20average%20daily%20nominal%20wage%20rates%20in%20rural%20india%20men%20farm%20labourers.JPG">nominal wage rates</a>, <a href="/upload/files/State%20wise%20growth%20in%20average%20daily%20nominal%20wage%20rates%20in%20rural%20india%20men%20farm%20labourers.JPG">annual growth in nominal wage rates</a> and <a href="/upload/files/State%20wise%20growth%20in%20average%20daily%20wage%20rates%20in%20real%20terms%20for%20male%20farm%20labourers%20in%20rural%20India.JPG">annual growth in real wage rates</a> for farm labourers in rural areas.&nbsp;</p>
<p style="text-align:justify"><strong>Non-agricultural wages in rural areas</strong></p>
<p style="text-align:justify">The rural economy is not just about farming any longer. That is why we have looked at the wage growth in the non-farm sector too.&nbsp;The highest <a href="https://im4change.org/upload/files/State%20wise%20average%20daily%20nominal%20wage%20rates%20in%20rural%20india%20men%20non%20farm%20labourers.JPG">average daily nominal wage rate for male</a> <a href="https://im4change.org/upload/files/State%20wise%20average%20daily%20nominal%20wage%20rates%20in%20rural%20india%20men%20non%20farm%20labourers.JPG">non-agricultural labourers</a> in rural India during the period from 2014-15 to 2020-21 was detected in Kerala <em>(Rs. 639.01)</em>, followed by Jammu and Kashmir <em>(Rs. 426.37)</em>, Tamil Nadu <em>(Rs. 405.77)</em>, Haryana <em>(Rs. 359.24)</em>, Himachal Pradesh <em>(Rs. 311.10)</em>, and Punjab <em>(Rs. 309.09)</em>. Please see chart-1.</p>
<p style="text-align:justify">The lowest average <a href="https://im4change.org/upload/files/State%20wise%20average%20daily%20nominal%20wage%20rates%20in%20rural%20india%20men%20non%20farm%20labourers.JPG">daily nominal wage rate for male</a> <a href="https://im4change.org/upload/files/State%20wise%20average%20daily%20nominal%20wage%20rates%20in%20rural%20india%20men%20non%20farm%20labourers.JPG">non-agricultural labourers in rural India</a> during the period from 2014-15 to 2020-21 was found in Madhya Pradesh <em>(Rs. 191.47)</em>, followed by Meghalaya <em>(Rs. 210.26)</em>, Gujarat <em>(Rs. 213.51)</em>, Odisha <em>(Rs. 218.06)</em>, Maharashtra <em>(Rs. 226.70)</em>, Tripura <em>(Rs. 230.36)</em>, Bihar <em>(Rs. 243.51)</em>, and Uttar Pradesh <em>(Rs. 243.97)</em>. The related national level figure was Rs. 273.79 during the period from 2014-15 to 2020-21. Please see chart-1.</p>
<p style="text-align:justify">The highest <a href="https://im4change.org/upload/files/State%20wise%20growth%20in%20average%20daily%20nominal%20wage%20rates%20in%20rural%20india%20men%20non%20farm%20labourers.JPG">average annual growth rate in</a> <a href="https://im4change.org/upload/files/State%20wise%20growth%20in%20average%20daily%20nominal%20wage%20rates%20in%20rural%20india%20men%20non%20farm%20labourers.JPG">nominal wage rates</a> during the period from 2015-16 to 2020-21 was noticed in Odisha <em>(8.0 percent)</em>, followed by Madhya Pradesh <em>(7.6 percent)</em>, Assam <em>(6.6 percent)</em>, West Bengal <em>(5.9 percent)</em>, Uttar Pradesh and Andhra Pradesh <em>(5.6 percent each)</em>, and Bihar <em>(5.5 percent)</em>. Kindly consult chart-2.</p>
<p style="text-align:justify">The lowest <a href="https://im4change.org/upload/files/State%20wise%20growth%20in%20average%20daily%20nominal%20wage%20rates%20in%20rural%20india%20men%20non%20farm%20labourers.JPG">average annual growth rate</a> <a href="https://im4change.org/upload/files/State%20wise%20growth%20in%20average%20daily%20nominal%20wage%20rates%20in%20rural%20india%20men%20non%20farm%20labourers.JPG">in nominal wage rates</a> during the same period was observed in Kerala <em>(1.8 percent)</em>, followed by Haryana <em>(2.4 percent)</em>, Meghalaya <em>(2.8 percent)</em>, Tamil Nadu and Rajasthan <em>(3.2 percent each)</em>, Tripura and Jammu and Kashmir <em>(4.0 percent each),</em> and Maharashtra and Punjab <em>(4.2 percent each)</em>. Kindly consult chart-2.&nbsp;</p>
<p style="text-align:justify">The average annual <a href="https://im4change.org/upload/files/State%20wise%20growth%20in%20average%20daily%20wage%20rates%20in%20real%20terms%20for%20male%20non%20farm%20labourers%20in%20rural%20India.JPG">growth of non-agricultural labourers&rsquo;</a> <a href="https://im4change.org/upload/files/State%20wise%20growth%20in%20average%20daily%20wage%20rates%20in%20real%20terms%20for%20male%20non%20farm%20labourers%20in%20rural%20India.JPG">wage rates in real terms</a> during the period from 2015-16 to 2020-21 were negative in Haryana <em>(-1.9 percent)</em>, Jammu and Kashmir <em>(-1.7 percent)</em>, Kerala <em>(-3.5 percent)</em>, Maharashtra <em>(-0.3 percent)</em>, Meghalaya <em>(-1.2 percent)</em>, Punjab <em>(-0.1 percent)</em>, Rajasthan <em>(-1.2 percent)</em>, Tamil Nadu <em>(-2.1 percent)</em>, and Tripura <em>(-1.1 percent)</em>. It should be noted that the <a href="https://im4change.org/upload/files/State-wise%20Average%20Inflation%20CPI%20-%20Inflation.PDF">rate of inflation</a> in <a href="https://im4change.org/upload/files/State-wise%20Average%20Inflation%20CPI%20-%20Inflation.PDF">CPI-General</a> has been used to get the average annual growth of non-agricultural labourers&rsquo; wage rates in real terms. Kindly have a look at table-1. &nbsp;&nbsp;</p>
<p style="text-align:justify">Some states experienced negative growth in <a href="https://im4change.org/upload/files/State%20wise%20growth%20in%20average%20daily%20wage%20rates%20in%20real%20terms%20for%20male%20non%20farm%20labourers%20in%20rural%20India.JPG">non-agricultural labourers&rsquo; wage</a> <a href="https://im4change.org/upload/files/State%20wise%20growth%20in%20average%20daily%20wage%20rates%20in%20real%20terms%20for%20male%20non%20farm%20labourers%20in%20rural%20India.JPG">rates in real terms</a> for more than two years between 2015-16 and 2020-21. For example, <a href="https://im4change.org/upload/files/State%20wise%20growth%20in%20average%20daily%20wage%20rates%20in%20real%20terms%20for%20male%20non%20farm%20labourers%20in%20rural%20India.JPG">Haryana</a> experienced negative <a href="https://im4change.org/upload/files/State%20wise%20growth%20in%20average%20daily%20wage%20rates%20in%20real%20terms%20for%20male%20non%20farm%20labourers%20in%20rural%20India.JPG">growth in wage rates</a> <a href="https://im4change.org/upload/files/State%20wise%20growth%20in%20average%20daily%20wage%20rates%20in%20real%20terms%20for%20male%20non%20farm%20labourers%20in%20rural%20India.JPG"><em>(in real terms)</em></a> during 2016-17, 2017-18, 2018-19, 2019-20, and 2020-21. Likewise, <a href="https://im4change.org/upload/files/State%20wise%20growth%20in%20average%20daily%20wage%20rates%20in%20real%20terms%20for%20male%20non%20farm%20labourers%20in%20rural%20India.JPG">Kerala</a> faced negative growth rates in 2015-16, 2016-17, 2017-18, 2019-20, and 2020-21. &nbsp;</p>
<p style="text-align:justify">At the national level, the&nbsp;<a href="https://im4change.org/upload/files/State%20wise%20growth%20in%20average%20daily%20wage%20rates%20in%20real%20terms%20for%20male%20non%20farm%20labourers%20in%20rural%20India.JPG">non-agricultural labourers&rsquo;</a> <a href="https://im4change.org/upload/files/State%20wise%20growth%20in%20average%20daily%20wage%20rates%20in%20real%20terms%20for%20male%20non%20farm%20labourers%20in%20rural%20India.JPG">wage rates in real terms</a> on average grew by just 0.3 percent annually during the period from 2015-16 to 2020-21.&nbsp;</p>
<p style="text-align:justify">Please <a href="https://docs.google.com/spreadsheets/d/1avu0-WtaKV2RHXtz2eiP7iS8znGVBdKC/edit?usp=sharing&amp;ouid=112233925171588304692&amp;rtpof=true&amp;sd=true">click here</a> to access the spreadsheet in order to look at the <a href="/upload/files/State%20wise%20average%20daily%20nominal%20wage%20rates%20in%20rural%20india%20men%20non%20farm%20labourers.JPG">trends in nominal wage rates</a>, <a href="/upload/files/State%20wise%20growth%20in%20average%20daily%20nominal%20wage%20rates%20in%20rural%20india%20men%20non%20farm%20labourers.JPG">annual growth in nominal wage rates</a>, and <a href="/upload/files/State%20wise%20growth%20in%20average%20daily%20wage%20rates%20in%20real%20terms%20for%20male%20non%20farm%20labourers%20in%20rural%20India.JPG">annual growth in real wage rates</a> for non-farm labourers in rural areas.&nbsp;</p>
<p style="text-align:justify"><strong>Construction sector wages in rural areas</strong></p>
<p style="text-align:justify">The <a href="https://im4change.org/upload/files/State%20wise%20average%20daily%20nominal%20wage%20rates%20in%20rural%20india%20men%20construction%20workers.JPG">highest average daily nominal wage rates</a> <a href="https://im4change.org/upload/files/State%20wise%20average%20daily%20nominal%20wage%20rates%20in%20rural%20india%20men%20construction%20workers.JPG">for male construction workers in rural India</a> during the period from 2014-15 to 2020-21 was detected in Kerala <em>(Rs. 810.3)</em>, followed by Jammu and Kashmir <em>(Rs. 445.1)</em>, Tamil Nadu <em>(Rs. 424.1)</em>, Haryana <em>(Rs. 379.9)</em>, Himachal Pradesh <em>(Rs. 368.7)</em>, Rajasthan <em>(Rs. 347.7)</em>, and Punjab <em>(Rs. 339.1)</em>. Kindly see chart-1.&nbsp;</p>
<p style="text-align:justify">The <a href="https://im4change.org/upload/files/State%20wise%20average%20daily%20nominal%20wage%20rates%20in%20rural%20india%20men%20construction%20workers.JPG">lowest average daily nominal wage rates</a> <a href="https://im4change.org/upload/files/State%20wise%20average%20daily%20nominal%20wage%20rates%20in%20rural%20india%20men%20construction%20workers.JPG">for male construction workers in rural areas</a> during the period from 2014-15 to 2020-21 was found in Madhya Pradesh <em>(Rs. 212.4)</em>, followed by Tripura <em>(Rs. 230.4)</em>, Meghalaya <em>(Rs. 231.7)</em>, Odisha <em>(Rs. 247.1)</em>, Gujarat <em>(Rs. 251.8)</em>, Uttar Pradesh <em>(Rs. 267.4)</em>, Bihar <em>(Rs. 270.8)</em>, and West Bengal <em>(Rs. 274.0)</em>. The related national level figure was Rs. 316.9 during the period from 2014-15 to 2020-21. Kindly consult chart-1.</p>
<p style="text-align:justify">The <a href="https://im4change.org/upload/files/State%20wise%20growth%20in%20average%20daily%20nominal%20wage%20rates%20in%20rural%20india%20men%20construction%20workers.JPG">highest average annual growth rates in</a> <a href="https://im4change.org/upload/files/State%20wise%20growth%20in%20average%20daily%20nominal%20wage%20rates%20in%20rural%20india%20men%20construction%20workers.JPG">nominal wage rates</a> during the period from 2015-16 to 2020-21 was noticed in Meghalaya <em>(20.9 percent)</em>, followed by Madhya Pradesh <em>(7.4 percent)</em>, Odisha and Andhra Pradesh <em>(6.8 percent each)</em>, Uttar Pradesh <em>(6.4 percent)</em>, and Bihar <em>(6.2 percent)</em>. Please see chart-2.&nbsp;</p>
<p style="text-align:justify">The <a href="https://im4change.org/upload/files/State%20wise%20growth%20in%20average%20daily%20nominal%20wage%20rates%20in%20rural%20india%20men%20construction%20workers.JPG">lowest average annual growth rates in</a> <a href="https://im4change.org/upload/files/State%20wise%20growth%20in%20average%20daily%20nominal%20wage%20rates%20in%20rural%20india%20men%20construction%20workers.JPG">nominal wage rates</a> during the same period was observed in Kerala <em>(0.9 percent)</em>, followed by Manipur <em>(2.0 percent)</em>, Haryana <em>(2.1 percent)</em>, Jammu and Kashmir <em>(3.0 percent)</em>, Rajasthan <em>(3.2 percent)</em>, and Gujarat <em>(3.6 percent)</em>. Please see chart-2.</p>
<p style="text-align:justify">The <a href="https://im4change.org/upload/files/State%20wise%20growth%20in%20average%20daily%20wage%20rates%20in%20real%20terms%20for%20male%20construction%20workers%20in%20rural%20India%281%29.JPG">average annual growth of construction workers&rsquo;</a> <a href="https://im4change.org/upload/files/State%20wise%20growth%20in%20average%20daily%20wage%20rates%20in%20real%20terms%20for%20male%20construction%20workers%20in%20rural%20India%281%29.JPG">wage rates in real terms</a> during the period from 2015-16 to 2020-21 was negative in Assam <em>(-1.2 percent)</em>, Haryana <em>(-2.1 percent)</em>, Jammu and Kashmir <em>(-2.7 percent)</em>, Karnataka <em>(-0.6 percent)</em>, Kerala <em>(-4.4 percent)</em>, Manipur <em>(-6.3 percent)</em>, Rajasthan <em>(-1.2 percent)</em>, Tamil Nadu <em>(-0.9 percent)</em>, and Tripura <em>(-1.1 percent)</em>. Please note that the <a href="https://im4change.org/upload/files/State-wise%20Average%20Inflation%20CPI%20-%20Inflation.PDF">rate of inflation</a> in <a href="https://im4change.org/upload/files/State-wise%20Average%20Inflation%20CPI%20-%20Inflation.PDF">CPI-General</a> has been used to get the average annual growth of construction workers&rsquo; wage rates in real terms. Kindly have a look at table-1. &nbsp;&nbsp;</p>
<p style="text-align:justify">In the case of Meghalaya, the <a href="https://im4change.org/upload/files/State%20wise%20average%20daily%20nominal%20wage%20rates%20in%20rural%20india%20men%20construction%20workers.JPG">nominal daily wage rate of male construction</a> <a href="https://im4change.org/upload/files/State%20wise%20average%20daily%20nominal%20wage%20rates%20in%20rural%20india%20men%20construction%20workers.JPG">workers</a> fell from Rs. 186.0 in 2016-17 to Rs. 100.0 in 2017-18 i.e., a decline&nbsp;by -46.2 percent over previous year. However, the same bounced back to Rs. 273.2 in 2018-19 i.e., an increase by 173.2 percent over previous year. In <a href="https://im4change.org/upload/files/State%20wise%20growth%20in%20average%20daily%20wage%20rates%20in%20real%20terms%20for%20male%20construction%20workers%20in%20rural%20India%281%29.JPG">real terms, the construction sector</a> <a href="https://im4change.org/upload/files/State%20wise%20growth%20in%20average%20daily%20wage%20rates%20in%20real%20terms%20for%20male%20construction%20workers%20in%20rural%20India%281%29.JPG">wage rate in Meghalaya</a> grew by -47.7 percent in 2017-18 <em>(over previous year)</em> and 171.0 percent in 2018-19 <em>(over previous year)</em>.</p>
<p style="text-align:justify">Some states experienced negative <a href="https://im4change.org/upload/files/State%20wise%20growth%20in%20average%20daily%20wage%20rates%20in%20real%20terms%20for%20male%20construction%20workers%20in%20rural%20India%281%29.JPG">growth in construction workers&rsquo;</a> <a href="https://im4change.org/upload/files/State%20wise%20growth%20in%20average%20daily%20wage%20rates%20in%20real%20terms%20for%20male%20construction%20workers%20in%20rural%20India%281%29.JPG">wage rates in real terms</a> for more than two years between 2015-16 and 2020-21. For example, <a href="https://im4change.org/upload/files/State%20wise%20growth%20in%20average%20daily%20wage%20rates%20in%20real%20terms%20for%20male%20construction%20workers%20in%20rural%20India%281%29.JPG">Assam</a> experienced negative growth in wage rates <em>(in real terms)</em> during 2017-18, 2018-19, 2019-20, and 2020-21. &nbsp;</p>
<p style="text-align:justify">At the national level, the&nbsp;<a href="https://im4change.org/upload/files/State%20wise%20growth%20in%20average%20daily%20wage%20rates%20in%20real%20terms%20for%20male%20construction%20workers%20in%20rural%20India%281%29.JPG">construction workers&rsquo; wage rates in real terms</a> on average grew by just 0.1 percent annually during the period from 2015-16 to 2020-21.</p>
<p style="text-align:justify">Kindly <a href="https://docs.google.com/spreadsheets/d/1avu0-WtaKV2RHXtz2eiP7iS8znGVBdKC/edit?usp=sharing&amp;ouid=112233925171588304692&amp;rtpof=true&amp;sd=true">click here</a> to access the spreadsheet in order to look at the <a href="/upload/files/State%20wise%20average%20daily%20nominal%20wage%20rates%20in%20rural%20india%20men%20construction%20workers.JPG">trends in nominal wage rates</a>, <a href="/upload/files/State%20wise%20growth%20in%20average%20daily%20nominal%20wage%20rates%20in%20rural%20india%20men%20construction%20workers.JPG">annual growth in nominal wage rates</a>, and <a href="/upload/files/State%20wise%20growth%20in%20average%20daily%20wage%20rates%20in%20real%20terms%20for%20male%20construction%20workers%20in%20rural%20India%281%29.JPG">annual growth in real wage rates</a> for construction workers in rural areas.&nbsp;</p>
<p style="text-align:justify"><strong>Data collection methodology</strong></p>
<p style="text-align:justify">As a part of Rural Labour Enquiry, the&nbsp;<a href="https://im4change.org/upload/files/ilj_feb_2013.pdf">daily wage rates</a> in respect of eighteen agricultural and non-agricultural occupations are being collected along with rural retail price data by the Field Operations Division of the National Sample Survey Organisation since 1986-87, according to a February 2013 <a href="https://im4change.org/upload/files/ilj_feb_2013.pdf">edition of the Indian Labour Journal</a>.&nbsp;On the recommendations of the Governing Council of the National Sample Survey Organisation in its 61st meeting,&nbsp;the <a href="https://im4change.org/upload/files/ilj_feb_2013.pdf">Labour Bureau</a> started the compilation and analysis of wage rate data with effect from April, 1998.&nbsp;</p>
<p style="text-align:justify">The Field Operations Division of the National Sample Survey Organisation has been entrusted with the work of <a href="https://im4change.org/upload/files/METHOLOGY%20FOR%20COMPILATION%20OF%20THE%20WAGE%20RATE%20DATA.pdf">data collection</a>. The <a href="https://im4change.org/upload/files/METHOLOGY%20FOR%20COMPILATION%20OF%20THE%20WAGE%20RATE%20DATA.pdf">wage rate data</a> are being collected along with rural retail prices from 600 sample villages spread over 66 NSS regions of 20 States by canvassing Block-5 <em>(Annexure-I)</em> of Schedule 3.01(R). The data collection from these sample villages is staggered over the four weeks of a month with one-fourth of them being covered every week. The days of canvassing of Schedule 3.01(R) are fixed. The village functionaries like the Panchayat Secretary, Progress Assistant, Patwari and other Village or Block Officials are the primary informants for collection of data on wage rates. The data on normal working hours and the prevailing wage rates in cash and kind for the reported working hours are collected sex-wise for each of the 18 selected occupations in 20 states, indicates an old&nbsp;<a href="https://im4change.org/upload/files/METHOLOGY%20FOR%20COMPILATION%20OF%20THE%20WAGE%20RATE%20DATA.pdf">document</a> of the Labour Bureau. &nbsp;&nbsp;</p>
<p style="text-align:justify">The wage rates are sometimes reported for a duration that is less/more than the normal working hours. In such cases, they are <a href="https://im4change.org/upload/files/METHOLOGY%20FOR%20COMPILATION%20OF%20THE%20WAGE%20RATE%20DATA.pdf">first normalised for eight hours</a> working day. As regards the mode of payment of wages, it is made in both ways i.e., in cash and/or in kind. The payments made in kind are very common in rural areas, which include foodgrains, cooked food, tea, fuel, cigarette, beedi, fodder, etc.&nbsp;The wages reported in kind are evaluated at local retail prices. Thereafter, the data is thoroughly scrutinised and discrepant points are referred back to the field for clarification. In the next stage, the simple arithmetic average of these normalised daily wage rates is worked out occupation-wise and sex-wise for each state.</p>
<p style="text-align:justify"><a href="http://ras.org.in/methodology_of_data_collection_unsuited_to_changing_rural_reality">Up to June 2000</a>, the average wage rates at the national level were derived by taking the simple average of state figures; since July 2000, the averages have been obtained by dividing the sum total of wages of all 20 states by the number of centres or villages from which data were collected. The state-wise averages are restricted only to those occupations where the number of centres is five or more to avoid abnormal fluctuations and inconsistency in wages paid to different categories of workers on account of varying numbers of centres. However, in order to calculate the all-India averages, all neglected centres are taken into account to arrive at the total number of centres at the national level.</p>
<p style="text-align:justify">The <a href="/upload/files/RBI%20note%20Average%20Daily%20Wage%20rate%20Methodology.pdf">Reserve Bank of India</a>&nbsp;<em>(whose data we have used in writing this news alert)</em> has collated and is releasing monthly time series data on rural wage rates based on the data published by the Labour Bureau, Government of India. Starting from November 2013 the Labour Bureau is collecting the rural wage data in respect of 12 agricultural and 13 non-agricultural occupations across 20 major states, namely, Andhra Pradesh, Assam, Bihar, Gujarat, Haryana, Himachal Pradesh, Jammu &amp; Kashmir, Karnataka, Kerala, Madhya Pradesh, Maharashtra, Manipur, Meghalaya, Orissa, Punjab, Rajasthan, Tamil Nadu, Tripura, Uttar Pradesh and West Bengal. The occupations for which the daily wage rates are collected every month are: <u>(A) Agricultural occupations</u> &ndash; (1) &nbsp;Ploughing/ Tilling workers, (2) Sowing <em>(including planting/ Transplanting/ Weeding)</em> workers, (3) Harvesting/ Winnowing/ Threshing workers, (4) Picking workers <em>(including Tea, Cotton, Tobacco and other commercial crops)</em>, (5) Horticulture workers <em>(including nursery growers)</em>, (6) Fishermen-inland, (7) Fishermen coastal/deep-sea, (8) Loggers and wood cutters, (9) Animal husbandry workers <em>(including poultry workers, dairy workers and herdsman)</em>, (10) Packaging labourers, agriculture, (11) General agricultural labourers <em>(including watering/ irrigation workers, etc.)</em>, (12) Plant protection workers <em>(applying pesticides, treating seeds, etc.)</em>; and <u>(B) Non-agricultural occupations</u> &ndash; (13) Carpenter, (14) Blacksmith, (15) Mason, (16) Weavers, (17) Beedi makers, (18) Bamboo, cane basket weavers, (19) Handicraft workers, (20) Plumbers, (21) Electrician, (22) Construction workers <em>(for roads, dams, industrial &amp; project construction work and Well diggers)</em>, (23) LMV &amp; Tractor drivers, (24) Non-agricultural labourers <em>(including porters, loaders)</em>, and (25) Sweeping/cleaning workers.&nbsp;</p>
<p style="text-align:justify"><strong><em>References&nbsp;</em></strong></p>
<p style="text-align:justify">Handbook of Statistics on Indian States 2020-21, released in November 2021, please <a href="https://m.rbi.org.in/scripts/AnnualPublications.aspx?head=Handbook%20of%20Statistics%20on%20Indian%20States">click here</a> to access</p>
<p style="text-align:justify">State-wise Average Daily Wage Rates in Rural India (Men - General Agricultural Labourers), RBI Handbook of Statistics on Indian States 2020-21, released in November 2021, please <a href="/upload/files/State-wise%20Average%20Daily%20Wage%20Rates%20in%20Rural%20India%20Men%20-%20General%20Agricultural%20Labourers.PDF">click here</a> to access&nbsp;</p>
<p style="text-align:justify">State-wise Average Daily Wage Rates in Rural India (Men - Non-Agricultural Labourers), RBI Handbook of Statistics on Indian States 2020-21, released in November 2021, please <a href="/upload/files/State-wise%20Average%20Daily%20Wage%20Rates%20in%20Rural%20India%20Men%20-%20Non%20Agricultural%20Labourers.PDF">click here</a> to access&nbsp;</p>
<p style="text-align:justify">State-wise Average Daily Wage Rates in Rural India (Men - Construction Workers), RBI Handbook of Statistics on Indian States 2020-21, released in November 2021, please <a href="/upload/files/State-wise%20Average%20Daily%20Wage%20Rates%20in%20Rural%20India%20Men%20-%20Construction%20Workers.PDF">click here</a> to access&nbsp;</p>
<p style="text-align:justify">State-wise Average Inflation (CPI) - Inflation, RBI Handbook of Statistics on Indian States 2020-21, released in November 2021, please <a href="/upload/files/State-wise%20Average%20Inflation%20CPI%20-%20Inflation.PDF">click here</a> to access&nbsp;</p>
<p style="text-align:justify">Indian Labour Journal, February 2013, please <a href="/upload/files/ilj_feb_2013.pdf">click here</a> to access &nbsp;</p>
<p style="text-align:justify">Wage Rates in Rural India 2003-04: Methodology for Compilation of the Wage Rate Data, Labour Bureau, please <a href="/upload/files/METHOLOGY%20FOR%20COMPILATION%20OF%20THE%20WAGE%20RATE%20DATA.pdf">click here</a> to access&nbsp; &nbsp;&nbsp;</p>
<p style="text-align:justify">Average Daily Wage Rates in Rural India: Methodology and coverage (From November 2013), Reserve Bank of India, please <a href="https://dbie.rbi.org.in">click here</a>&nbsp;and <a href="/upload/files/RBI%20note%20Average%20Daily%20Wage%20rate%20Methodology%281%29.pdf">here</a> to access&nbsp;</p>
<p style="text-align:justify">Consumer Price Index Numbers on Base 2012=100 for Rural, Urban and Combined for the month of January 2022, Ministry of Statistics and Programme Implementation (MoSPI), National Statistical Office (NSO), released on 14th February 2022, please <a href="/upload/files/CPI%20Press%20Release%20January%202022%281%29.pdf">click here</a> to access&nbsp;</p>
<p style="text-align:justify">Methodology of Data Collection Unsuited to Changing Rural Reality: A Study of Agricultural Wage Data in India -Yoshifumi Usami, Arindam Das, and Madhura Swaminathan, Review of Agrarian Studies, Vol. 10, No. 2, July-December, 2020, please <a href="http://ras.org.in/methodology_of_data_collection_unsuited_to_changing_rural_reality">click here</a> to access</p>
<p>Russia-ukraine crisis to push up fertiliser prices, govt subsidies, IANS/ Business Standard, 4 March, 2022, please <a href="https://www.business-standard.com/article/economy-policy/russia-ukraine-crisis-to-push-up-fertiliser-prices-govt-subsidies-122030400560_1.html">click here</a> to access &nbsp;</p>
<p>Cooking oil prices spike in India due to Russia-ukraine crisis -B Krishna Mohan, TelanganaToday.com, 3 March, 2022, please <a href="https://telanganatoday.com/cooking-oil-prices-spike-in-india-due-to-russia-ukraine-crisis">click here</a> to access &nbsp;</p>
<p>Govt reviews cooking oil imports as ukraine crisis disrupts supplies, prices shoot up -Amiti Sen and Prabhudutta Mishra, The Hindu Business Line, 4 March, 2022, please <a href="https://www.thehindubusinessline.com/markets/commodities/govt-reviews-cooking-oil-imports-as-ukraine-crisis-disrupts-supplies-prices-shoot-up/article65190879.ece">click here</a> to access &nbsp;</p>
<p>India&#39;s Economy Faces A Potential Stagflation Risk From Ukraine War -Sunil Prabhu, NDTV.com, 1 March, 2022, please <a href="https://www.ndtv.com/business/indias-economy-faces-a-potential-stagflation-risk-from-ukraine-war-2796624">click here</a> to access</p>
<p>India to be one of Asia&rsquo;s &lsquo;biggest losers&rsquo; from the Ukraine war as Russia slammed by global sanctions -Paran Balakrishnan, The Telegraph, 1 March, 2022, please <a href="https://www.telegraphindia.com/business/russia-ukraine-crisis-india-to-be-one-of-asias-biggest-losers-from-the-ukraine-war-as-russia-slammed-by-global-sanctions/cid/1854032">click here</a> to access</p>
<p>Crude Oil Prices Rise, Tracking Russia-Ukraine Conflict -Rahul Karunakar, NDTV.com <em>(with inputs from Agencies)</em>, 1 March, 2022, please <a href="https://www.ndtv.com/business/crude-oil-prices-rise-on-tuesday-tracking-russia-ukraine-conflict-2796187">click here</a> to access</p>
<p>Cooking Oil May Become Costlier Due to Russia-ukraine War. Know Why, News18.com, 27 February, 2022, please <a href="https://www.news18.com/news/business/markets/cooking-oil-may-become-costlier-due-to-russia-ukraine-war-know-why-4812740.html">click here</a> to access &nbsp;</p>
<p style="text-align:justify"><strong>Image Courtesy: Inclusive Media for Change/ Shambhu Ghatak</strong></p>
',
'credit_writer' => '',
'article_img' => 'Image construction worker 11 Mar 2022.jpg',
'article_img_thumb' => 'Image construction worker 11 Mar 2022.jpg',
'status' => (int) 1,
'show_on_home' => (int) 1,
'lang' => 'EN',
'category_id' => (int) 4,
'tag_keyword' => '',
'seo_url' => 'real-wage-rates-of-the-rural-workers-hardly-increased-during-the-past-6-years',
'meta_title' => '',
'meta_keywords' => '',
'meta_description' => '',
'noindex' => (int) 1,
'publish_date' => object(Cake\I18n\FrozenDate) {},
'most_visit_section_id' => null,
'article_big_img' => null,
'liveid' => null,
'created' => object(Cake\I18n\FrozenTime) {},
'modified' => object(Cake\I18n\FrozenTime) {},
'edate' => '',
'tags' => [
[maximum depth reached]
],
'category' => object(App\Model\Entity\Category) {},
'[new]' => false,
'[accessible]' => [
[maximum depth reached]
],
'[dirty]' => [[maximum depth reached]],
'[original]' => [[maximum depth reached]],
'[virtual]' => [[maximum depth reached]],
'[hasErrors]' => false,
'[errors]' => [[maximum depth reached]],
'[invalid]' => [[maximum depth reached]],
'[repository]' => 'Articles'
},
'articleid' => (int) 62349,
'metaTitle' => 'NEWS ALERTS | Real wage rates of the rural workers hardly increased during the last 6 years',
'metaKeywords' => 'Construction Workers,Consumer Price Index,CPI Rural,CPI Urban,Farm Labourers,Farm Workers,Food Inflation,Food Prices,Fuel Inflation,Fuel Prices,Nominal Wage Rate,Non-Farm Labourers,Non-Farm Workers,Real Wage Growth,Real Wages,Retail Inflation,Rural Workers',
'metaDesc' => 'In the absence of income or expenditure-based headcount ratio, the growth in the real wages (i.e., nominal wages adjusted against retail inflation) of the manual workers is considered to be a good proxy to assess the trends in poverty. This...',
'disp' => '<p style="text-align:justify">In the absence of income or expenditure-based headcount ratio, the growth in the real wages <em>(i.e., nominal wages adjusted against retail inflation)</em> of the manual workers is considered to be a good proxy to assess the trends in poverty. This is because the manual, unskilled/ semi-skilled labourers exist at the bottom of the pyramid or economic hierarchy, and most of them belong to the social categories Scheduled Castes (SCs) and Scheduled Tribes (STs). A positive growth in their real wages <em>(or real wage rates) </em>is anticipated to improve their purchasing power <em>(i.e., income or consumption expenditure)</em> and lift them out of the poverty trap. &nbsp;</p><p style="text-align:justify">Clearly, there exists inter-state differences in nominal wage rates, growth in nominal wage rates and growth in real wage rates, which we will see in this news alert.&nbsp;</p><p style="text-align:justify">Against the backdrop of the <a href="https://www.thehindubusinessline.com/markets/commodities/govt-reviews-cooking-oil-imports-as-ukraine-crisis-disrupts-supplies-prices-shoot-up/article65190879.ece" title="https://www.thehindubusinessline.com/markets/commodities/govt-reviews-cooking-oil-imports-as-ukraine-crisis-disrupts-supplies-prices-shoot-up/article65190879.ece">Russia-Ukraine conflict</a>, which is anticipated to cause both <a href="https://www.ndtv.com/business/indias-economy-faces-a-potential-stagflation-risk-from-ukraine-war-2796624" title="https://www.ndtv.com/business/indias-economy-faces-a-potential-stagflation-risk-from-ukraine-war-2796624">food and fuel retail inflation</a> in India in the coming times, it is even more important to look at the past trends in wage rate growth of the rural workers. It should be noted that the <a href="https://public.flourish.studio/visualisation/8706137" title="https://public.flourish.studio/visualisation/8706137">year-on-year inflation</a> in <a href="https://public.flourish.studio/visualisation/8706137" title="https://public.flourish.studio/visualisation/8706137">Consumer</a> <a href="https://public.flourish.studio/visualisation/8706137" title="https://public.flourish.studio/visualisation/8706137">Price Index Rural</a> exceeded the <a href="https://public.flourish.studio/visualisation/8706137" title="https://public.flourish.studio/visualisation/8706137">year-on-year inflation</a> in <a href="https://public.flourish.studio/visualisation/8706137" title="https://public.flourish.studio/visualisation/8706137">CPI Urban</a> during January 2022 at the national level. Even before the beginning of Russia-Ukraine conflict <em>(i.e., during January 2022)</em>, in rural areas, <a href="https://im4change.org/upload/files/CPI%20Press%20Release%20January%202022%281%29.pdf" title="https://im4change.org/upload/files/CPI%20Press%20Release%20January%202022%281%29.pdf">retail inflation rate of 20.6 percent</a> was noticed for &#39;oils and fats&#39;, aside from&nbsp;<a href="https://im4change.org/upload/files/CPI%20Press%20Release%20January%202022%281%29.pdf" title="https://im4change.org/upload/files/CPI%20Press%20Release%20January%202022%281%29.pdf">8.44 percent retail inflation for &#39;fuel and light&#39;</a>, <a href="https://im4change.org/upload/files/CPI%20Press%20Release%20January%202022%281%29.pdf" title="https://im4change.org/upload/files/CPI%20Press%20Release%20January%202022%281%29.pdf">8.27 percent</a> for &#39;transport and communication&#39;, and <a href="https://im4change.org/upload/files/CPI%20Press%20Release%20January%202022%281%29.pdf" title="https://im4change.org/upload/files/CPI%20Press%20Release%20January%202022%281%29.pdf">9.65 percent for &#39;clothing and footwear&#39;</a>.&nbsp; &nbsp;&nbsp;</p><p style="text-align:justify">At the national level, the average daily nominal wage rate&nbsp;for male construction workers in rural areas during the period from 2014-15 to 2020-21 was Rs. 316.9, which was greater than that of the male non-farm workers in rural areas. The average daily nominal wage rate&nbsp;for male non-agricultural labourers in rural areas during the period from 2014-15 to 2020-21 was Rs. 273.8, which exceeded the average daily nominal wage rates for male farm labourers in rural areas <em>(i.e., Rs. 265.1)</em>. However, in Andhra Pradesh, Haryana, Himachal Pradesh, Jammu and Kashmir,&nbsp;Karnataka, Kerala, Meghalaya, Punjab, and Tripura, the average daily nominal wage rates for male agricultural labourers in rural areas during the period from 2014-15 to 2020-21 exceeded the average daily nominal wage rates for male non-farm labourers in rural areas. Please see chart-1.</p><p style="text-align:justify"><img alt="" src="/upload/images/Chart%201.png" style="height:670px; width:1000px" /></p><p style="text-align:justify"><em><strong>Notes:</strong> The average (i.e., arithmetic mean) daily nominal wage rates for various categories of workers in rural India in the period from 2014-15 to 2020-21 has been calculated by the Inclusive Media for Change staff</em></p><p style="text-align:justify"><em>Please <a href="https://docs.google.com/spreadsheets/d/1avu0-WtaKV2RHXtz2eiP7iS8znGVBdKC/edit?usp=sharing&amp;ouid=112233925171588304692&amp;rtpof=true&amp;sd=true" title="https://docs.google.com/spreadsheets/d/1avu0-WtaKV2RHXtz2eiP7iS8znGVBdKC/edit?usp=sharing&amp;ouid=112233925171588304692&amp;rtpof=true&amp;sd=true">click here</a> to access the data in spreadsheet format</em></p><p style="text-align:justify"><em><strong>Source:&nbsp;</strong>Handbook of Statistics on Indian States 2020-21, released in November 2021, please <a href="https://m.rbi.org.in/scripts/AnnualPublications.aspx?head=Handbook%20of%20Statistics%20on%20Indian%20States" title="https://m.rbi.org.in/scripts/AnnualPublications.aspx?head=Handbook%20of%20Statistics%20on%20Indian%20States">click here</a> to access</em></p><p style="text-align:justify"><em>State-wise Average Daily Wage Rates in Rural India (Men - General Agricultural Labourers), RBI Handbook of Statistics on Indian States 2020-21, released in November 2021, please <a href="/upload/files/State-wise%20Average%20Daily%20Wage%20Rates%20in%20Rural%20India%20Men%20-%20General%20Agricultural%20Labourers.PDF" title="/upload/files/State-wise%20Average%20Daily%20Wage%20Rates%20in%20Rural%20India%20Men%20-%20General%20Agricultural%20Labourers.PDF">click here</a> to access&nbsp;</em></p><p style="text-align:justify"><em>State-wise Average Daily Wage Rates in Rural India (Men - Non-Agricultural Labourers), RBI Handbook of Statistics on Indian States 2020-21, released in November 2021, please <a href="/upload/files/State-wise%20Average%20Daily%20Wage%20Rates%20in%20Rural%20India%20Men%20-%20Non%20Agricultural%20Labourers.PDF" title="/upload/files/State-wise%20Average%20Daily%20Wage%20Rates%20in%20Rural%20India%20Men%20-%20Non%20Agricultural%20Labourers.PDF">click here</a> to access&nbsp;</em></p><p style="text-align:justify"><em>State-wise Average Daily Wage Rates in Rural India (Men - Construction Workers), RBI Handbook of Statistics on Indian States 2020-21, released in November 2021, please <a href="/upload/files/State-wise%20Average%20Daily%20Wage%20Rates%20in%20Rural%20India%20Men%20-%20Construction%20Workers.PDF" title="/upload/files/State-wise%20Average%20Daily%20Wage%20Rates%20in%20Rural%20India%20Men%20-%20Construction%20Workers.PDF">click here</a> to access&nbsp;</em></p><p style="text-align:justify"><em>State-wise Average Inflation (CPI) - Inflation, RBI Handbook of Statistics on Indian States 2020-21, released in November 2021, please <a href="/upload/files/State-wise%20Average%20Inflation%20CPI%20-%20Inflation.PDF" title="/upload/files/State-wise%20Average%20Inflation%20CPI%20-%20Inflation.PDF">click here</a> to access&nbsp;</em></p><p style="text-align:justify"><strong>---</strong></p><p style="text-align:justify">At the national level, the agricultural nominal wage rate&nbsp;grew faster than the non-farm wage&nbsp;rate&nbsp;on average for male labourers in rural areas during the period from 2015-16 to 2020-21. However, in states like Assam, Bihar, Haryana, Madhya Pradesh, Odisha, Punjab, and West Bengal, the non-farm nominal wage rates grew faster than the farm wage rates on average for male workers in rural areas during the period from 2015-16 to 2020-21. Please see chart-2.&nbsp;</p><p style="text-align:justify"><img alt="" src="/upload/images/Chart%202.png" style="height:653px; width:1000px" /></p><p style="text-align:justify"><em><strong>Notes: </strong>The average growth in daily nominal wage rates for various categories of workers in rural India in the period from 2015-16 to 2020-21 has been calculated by the Inclusive Media for Change staff</em></p><p style="text-align:justify"><em>Please <a href="https://docs.google.com/spreadsheets/d/1avu0-WtaKV2RHXtz2eiP7iS8znGVBdKC/edit?usp=sharing&amp;ouid=112233925171588304692&amp;rtpof=true&amp;sd=true" title="https://docs.google.com/spreadsheets/d/1avu0-WtaKV2RHXtz2eiP7iS8znGVBdKC/edit?usp=sharing&amp;ouid=112233925171588304692&amp;rtpof=true&amp;sd=true">click here</a> to access the data in spreadsheet format</em></p><p style="text-align:justify"><em><strong>Source: </strong>Same as above</em><br /><strong>---</strong></p><p style="text-align:justify">At the national level, the construction sector nominal wage rate&nbsp;grew slower than the non-agricultural wage&nbsp;rate&nbsp;on average for male labourers in rural areas during the period from 2015-16 to 2020-21. However, in states like Andhra Pradesh, Bihar, Himachal Pradesh, Maharashtra, Meghalaya, Punjab,&nbsp;Tamil Nadu, and Uttar Pradesh, the construction sector nominal wage rates grew faster than the non-farm wage rates on average for male workers in rural areas during the period from 2015-16 to 2020-21. Please take a look at chart-2. &nbsp;</p><p style="text-align:justify">At the national level, the agricultural wage rate&nbsp;in real terms grew faster than the non-farm wage rate&nbsp;on average for male labourers in rural areas during the period from 2015-16 to 2020-21. However, in states like Assam, Bihar, Haryana, Madhya Pradesh, Odisha, Punjab, and West Bengal, the non-farm wage rates in real terms grew faster than the farm wage rates on average for male workers in rural areas during the period from 2015-16 to 2020-21. Please see table-1.</p><p style="text-align:justify"><strong>Table 1: State-wise Growth in Average Daily Wage Rates in Real terms for Male Agricultural Labourers, Male Non-Agricultural Labourers, and Male Construction Workers in Rural India, in %</strong><br /><img alt="" src="/upload/images/Table%201%20State-wise%20Growth%20in%20Average%20Daily%20Wage%20Rates%20in%20Real%20terms%20for%20Male%20Agricultural%20Labourers%20Male%20Non-Agricultural%20Labourers%20and%20Male%20Construction%20Workers%20in%20Rural%20India%20in%20percent.png" style="height:539px; width:750px" /></p><p style="text-align:justify"><em><strong>Notes: </strong>The average growth in daily wage rates in real terms for various categories of workers in rural India in the period from 2015-16 to 2020-21 has been calculated by the Inclusive Media for Change staff</em></p><p style="text-align:justify"><em>Please <a href="https://docs.google.com/spreadsheets/d/1avu0-WtaKV2RHXtz2eiP7iS8znGVBdKC/edit?usp=sharing&amp;ouid=112233925171588304692&amp;rtpof=true&amp;sd=true" title="https://docs.google.com/spreadsheets/d/1avu0-WtaKV2RHXtz2eiP7iS8znGVBdKC/edit?usp=sharing&amp;ouid=112233925171588304692&amp;rtpof=true&amp;sd=true">click here</a> to access the data in spreadsheet format</em></p><p style="text-align:justify"><em><strong>Source: </strong>Same as above</em><br /><strong>---</strong></p><p style="text-align:justify">At the national level, the construction sector wage rate&nbsp;in real terms grew slower than the non-agricultural wage rate&nbsp;on average for male labourers in rural areas during the period from 2015-16 to 2020-21. However, in states like Andhra Pradesh, Bihar, Himachal Pradesh, Maharashtra, Meghalaya, Punjab, Tamil Nadu, and Uttar Pradesh, the construction sector wage rates in real terms grew faster than the non-farm wage rates on average for male workers in rural areas during the period from 2015-16 to 2020-21. Please take a look at table-1. &nbsp;</p><p style="text-align:justify">In the following paragraphs, we have discussed the trends in agricultural wage rates, non-farm wage rates, and construction sector wage rates <em>(in rural areas)</em> in detail.&nbsp;</p><p style="text-align:justify"><strong>Agricultural wages in rural areas</strong></p><p style="text-align:justify">The highest <a href="https://im4change.org/upload/files/State%20wise%20average%20daily%20nominal%20wage%20rates%20in%20rural%20india%20men%20farm%20labourers.JPG" title="https://im4change.org/upload/files/State%20wise%20average%20daily%20nominal%20wage%20rates%20in%20rural%20india%20men%20farm%20labourers.JPG">average daily nominal wage rate</a> <a href="https://im4change.org/upload/files/State%20wise%20average%20daily%20nominal%20wage%20rates%20in%20rural%20india%20men%20farm%20labourers.JPG" title="https://im4change.org/upload/files/State%20wise%20average%20daily%20nominal%20wage%20rates%20in%20rural%20india%20men%20farm%20labourers.JPG">for male agricultural labourers</a> in rural India during the period from 2014-15 to 2020-21 was found in Kerala <em>(Rs. 653.93)</em>, followed by Jammu and Kashmir <em>(Rs. 429.19)</em>, Tamil Nadu <em>(Rs. 385.6)</em>, Haryana <em>(Rs. 368.53)</em>, Himachal Pradesh <em>(Rs. 366.23)</em>, and Punjab <em>(Rs. 325.31)</em>. Please have a look at chart-1.</p><p style="text-align:justify">The lowest <a href="https://im4change.org/upload/files/State%20wise%20average%20daily%20nominal%20wage%20rates%20in%20rural%20india%20men%20farm%20labourers.JPG" title="https://im4change.org/upload/files/State%20wise%20average%20daily%20nominal%20wage%20rates%20in%20rural%20india%20men%20farm%20labourers.JPG">average daily nominal wage rate</a> <a href="https://im4change.org/upload/files/State%20wise%20average%20daily%20nominal%20wage%20rates%20in%20rural%20india%20men%20farm%20labourers.JPG" title="https://im4change.org/upload/files/State%20wise%20average%20daily%20nominal%20wage%20rates%20in%20rural%20india%20men%20farm%20labourers.JPG">for male agricultural labourers</a> in rural India during the period from 2014-15 to 2020-21 was observed in Madhya Pradesh <em>(Rs. 183.97)</em>, followed by Gujarat <em>(Rs. 190.07)</em>, Maharashtra <em>(Rs. 215.71)</em>, Odisha <em>(Rs. 216.87)</em>, Meghalaya <em>(Rs. 219.93)</em>, Bihar <em>(Rs. 230.43)</em>, Uttar Pradesh <em>(Rs. 230.5)</em>, and Assam <em>(Rs. 237.3)</em>. The related national level figure was Rs. 265.09 during the period from 2014-15 to 2020-21. Please consult chart-1.&nbsp;</p><p style="text-align:justify">The highest <a href="https://im4change.org/upload/files/State%20wise%20growth%20in%20average%20daily%20nominal%20wage%20rates%20in%20rural%20india%20men%20farm%20labourers.JPG" title="https://im4change.org/upload/files/State%20wise%20growth%20in%20average%20daily%20nominal%20wage%20rates%20in%20rural%20india%20men%20farm%20labourers.JPG">average annual growth rate in</a> <a href="https://im4change.org/upload/files/State%20wise%20growth%20in%20average%20daily%20nominal%20wage%20rates%20in%20rural%20india%20men%20farm%20labourers.JPG" title="https://im4change.org/upload/files/State%20wise%20growth%20in%20average%20daily%20nominal%20wage%20rates%20in%20rural%20india%20men%20farm%20labourers.JPG">nominal wage rates</a> during the period from 2015-16 to 2020-21 was found in Karnataka <em>(7.3 percent)</em>, followed by Andhra Pradesh <em>(6.8 percent)</em>, Madhya Pradesh <em>(6.4 percent)</em>, Uttar Pradesh <em>(6.2 percent)</em>, Odisha <em>(6.1 percent)</em>, and Meghalaya <em>(6.0 percent)</em>. Please see chart-2.</p><p style="text-align:justify">The lowest <a href="https://im4change.org/upload/files/State%20wise%20growth%20in%20average%20daily%20nominal%20wage%20rates%20in%20rural%20india%20men%20farm%20labourers.JPG" title="https://im4change.org/upload/files/State%20wise%20growth%20in%20average%20daily%20nominal%20wage%20rates%20in%20rural%20india%20men%20farm%20labourers.JPG">average annual growth rate</a> <a href="https://im4change.org/upload/files/State%20wise%20growth%20in%20average%20daily%20nominal%20wage%20rates%20in%20rural%20india%20men%20farm%20labourers.JPG" title="https://im4change.org/upload/files/State%20wise%20growth%20in%20average%20daily%20nominal%20wage%20rates%20in%20rural%20india%20men%20farm%20labourers.JPG">in nominal wage rates</a> during the same period was noticed in Haryana <em>(2.1 percent)</em>, followed by Rajasthan <em>(3.3 percent)</em>, Kerala <em>(3.5 percent)</em>, Punjab <em>(3.9 percent)</em>, and Tamil Nadu <em>(4.5 percent)</em>. Please consult chart-2.</p><p style="text-align:justify">The average annual <a href="https://im4change.org/upload/files/State%20wise%20growth%20in%20average%20daily%20wage%20rates%20in%20real%20terms%20for%20male%20farm%20labourers%20in%20rural%20India.JPG" title="https://im4change.org/upload/files/State%20wise%20growth%20in%20average%20daily%20wage%20rates%20in%20real%20terms%20for%20male%20farm%20labourers%20in%20rural%20India.JPG">growth of agricultural labourers&rsquo;</a> <a href="https://im4change.org/upload/files/State%20wise%20growth%20in%20average%20daily%20wage%20rates%20in%20real%20terms%20for%20male%20farm%20labourers%20in%20rural%20India.JPG" title="https://im4change.org/upload/files/State%20wise%20growth%20in%20average%20daily%20wage%20rates%20in%20real%20terms%20for%20male%20farm%20labourers%20in%20rural%20India.JPG">wage rates in real terms</a> during the period from 2015-16 to 2020-21 were negative in Haryana <em>(-2.1 percent)</em>, Jammu and Kashmir <em>(-0.3 percent)</em>, Kerala <em>(-1.7 percent)</em>, Punjab <em>(-0.4 percent)</em>, Rajasthan <em>(-1.1 percent)</em>, Tamil Nadu <em>(-0.8 percent)</em>, Tripura <em>(-0.5 percent)</em>, and West Bengal <em>(-0.1 percent)</em>. It should be noted that the <a href="https://im4change.org/upload/files/State-wise%20Average%20Inflation%20CPI%20-%20Inflation.PDF" title="https://im4change.org/upload/files/State-wise%20Average%20Inflation%20CPI%20-%20Inflation.PDF">rate of inflation</a> in <a href="https://im4change.org/upload/files/State-wise%20Average%20Inflation%20CPI%20-%20Inflation.PDF" title="https://im4change.org/upload/files/State-wise%20Average%20Inflation%20CPI%20-%20Inflation.PDF">Consumer Price Index-General</a> has been used to get the average annual growth of agricultural labourers&rsquo; wage rates in real terms. Kindly consult table-1. &nbsp;</p><p style="text-align:justify">Some states witnessed negative <a href="https://im4change.org/upload/files/State%20wise%20growth%20in%20average%20daily%20wage%20rates%20in%20real%20terms%20for%20male%20farm%20labourers%20in%20rural%20India.JPG" title="https://im4change.org/upload/files/State%20wise%20growth%20in%20average%20daily%20wage%20rates%20in%20real%20terms%20for%20male%20farm%20labourers%20in%20rural%20India.JPG">growth in agricultural labourers&rsquo;</a> <a href="https://im4change.org/upload/files/State%20wise%20growth%20in%20average%20daily%20wage%20rates%20in%20real%20terms%20for%20male%20farm%20labourers%20in%20rural%20India.JPG" title="https://im4change.org/upload/files/State%20wise%20growth%20in%20average%20daily%20wage%20rates%20in%20real%20terms%20for%20male%20farm%20labourers%20in%20rural%20India.JPG">wage rates in real terms</a> for more than two years between 2015-16 and 2020-21. For example, <a href="https://im4change.org/upload/files/State%20wise%20growth%20in%20average%20daily%20wage%20rates%20in%20real%20terms%20for%20male%20farm%20labourers%20in%20rural%20India.JPG" title="https://im4change.org/upload/files/State%20wise%20growth%20in%20average%20daily%20wage%20rates%20in%20real%20terms%20for%20male%20farm%20labourers%20in%20rural%20India.JPG">Haryana</a> experienced negative growth in 2015-16, 2016-17, 2017-18, 2019-20, and 2020-21. Likewise, <a href="https://im4change.org/upload/files/State%20wise%20growth%20in%20average%20daily%20wage%20rates%20in%20real%20terms%20for%20male%20farm%20labourers%20in%20rural%20India.JPG" title="https://im4change.org/upload/files/State%20wise%20growth%20in%20average%20daily%20wage%20rates%20in%20real%20terms%20for%20male%20farm%20labourers%20in%20rural%20India.JPG">Kerala</a> faced negative growth in 2017-18, 2018-19, 2019-20, and 2020-21. &nbsp;</p><p style="text-align:justify">At the national level, the <a href="https://im4change.org/upload/files/State%20wise%20growth%20in%20average%20daily%20wage%20rates%20in%20real%20terms%20for%20male%20farm%20labourers%20in%20rural%20India.JPG" title="https://im4change.org/upload/files/State%20wise%20growth%20in%20average%20daily%20wage%20rates%20in%20real%20terms%20for%20male%20farm%20labourers%20in%20rural%20India.JPG">agricultural labourers&rsquo;</a> <a href="https://im4change.org/upload/files/State%20wise%20growth%20in%20average%20daily%20wage%20rates%20in%20real%20terms%20for%20male%20farm%20labourers%20in%20rural%20India.JPG" title="https://im4change.org/upload/files/State%20wise%20growth%20in%20average%20daily%20wage%20rates%20in%20real%20terms%20for%20male%20farm%20labourers%20in%20rural%20India.JPG">wage rates in real terms</a> on average grew by 1.0 percent annually during the period from 2015-16 to 2020-21.</p><p style="text-align:justify">Please <a href="https://docs.google.com/spreadsheets/d/1avu0-WtaKV2RHXtz2eiP7iS8znGVBdKC/edit?usp=sharing&amp;ouid=112233925171588304692&amp;rtpof=true&amp;sd=true" title="https://docs.google.com/spreadsheets/d/1avu0-WtaKV2RHXtz2eiP7iS8znGVBdKC/edit?usp=sharing&amp;ouid=112233925171588304692&amp;rtpof=true&amp;sd=true">click here</a> to access the spreadsheet in order to look at the trends in <a href="/upload/files/State%20wise%20average%20daily%20nominal%20wage%20rates%20in%20rural%20india%20men%20farm%20labourers.JPG" title="/upload/files/State%20wise%20average%20daily%20nominal%20wage%20rates%20in%20rural%20india%20men%20farm%20labourers.JPG">nominal wage rates</a>, <a href="/upload/files/State%20wise%20growth%20in%20average%20daily%20nominal%20wage%20rates%20in%20rural%20india%20men%20farm%20labourers.JPG" title="/upload/files/State%20wise%20growth%20in%20average%20daily%20nominal%20wage%20rates%20in%20rural%20india%20men%20farm%20labourers.JPG">annual growth in nominal wage rates</a> and <a href="/upload/files/State%20wise%20growth%20in%20average%20daily%20wage%20rates%20in%20real%20terms%20for%20male%20farm%20labourers%20in%20rural%20India.JPG" title="/upload/files/State%20wise%20growth%20in%20average%20daily%20wage%20rates%20in%20real%20terms%20for%20male%20farm%20labourers%20in%20rural%20India.JPG">annual growth in real wage rates</a> for farm labourers in rural areas.&nbsp;</p><p style="text-align:justify"><strong>Non-agricultural wages in rural areas</strong></p><p style="text-align:justify">The rural economy is not just about farming any longer. That is why we have looked at the wage growth in the non-farm sector too.&nbsp;The highest <a href="https://im4change.org/upload/files/State%20wise%20average%20daily%20nominal%20wage%20rates%20in%20rural%20india%20men%20non%20farm%20labourers.JPG" title="https://im4change.org/upload/files/State%20wise%20average%20daily%20nominal%20wage%20rates%20in%20rural%20india%20men%20non%20farm%20labourers.JPG">average daily nominal wage rate for male</a> <a href="https://im4change.org/upload/files/State%20wise%20average%20daily%20nominal%20wage%20rates%20in%20rural%20india%20men%20non%20farm%20labourers.JPG" title="https://im4change.org/upload/files/State%20wise%20average%20daily%20nominal%20wage%20rates%20in%20rural%20india%20men%20non%20farm%20labourers.JPG">non-agricultural labourers</a> in rural India during the period from 2014-15 to 2020-21 was detected in Kerala <em>(Rs. 639.01)</em>, followed by Jammu and Kashmir <em>(Rs. 426.37)</em>, Tamil Nadu <em>(Rs. 405.77)</em>, Haryana <em>(Rs. 359.24)</em>, Himachal Pradesh <em>(Rs. 311.10)</em>, and Punjab <em>(Rs. 309.09)</em>. Please see chart-1.</p><p style="text-align:justify">The lowest average <a href="https://im4change.org/upload/files/State%20wise%20average%20daily%20nominal%20wage%20rates%20in%20rural%20india%20men%20non%20farm%20labourers.JPG" title="https://im4change.org/upload/files/State%20wise%20average%20daily%20nominal%20wage%20rates%20in%20rural%20india%20men%20non%20farm%20labourers.JPG">daily nominal wage rate for male</a> <a href="https://im4change.org/upload/files/State%20wise%20average%20daily%20nominal%20wage%20rates%20in%20rural%20india%20men%20non%20farm%20labourers.JPG" title="https://im4change.org/upload/files/State%20wise%20average%20daily%20nominal%20wage%20rates%20in%20rural%20india%20men%20non%20farm%20labourers.JPG">non-agricultural labourers in rural India</a> during the period from 2014-15 to 2020-21 was found in Madhya Pradesh <em>(Rs. 191.47)</em>, followed by Meghalaya <em>(Rs. 210.26)</em>, Gujarat <em>(Rs. 213.51)</em>, Odisha <em>(Rs. 218.06)</em>, Maharashtra <em>(Rs. 226.70)</em>, Tripura <em>(Rs. 230.36)</em>, Bihar <em>(Rs. 243.51)</em>, and Uttar Pradesh <em>(Rs. 243.97)</em>. The related national level figure was Rs. 273.79 during the period from 2014-15 to 2020-21. Please see chart-1.</p><p style="text-align:justify">The highest <a href="https://im4change.org/upload/files/State%20wise%20growth%20in%20average%20daily%20nominal%20wage%20rates%20in%20rural%20india%20men%20non%20farm%20labourers.JPG" title="https://im4change.org/upload/files/State%20wise%20growth%20in%20average%20daily%20nominal%20wage%20rates%20in%20rural%20india%20men%20non%20farm%20labourers.JPG">average annual growth rate in</a> <a href="https://im4change.org/upload/files/State%20wise%20growth%20in%20average%20daily%20nominal%20wage%20rates%20in%20rural%20india%20men%20non%20farm%20labourers.JPG" title="https://im4change.org/upload/files/State%20wise%20growth%20in%20average%20daily%20nominal%20wage%20rates%20in%20rural%20india%20men%20non%20farm%20labourers.JPG">nominal wage rates</a> during the period from 2015-16 to 2020-21 was noticed in Odisha <em>(8.0 percent)</em>, followed by Madhya Pradesh <em>(7.6 percent)</em>, Assam <em>(6.6 percent)</em>, West Bengal <em>(5.9 percent)</em>, Uttar Pradesh and Andhra Pradesh <em>(5.6 percent each)</em>, and Bihar <em>(5.5 percent)</em>. Kindly consult chart-2.</p><p style="text-align:justify">The lowest <a href="https://im4change.org/upload/files/State%20wise%20growth%20in%20average%20daily%20nominal%20wage%20rates%20in%20rural%20india%20men%20non%20farm%20labourers.JPG" title="https://im4change.org/upload/files/State%20wise%20growth%20in%20average%20daily%20nominal%20wage%20rates%20in%20rural%20india%20men%20non%20farm%20labourers.JPG">average annual growth rate</a> <a href="https://im4change.org/upload/files/State%20wise%20growth%20in%20average%20daily%20nominal%20wage%20rates%20in%20rural%20india%20men%20non%20farm%20labourers.JPG" title="https://im4change.org/upload/files/State%20wise%20growth%20in%20average%20daily%20nominal%20wage%20rates%20in%20rural%20india%20men%20non%20farm%20labourers.JPG">in nominal wage rates</a> during the same period was observed in Kerala <em>(1.8 percent)</em>, followed by Haryana <em>(2.4 percent)</em>, Meghalaya <em>(2.8 percent)</em>, Tamil Nadu and Rajasthan <em>(3.2 percent each)</em>, Tripura and Jammu and Kashmir <em>(4.0 percent each),</em> and Maharashtra and Punjab <em>(4.2 percent each)</em>. Kindly consult chart-2.&nbsp;</p><p style="text-align:justify">The average annual <a href="https://im4change.org/upload/files/State%20wise%20growth%20in%20average%20daily%20wage%20rates%20in%20real%20terms%20for%20male%20non%20farm%20labourers%20in%20rural%20India.JPG" title="https://im4change.org/upload/files/State%20wise%20growth%20in%20average%20daily%20wage%20rates%20in%20real%20terms%20for%20male%20non%20farm%20labourers%20in%20rural%20India.JPG">growth of non-agricultural labourers&rsquo;</a> <a href="https://im4change.org/upload/files/State%20wise%20growth%20in%20average%20daily%20wage%20rates%20in%20real%20terms%20for%20male%20non%20farm%20labourers%20in%20rural%20India.JPG" title="https://im4change.org/upload/files/State%20wise%20growth%20in%20average%20daily%20wage%20rates%20in%20real%20terms%20for%20male%20non%20farm%20labourers%20in%20rural%20India.JPG">wage rates in real terms</a> during the period from 2015-16 to 2020-21 were negative in Haryana <em>(-1.9 percent)</em>, Jammu and Kashmir <em>(-1.7 percent)</em>, Kerala <em>(-3.5 percent)</em>, Maharashtra <em>(-0.3 percent)</em>, Meghalaya <em>(-1.2 percent)</em>, Punjab <em>(-0.1 percent)</em>, Rajasthan <em>(-1.2 percent)</em>, Tamil Nadu <em>(-2.1 percent)</em>, and Tripura <em>(-1.1 percent)</em>. It should be noted that the <a href="https://im4change.org/upload/files/State-wise%20Average%20Inflation%20CPI%20-%20Inflation.PDF" title="https://im4change.org/upload/files/State-wise%20Average%20Inflation%20CPI%20-%20Inflation.PDF">rate of inflation</a> in <a href="https://im4change.org/upload/files/State-wise%20Average%20Inflation%20CPI%20-%20Inflation.PDF" title="https://im4change.org/upload/files/State-wise%20Average%20Inflation%20CPI%20-%20Inflation.PDF">CPI-General</a> has been used to get the average annual growth of non-agricultural labourers&rsquo; wage rates in real terms. Kindly have a look at table-1. &nbsp;&nbsp;</p><p style="text-align:justify">Some states experienced negative growth in <a href="https://im4change.org/upload/files/State%20wise%20growth%20in%20average%20daily%20wage%20rates%20in%20real%20terms%20for%20male%20non%20farm%20labourers%20in%20rural%20India.JPG" title="https://im4change.org/upload/files/State%20wise%20growth%20in%20average%20daily%20wage%20rates%20in%20real%20terms%20for%20male%20non%20farm%20labourers%20in%20rural%20India.JPG">non-agricultural labourers&rsquo; wage</a> <a href="https://im4change.org/upload/files/State%20wise%20growth%20in%20average%20daily%20wage%20rates%20in%20real%20terms%20for%20male%20non%20farm%20labourers%20in%20rural%20India.JPG" title="https://im4change.org/upload/files/State%20wise%20growth%20in%20average%20daily%20wage%20rates%20in%20real%20terms%20for%20male%20non%20farm%20labourers%20in%20rural%20India.JPG">rates in real terms</a> for more than two years between 2015-16 and 2020-21. For example, <a href="https://im4change.org/upload/files/State%20wise%20growth%20in%20average%20daily%20wage%20rates%20in%20real%20terms%20for%20male%20non%20farm%20labourers%20in%20rural%20India.JPG" title="https://im4change.org/upload/files/State%20wise%20growth%20in%20average%20daily%20wage%20rates%20in%20real%20terms%20for%20male%20non%20farm%20labourers%20in%20rural%20India.JPG">Haryana</a> experienced negative <a href="https://im4change.org/upload/files/State%20wise%20growth%20in%20average%20daily%20wage%20rates%20in%20real%20terms%20for%20male%20non%20farm%20labourers%20in%20rural%20India.JPG" title="https://im4change.org/upload/files/State%20wise%20growth%20in%20average%20daily%20wage%20rates%20in%20real%20terms%20for%20male%20non%20farm%20labourers%20in%20rural%20India.JPG">growth in wage rates</a> <a href="https://im4change.org/upload/files/State%20wise%20growth%20in%20average%20daily%20wage%20rates%20in%20real%20terms%20for%20male%20non%20farm%20labourers%20in%20rural%20India.JPG" title="https://im4change.org/upload/files/State%20wise%20growth%20in%20average%20daily%20wage%20rates%20in%20real%20terms%20for%20male%20non%20farm%20labourers%20in%20rural%20India.JPG">(in real terms)</a> during 2016-17, 2017-18, 2018-19, 2019-20, and 2020-21. Likewise, <a href="https://im4change.org/upload/files/State%20wise%20growth%20in%20average%20daily%20wage%20rates%20in%20real%20terms%20for%20male%20non%20farm%20labourers%20in%20rural%20India.JPG" title="https://im4change.org/upload/files/State%20wise%20growth%20in%20average%20daily%20wage%20rates%20in%20real%20terms%20for%20male%20non%20farm%20labourers%20in%20rural%20India.JPG">Kerala</a> faced negative growth rates in 2015-16, 2016-17, 2017-18, 2019-20, and 2020-21. &nbsp;</p><p style="text-align:justify">At the national level, the&nbsp;<a href="https://im4change.org/upload/files/State%20wise%20growth%20in%20average%20daily%20wage%20rates%20in%20real%20terms%20for%20male%20non%20farm%20labourers%20in%20rural%20India.JPG" title="https://im4change.org/upload/files/State%20wise%20growth%20in%20average%20daily%20wage%20rates%20in%20real%20terms%20for%20male%20non%20farm%20labourers%20in%20rural%20India.JPG">non-agricultural labourers&rsquo;</a> <a href="https://im4change.org/upload/files/State%20wise%20growth%20in%20average%20daily%20wage%20rates%20in%20real%20terms%20for%20male%20non%20farm%20labourers%20in%20rural%20India.JPG" title="https://im4change.org/upload/files/State%20wise%20growth%20in%20average%20daily%20wage%20rates%20in%20real%20terms%20for%20male%20non%20farm%20labourers%20in%20rural%20India.JPG">wage rates in real terms</a> on average grew by just 0.3 percent annually during the period from 2015-16 to 2020-21.&nbsp;</p><p style="text-align:justify">Please <a href="https://docs.google.com/spreadsheets/d/1avu0-WtaKV2RHXtz2eiP7iS8znGVBdKC/edit?usp=sharing&amp;ouid=112233925171588304692&amp;rtpof=true&amp;sd=true" title="https://docs.google.com/spreadsheets/d/1avu0-WtaKV2RHXtz2eiP7iS8znGVBdKC/edit?usp=sharing&amp;ouid=112233925171588304692&amp;rtpof=true&amp;sd=true">click here</a> to access the spreadsheet in order to look at the <a href="/upload/files/State%20wise%20average%20daily%20nominal%20wage%20rates%20in%20rural%20india%20men%20non%20farm%20labourers.JPG" title="/upload/files/State%20wise%20average%20daily%20nominal%20wage%20rates%20in%20rural%20india%20men%20non%20farm%20labourers.JPG">trends in nominal wage rates</a>, <a href="/upload/files/State%20wise%20growth%20in%20average%20daily%20nominal%20wage%20rates%20in%20rural%20india%20men%20non%20farm%20labourers.JPG" title="/upload/files/State%20wise%20growth%20in%20average%20daily%20nominal%20wage%20rates%20in%20rural%20india%20men%20non%20farm%20labourers.JPG">annual growth in nominal wage rates</a>, and <a href="/upload/files/State%20wise%20growth%20in%20average%20daily%20wage%20rates%20in%20real%20terms%20for%20male%20non%20farm%20labourers%20in%20rural%20India.JPG" title="/upload/files/State%20wise%20growth%20in%20average%20daily%20wage%20rates%20in%20real%20terms%20for%20male%20non%20farm%20labourers%20in%20rural%20India.JPG">annual growth in real wage rates</a> for non-farm labourers in rural areas.&nbsp;</p><p style="text-align:justify"><strong>Construction sector wages in rural areas</strong></p><p style="text-align:justify">The <a href="https://im4change.org/upload/files/State%20wise%20average%20daily%20nominal%20wage%20rates%20in%20rural%20india%20men%20construction%20workers.JPG" title="https://im4change.org/upload/files/State%20wise%20average%20daily%20nominal%20wage%20rates%20in%20rural%20india%20men%20construction%20workers.JPG">highest average daily nominal wage rates</a> <a href="https://im4change.org/upload/files/State%20wise%20average%20daily%20nominal%20wage%20rates%20in%20rural%20india%20men%20construction%20workers.JPG" title="https://im4change.org/upload/files/State%20wise%20average%20daily%20nominal%20wage%20rates%20in%20rural%20india%20men%20construction%20workers.JPG">for male construction workers in rural India</a> during the period from 2014-15 to 2020-21 was detected in Kerala <em>(Rs. 810.3)</em>, followed by Jammu and Kashmir <em>(Rs. 445.1)</em>, Tamil Nadu <em>(Rs. 424.1)</em>, Haryana <em>(Rs. 379.9)</em>, Himachal Pradesh <em>(Rs. 368.7)</em>, Rajasthan <em>(Rs. 347.7)</em>, and Punjab <em>(Rs. 339.1)</em>. Kindly see chart-1.&nbsp;</p><p style="text-align:justify">The <a href="https://im4change.org/upload/files/State%20wise%20average%20daily%20nominal%20wage%20rates%20in%20rural%20india%20men%20construction%20workers.JPG" title="https://im4change.org/upload/files/State%20wise%20average%20daily%20nominal%20wage%20rates%20in%20rural%20india%20men%20construction%20workers.JPG">lowest average daily nominal wage rates</a> <a href="https://im4change.org/upload/files/State%20wise%20average%20daily%20nominal%20wage%20rates%20in%20rural%20india%20men%20construction%20workers.JPG" title="https://im4change.org/upload/files/State%20wise%20average%20daily%20nominal%20wage%20rates%20in%20rural%20india%20men%20construction%20workers.JPG">for male construction workers in rural areas</a> during the period from 2014-15 to 2020-21 was found in Madhya Pradesh <em>(Rs. 212.4)</em>, followed by Tripura <em>(Rs. 230.4)</em>, Meghalaya <em>(Rs. 231.7)</em>, Odisha <em>(Rs. 247.1)</em>, Gujarat <em>(Rs. 251.8)</em>, Uttar Pradesh <em>(Rs. 267.4)</em>, Bihar <em>(Rs. 270.8)</em>, and West Bengal <em>(Rs. 274.0)</em>. The related national level figure was Rs. 316.9 during the period from 2014-15 to 2020-21. Kindly consult chart-1.</p><p style="text-align:justify">The <a href="https://im4change.org/upload/files/State%20wise%20growth%20in%20average%20daily%20nominal%20wage%20rates%20in%20rural%20india%20men%20construction%20workers.JPG" title="https://im4change.org/upload/files/State%20wise%20growth%20in%20average%20daily%20nominal%20wage%20rates%20in%20rural%20india%20men%20construction%20workers.JPG">highest average annual growth rates in</a> <a href="https://im4change.org/upload/files/State%20wise%20growth%20in%20average%20daily%20nominal%20wage%20rates%20in%20rural%20india%20men%20construction%20workers.JPG" title="https://im4change.org/upload/files/State%20wise%20growth%20in%20average%20daily%20nominal%20wage%20rates%20in%20rural%20india%20men%20construction%20workers.JPG">nominal wage rates</a> during the period from 2015-16 to 2020-21 was noticed in Meghalaya <em>(20.9 percent)</em>, followed by Madhya Pradesh <em>(7.4 percent)</em>, Odisha and Andhra Pradesh <em>(6.8 percent each)</em>, Uttar Pradesh <em>(6.4 percent)</em>, and Bihar <em>(6.2 percent)</em>. Please see chart-2.&nbsp;</p><p style="text-align:justify">The <a href="https://im4change.org/upload/files/State%20wise%20growth%20in%20average%20daily%20nominal%20wage%20rates%20in%20rural%20india%20men%20construction%20workers.JPG" title="https://im4change.org/upload/files/State%20wise%20growth%20in%20average%20daily%20nominal%20wage%20rates%20in%20rural%20india%20men%20construction%20workers.JPG">lowest average annual growth rates in</a> <a href="https://im4change.org/upload/files/State%20wise%20growth%20in%20average%20daily%20nominal%20wage%20rates%20in%20rural%20india%20men%20construction%20workers.JPG" title="https://im4change.org/upload/files/State%20wise%20growth%20in%20average%20daily%20nominal%20wage%20rates%20in%20rural%20india%20men%20construction%20workers.JPG">nominal wage rates</a> during the same period was observed in Kerala <em>(0.9 percent)</em>, followed by Manipur <em>(2.0 percent)</em>, Haryana <em>(2.1 percent)</em>, Jammu and Kashmir <em>(3.0 percent)</em>, Rajasthan <em>(3.2 percent)</em>, and Gujarat <em>(3.6 percent)</em>. Please see chart-2.</p><p style="text-align:justify">The <a href="https://im4change.org/upload/files/State%20wise%20growth%20in%20average%20daily%20wage%20rates%20in%20real%20terms%20for%20male%20construction%20workers%20in%20rural%20India%281%29.JPG" title="https://im4change.org/upload/files/State%20wise%20growth%20in%20average%20daily%20wage%20rates%20in%20real%20terms%20for%20male%20construction%20workers%20in%20rural%20India%281%29.JPG">average annual growth of construction workers&rsquo;</a> <a href="https://im4change.org/upload/files/State%20wise%20growth%20in%20average%20daily%20wage%20rates%20in%20real%20terms%20for%20male%20construction%20workers%20in%20rural%20India%281%29.JPG" title="https://im4change.org/upload/files/State%20wise%20growth%20in%20average%20daily%20wage%20rates%20in%20real%20terms%20for%20male%20construction%20workers%20in%20rural%20India%281%29.JPG">wage rates in real terms</a> during the period from 2015-16 to 2020-21 was negative in Assam <em>(-1.2 percent)</em>, Haryana <em>(-2.1 percent)</em>, Jammu and Kashmir <em>(-2.7 percent)</em>, Karnataka <em>(-0.6 percent)</em>, Kerala <em>(-4.4 percent)</em>, Manipur <em>(-6.3 percent)</em>, Rajasthan <em>(-1.2 percent)</em>, Tamil Nadu <em>(-0.9 percent)</em>, and Tripura <em>(-1.1 percent)</em>. Please note that the <a href="https://im4change.org/upload/files/State-wise%20Average%20Inflation%20CPI%20-%20Inflation.PDF" title="https://im4change.org/upload/files/State-wise%20Average%20Inflation%20CPI%20-%20Inflation.PDF">rate of inflation</a> in <a href="https://im4change.org/upload/files/State-wise%20Average%20Inflation%20CPI%20-%20Inflation.PDF" title="https://im4change.org/upload/files/State-wise%20Average%20Inflation%20CPI%20-%20Inflation.PDF">CPI-General</a> has been used to get the average annual growth of construction workers&rsquo; wage rates in real terms. Kindly have a look at table-1. &nbsp;&nbsp;</p><p style="text-align:justify">In the case of Meghalaya, the <a href="https://im4change.org/upload/files/State%20wise%20average%20daily%20nominal%20wage%20rates%20in%20rural%20india%20men%20construction%20workers.JPG" title="https://im4change.org/upload/files/State%20wise%20average%20daily%20nominal%20wage%20rates%20in%20rural%20india%20men%20construction%20workers.JPG">nominal daily wage rate of male construction</a> <a href="https://im4change.org/upload/files/State%20wise%20average%20daily%20nominal%20wage%20rates%20in%20rural%20india%20men%20construction%20workers.JPG" title="https://im4change.org/upload/files/State%20wise%20average%20daily%20nominal%20wage%20rates%20in%20rural%20india%20men%20construction%20workers.JPG">workers</a> fell from Rs. 186.0 in 2016-17 to Rs. 100.0 in 2017-18 i.e., a decline&nbsp;by -46.2 percent over previous year. However, the same bounced back to Rs. 273.2 in 2018-19 i.e., an increase by 173.2 percent over previous year. In <a href="https://im4change.org/upload/files/State%20wise%20growth%20in%20average%20daily%20wage%20rates%20in%20real%20terms%20for%20male%20construction%20workers%20in%20rural%20India%281%29.JPG" title="https://im4change.org/upload/files/State%20wise%20growth%20in%20average%20daily%20wage%20rates%20in%20real%20terms%20for%20male%20construction%20workers%20in%20rural%20India%281%29.JPG">real terms, the construction sector</a> <a href="https://im4change.org/upload/files/State%20wise%20growth%20in%20average%20daily%20wage%20rates%20in%20real%20terms%20for%20male%20construction%20workers%20in%20rural%20India%281%29.JPG" title="https://im4change.org/upload/files/State%20wise%20growth%20in%20average%20daily%20wage%20rates%20in%20real%20terms%20for%20male%20construction%20workers%20in%20rural%20India%281%29.JPG">wage rate in Meghalaya</a> grew by -47.7 percent in 2017-18 <em>(over previous year)</em> and 171.0 percent in 2018-19 <em>(over previous year)</em>.</p><p style="text-align:justify">Some states experienced negative <a href="https://im4change.org/upload/files/State%20wise%20growth%20in%20average%20daily%20wage%20rates%20in%20real%20terms%20for%20male%20construction%20workers%20in%20rural%20India%281%29.JPG" title="https://im4change.org/upload/files/State%20wise%20growth%20in%20average%20daily%20wage%20rates%20in%20real%20terms%20for%20male%20construction%20workers%20in%20rural%20India%281%29.JPG">growth in construction workers&rsquo;</a> <a href="https://im4change.org/upload/files/State%20wise%20growth%20in%20average%20daily%20wage%20rates%20in%20real%20terms%20for%20male%20construction%20workers%20in%20rural%20India%281%29.JPG" title="https://im4change.org/upload/files/State%20wise%20growth%20in%20average%20daily%20wage%20rates%20in%20real%20terms%20for%20male%20construction%20workers%20in%20rural%20India%281%29.JPG">wage rates in real terms</a> for more than two years between 2015-16 and 2020-21. For example, <a href="https://im4change.org/upload/files/State%20wise%20growth%20in%20average%20daily%20wage%20rates%20in%20real%20terms%20for%20male%20construction%20workers%20in%20rural%20India%281%29.JPG" title="https://im4change.org/upload/files/State%20wise%20growth%20in%20average%20daily%20wage%20rates%20in%20real%20terms%20for%20male%20construction%20workers%20in%20rural%20India%281%29.JPG">Assam</a> experienced negative growth in wage rates <em>(in real terms)</em> during 2017-18, 2018-19, 2019-20, and 2020-21. &nbsp;</p><p style="text-align:justify">At the national level, the&nbsp;<a href="https://im4change.org/upload/files/State%20wise%20growth%20in%20average%20daily%20wage%20rates%20in%20real%20terms%20for%20male%20construction%20workers%20in%20rural%20India%281%29.JPG" title="https://im4change.org/upload/files/State%20wise%20growth%20in%20average%20daily%20wage%20rates%20in%20real%20terms%20for%20male%20construction%20workers%20in%20rural%20India%281%29.JPG">construction workers&rsquo; wage rates in real terms</a> on average grew by just 0.1 percent annually during the period from 2015-16 to 2020-21.</p><p style="text-align:justify">Kindly <a href="https://docs.google.com/spreadsheets/d/1avu0-WtaKV2RHXtz2eiP7iS8znGVBdKC/edit?usp=sharing&amp;ouid=112233925171588304692&amp;rtpof=true&amp;sd=true" title="https://docs.google.com/spreadsheets/d/1avu0-WtaKV2RHXtz2eiP7iS8znGVBdKC/edit?usp=sharing&amp;ouid=112233925171588304692&amp;rtpof=true&amp;sd=true">click here</a> to access the spreadsheet in order to look at the <a href="/upload/files/State%20wise%20average%20daily%20nominal%20wage%20rates%20in%20rural%20india%20men%20construction%20workers.JPG" title="/upload/files/State%20wise%20average%20daily%20nominal%20wage%20rates%20in%20rural%20india%20men%20construction%20workers.JPG">trends in nominal wage rates</a>, <a href="/upload/files/State%20wise%20growth%20in%20average%20daily%20nominal%20wage%20rates%20in%20rural%20india%20men%20construction%20workers.JPG" title="/upload/files/State%20wise%20growth%20in%20average%20daily%20nominal%20wage%20rates%20in%20rural%20india%20men%20construction%20workers.JPG">annual growth in nominal wage rates</a>, and <a href="/upload/files/State%20wise%20growth%20in%20average%20daily%20wage%20rates%20in%20real%20terms%20for%20male%20construction%20workers%20in%20rural%20India%281%29.JPG" title="/upload/files/State%20wise%20growth%20in%20average%20daily%20wage%20rates%20in%20real%20terms%20for%20male%20construction%20workers%20in%20rural%20India%281%29.JPG">annual growth in real wage rates</a> for construction workers in rural areas.&nbsp;</p><p style="text-align:justify"><strong>Data collection methodology</strong></p><p style="text-align:justify">As a part of Rural Labour Enquiry, the&nbsp;<a href="https://im4change.org/upload/files/ilj_feb_2013.pdf" title="https://im4change.org/upload/files/ilj_feb_2013.pdf">daily wage rates</a> in respect of eighteen agricultural and non-agricultural occupations are being collected along with rural retail price data by the Field Operations Division of the National Sample Survey Organisation since 1986-87, according to a February 2013 <a href="https://im4change.org/upload/files/ilj_feb_2013.pdf" title="https://im4change.org/upload/files/ilj_feb_2013.pdf">edition of the Indian Labour Journal</a>.&nbsp;On the recommendations of the Governing Council of the National Sample Survey Organisation in its 61st meeting,&nbsp;the <a href="https://im4change.org/upload/files/ilj_feb_2013.pdf" title="https://im4change.org/upload/files/ilj_feb_2013.pdf">Labour Bureau</a> started the compilation and analysis of wage rate data with effect from April, 1998.&nbsp;</p><p style="text-align:justify">The Field Operations Division of the National Sample Survey Organisation has been entrusted with the work of <a href="https://im4change.org/upload/files/METHOLOGY%20FOR%20COMPILATION%20OF%20THE%20WAGE%20RATE%20DATA.pdf" title="https://im4change.org/upload/files/METHOLOGY%20FOR%20COMPILATION%20OF%20THE%20WAGE%20RATE%20DATA.pdf">data collection</a>. The <a href="https://im4change.org/upload/files/METHOLOGY%20FOR%20COMPILATION%20OF%20THE%20WAGE%20RATE%20DATA.pdf" title="https://im4change.org/upload/files/METHOLOGY%20FOR%20COMPILATION%20OF%20THE%20WAGE%20RATE%20DATA.pdf">wage rate data</a> are being collected along with rural retail prices from 600 sample villages spread over 66 NSS regions of 20 States by canvassing Block-5 <em>(Annexure-I)</em> of Schedule 3.01(R). The data collection from these sample villages is staggered over the four weeks of a month with one-fourth of them being covered every week. The days of canvassing of Schedule 3.01(R) are fixed. The village functionaries like the Panchayat Secretary, Progress Assistant, Patwari and other Village or Block Officials are the primary informants for collection of data on wage rates. The data on normal working hours and the prevailing wage rates in cash and kind for the reported working hours are collected sex-wise for each of the 18 selected occupations in 20 states, indicates an old&nbsp;<a href="https://im4change.org/upload/files/METHOLOGY%20FOR%20COMPILATION%20OF%20THE%20WAGE%20RATE%20DATA.pdf" title="https://im4change.org/upload/files/METHOLOGY%20FOR%20COMPILATION%20OF%20THE%20WAGE%20RATE%20DATA.pdf">document</a> of the Labour Bureau. &nbsp;&nbsp;</p><p style="text-align:justify">The wage rates are sometimes reported for a duration that is less/more than the normal working hours. In such cases, they are <a href="https://im4change.org/upload/files/METHOLOGY%20FOR%20COMPILATION%20OF%20THE%20WAGE%20RATE%20DATA.pdf" title="https://im4change.org/upload/files/METHOLOGY%20FOR%20COMPILATION%20OF%20THE%20WAGE%20RATE%20DATA.pdf">first normalised for eight hours</a> working day. As regards the mode of payment of wages, it is made in both ways i.e., in cash and/or in kind. The payments made in kind are very common in rural areas, which include foodgrains, cooked food, tea, fuel, cigarette, beedi, fodder, etc.&nbsp;The wages reported in kind are evaluated at local retail prices. Thereafter, the data is thoroughly scrutinised and discrepant points are referred back to the field for clarification. In the next stage, the simple arithmetic average of these normalised daily wage rates is worked out occupation-wise and sex-wise for each state.</p><p style="text-align:justify"><a href="http://ras.org.in/methodology_of_data_collection_unsuited_to_changing_rural_reality" title="http://ras.org.in/methodology_of_data_collection_unsuited_to_changing_rural_reality">Up to June 2000</a>, the average wage rates at the national level were derived by taking the simple average of state figures; since July 2000, the averages have been obtained by dividing the sum total of wages of all 20 states by the number of centres or villages from which data were collected. The state-wise averages are restricted only to those occupations where the number of centres is five or more to avoid abnormal fluctuations and inconsistency in wages paid to different categories of workers on account of varying numbers of centres. However, in order to calculate the all-India averages, all neglected centres are taken into account to arrive at the total number of centres at the national level.</p><p style="text-align:justify">The <a href="/upload/files/RBI%20note%20Average%20Daily%20Wage%20rate%20Methodology.pdf" title="/upload/files/RBI%20note%20Average%20Daily%20Wage%20rate%20Methodology.pdf">Reserve Bank of India</a>&nbsp;<em>(whose data we have used in writing this news alert)</em> has collated and is releasing monthly time series data on rural wage rates based on the data published by the Labour Bureau, Government of India. Starting from November 2013 the Labour Bureau is collecting the rural wage data in respect of 12 agricultural and 13 non-agricultural occupations across 20 major states, namely, Andhra Pradesh, Assam, Bihar, Gujarat, Haryana, Himachal Pradesh, Jammu &amp; Kashmir, Karnataka, Kerala, Madhya Pradesh, Maharashtra, Manipur, Meghalaya, Orissa, Punjab, Rajasthan, Tamil Nadu, Tripura, Uttar Pradesh and West Bengal. The occupations for which the daily wage rates are collected every month are: <u>(A) Agricultural occupations</u> &ndash; (1) &nbsp;Ploughing/ Tilling workers, (2) Sowing <em>(including planting/ Transplanting/ Weeding)</em> workers, (3) Harvesting/ Winnowing/ Threshing workers, (4) Picking workers <em>(including Tea, Cotton, Tobacco and other commercial crops)</em>, (5) Horticulture workers <em>(including nursery growers)</em>, (6) Fishermen-inland, (7) Fishermen coastal/deep-sea, (8) Loggers and wood cutters, (9) Animal husbandry workers <em>(including poultry workers, dairy workers and herdsman)</em>, (10) Packaging labourers, agriculture, (11) General agricultural labourers <em>(including watering/ irrigation workers, etc.)</em>, (12) Plant protection workers <em>(applying pesticides, treating seeds, etc.)</em>; and <u>(B) Non-agricultural occupations</u> &ndash; (13) Carpenter, (14) Blacksmith, (15) Mason, (16) Weavers, (17) Beedi makers, (18) Bamboo, cane basket weavers, (19) Handicraft workers, (20) Plumbers, (21) Electrician, (22) Construction workers <em>(for roads, dams, industrial &amp; project construction work and Well diggers)</em>, (23) LMV &amp; Tractor drivers, (24) Non-agricultural labourers <em>(including porters, loaders)</em>, and (25) Sweeping/cleaning workers.&nbsp;</p><p style="text-align:justify"><strong><em>References&nbsp;</em></strong></p><p style="text-align:justify">Handbook of Statistics on Indian States 2020-21, released in November 2021, please <a href="https://m.rbi.org.in/scripts/AnnualPublications.aspx?head=Handbook%20of%20Statistics%20on%20Indian%20States" title="https://m.rbi.org.in/scripts/AnnualPublications.aspx?head=Handbook%20of%20Statistics%20on%20Indian%20States">click here</a> to access</p><p style="text-align:justify">State-wise Average Daily Wage Rates in Rural India (Men - General Agricultural Labourers), RBI Handbook of Statistics on Indian States 2020-21, released in November 2021, please <a href="/upload/files/State-wise%20Average%20Daily%20Wage%20Rates%20in%20Rural%20India%20Men%20-%20General%20Agricultural%20Labourers.PDF" title="/upload/files/State-wise%20Average%20Daily%20Wage%20Rates%20in%20Rural%20India%20Men%20-%20General%20Agricultural%20Labourers.PDF">click here</a> to access&nbsp;</p><p style="text-align:justify">State-wise Average Daily Wage Rates in Rural India (Men - Non-Agricultural Labourers), RBI Handbook of Statistics on Indian States 2020-21, released in November 2021, please <a href="/upload/files/State-wise%20Average%20Daily%20Wage%20Rates%20in%20Rural%20India%20Men%20-%20Non%20Agricultural%20Labourers.PDF" title="/upload/files/State-wise%20Average%20Daily%20Wage%20Rates%20in%20Rural%20India%20Men%20-%20Non%20Agricultural%20Labourers.PDF">click here</a> to access&nbsp;</p><p style="text-align:justify">State-wise Average Daily Wage Rates in Rural India (Men - Construction Workers), RBI Handbook of Statistics on Indian States 2020-21, released in November 2021, please <a href="/upload/files/State-wise%20Average%20Daily%20Wage%20Rates%20in%20Rural%20India%20Men%20-%20Construction%20Workers.PDF" title="/upload/files/State-wise%20Average%20Daily%20Wage%20Rates%20in%20Rural%20India%20Men%20-%20Construction%20Workers.PDF">click here</a> to access&nbsp;</p><p style="text-align:justify">State-wise Average Inflation (CPI) - Inflation, RBI Handbook of Statistics on Indian States 2020-21, released in November 2021, please <a href="/upload/files/State-wise%20Average%20Inflation%20CPI%20-%20Inflation.PDF" title="/upload/files/State-wise%20Average%20Inflation%20CPI%20-%20Inflation.PDF">click here</a> to access&nbsp;</p><p style="text-align:justify">Indian Labour Journal, February 2013, please <a href="/upload/files/ilj_feb_2013.pdf" title="/upload/files/ilj_feb_2013.pdf">click here</a> to access &nbsp;</p><p style="text-align:justify">Wage Rates in Rural India 2003-04: Methodology for Compilation of the Wage Rate Data, Labour Bureau, please <a href="/upload/files/METHOLOGY%20FOR%20COMPILATION%20OF%20THE%20WAGE%20RATE%20DATA.pdf" title="/upload/files/METHOLOGY%20FOR%20COMPILATION%20OF%20THE%20WAGE%20RATE%20DATA.pdf">click here</a> to access&nbsp; &nbsp;&nbsp;</p><p style="text-align:justify">Average Daily Wage Rates in Rural India: Methodology and coverage (From November 2013), Reserve Bank of India, please <a href="https://dbie.rbi.org.in" title="https://dbie.rbi.org.in">click here</a>&nbsp;and <a href="/upload/files/RBI%20note%20Average%20Daily%20Wage%20rate%20Methodology%281%29.pdf" title="/upload/files/RBI%20note%20Average%20Daily%20Wage%20rate%20Methodology%281%29.pdf">here</a> to access&nbsp;</p><p style="text-align:justify">Consumer Price Index Numbers on Base 2012=100 for Rural, Urban and Combined for the month of January 2022, Ministry of Statistics and Programme Implementation (MoSPI), National Statistical Office (NSO), released on 14th February 2022, please <a href="/upload/files/CPI%20Press%20Release%20January%202022%281%29.pdf" title="/upload/files/CPI%20Press%20Release%20January%202022%281%29.pdf">click here</a> to access&nbsp;</p><p style="text-align:justify">Methodology of Data Collection Unsuited to Changing Rural Reality: A Study of Agricultural Wage Data in India -Yoshifumi Usami, Arindam Das, and Madhura Swaminathan, Review of Agrarian Studies, Vol. 10, No. 2, July-December, 2020, please <a href="http://ras.org.in/methodology_of_data_collection_unsuited_to_changing_rural_reality" title="http://ras.org.in/methodology_of_data_collection_unsuited_to_changing_rural_reality">click here</a> to access</p><p>Russia-ukraine crisis to push up fertiliser prices, govt subsidies, IANS/ Business Standard, 4 March, 2022, please <a href="https://www.business-standard.com/article/economy-policy/russia-ukraine-crisis-to-push-up-fertiliser-prices-govt-subsidies-122030400560_1.html" title="https://www.business-standard.com/article/economy-policy/russia-ukraine-crisis-to-push-up-fertiliser-prices-govt-subsidies-122030400560_1.html">click here</a> to access &nbsp;</p><p>Cooking oil prices spike in India due to Russia-ukraine crisis -B Krishna Mohan, TelanganaToday.com, 3 March, 2022, please <a href="https://telanganatoday.com/cooking-oil-prices-spike-in-india-due-to-russia-ukraine-crisis" title="https://telanganatoday.com/cooking-oil-prices-spike-in-india-due-to-russia-ukraine-crisis">click here</a> to access &nbsp;</p><p>Govt reviews cooking oil imports as ukraine crisis disrupts supplies, prices shoot up -Amiti Sen and Prabhudutta Mishra, The Hindu Business Line, 4 March, 2022, please <a href="https://www.thehindubusinessline.com/markets/commodities/govt-reviews-cooking-oil-imports-as-ukraine-crisis-disrupts-supplies-prices-shoot-up/article65190879.ece" title="https://www.thehindubusinessline.com/markets/commodities/govt-reviews-cooking-oil-imports-as-ukraine-crisis-disrupts-supplies-prices-shoot-up/article65190879.ece">click here</a> to access &nbsp;</p><p>India&#39;s Economy Faces A Potential Stagflation Risk From Ukraine War -Sunil Prabhu, NDTV.com, 1 March, 2022, please <a href="https://www.ndtv.com/business/indias-economy-faces-a-potential-stagflation-risk-from-ukraine-war-2796624" title="https://www.ndtv.com/business/indias-economy-faces-a-potential-stagflation-risk-from-ukraine-war-2796624">click here</a> to access</p><p>India to be one of Asia&rsquo;s &lsquo;biggest losers&rsquo; from the Ukraine war as Russia slammed by global sanctions -Paran Balakrishnan, The Telegraph, 1 March, 2022, please <a href="https://www.telegraphindia.com/business/russia-ukraine-crisis-india-to-be-one-of-asias-biggest-losers-from-the-ukraine-war-as-russia-slammed-by-global-sanctions/cid/1854032" title="https://www.telegraphindia.com/business/russia-ukraine-crisis-india-to-be-one-of-asias-biggest-losers-from-the-ukraine-war-as-russia-slammed-by-global-sanctions/cid/1854032">click here</a> to access</p><p>Crude Oil Prices Rise, Tracking Russia-Ukraine Conflict -Rahul Karunakar, NDTV.com <em>(with inputs from Agencies)</em>, 1 March, 2022, please <a href="https://www.ndtv.com/business/crude-oil-prices-rise-on-tuesday-tracking-russia-ukraine-conflict-2796187" title="https://www.ndtv.com/business/crude-oil-prices-rise-on-tuesday-tracking-russia-ukraine-conflict-2796187">click here</a> to access</p><p>Cooking Oil May Become Costlier Due to Russia-ukraine War. Know Why, News18.com, 27 February, 2022, please <a href="https://www.news18.com/news/business/markets/cooking-oil-may-become-costlier-due-to-russia-ukraine-war-know-why-4812740.html" title="https://www.news18.com/news/business/markets/cooking-oil-may-become-costlier-due-to-russia-ukraine-war-know-why-4812740.html">click here</a> to access &nbsp;</p><p style="text-align:justify"><strong>Image Courtesy: Inclusive Media for Change/ Shambhu Ghatak</strong></p>',
'lang' => 'English',
'SITE_URL' => 'https://im4change.in/',
'site_title' => 'im4change',
'adminprix' => 'admin'
]
$article_current = object(App\Model\Entity\Article) {
'id' => (int) 62349,
'title' => 'Real wage rates of the rural workers hardly increased during the last 6 years',
'subheading' => null,
'description' => '<p style="text-align:justify">In the absence of income or expenditure-based headcount ratio, the growth in the real wages <em>(i.e., nominal wages adjusted against retail inflation)</em> of the manual workers is considered to be a good proxy to assess the trends in poverty. This is because the manual, unskilled/ semi-skilled labourers exist at the bottom of the pyramid or economic hierarchy, and most of them belong to the social categories Scheduled Castes (SCs) and Scheduled Tribes (STs). A positive growth in their real wages <em>(or real wage rates) </em>is anticipated to improve their purchasing power <em>(i.e., income or consumption expenditure)</em> and lift them out of the poverty trap. &nbsp;</p>
<p style="text-align:justify">Clearly, there exists inter-state differences in nominal wage rates, growth in nominal wage rates and growth in real wage rates, which we will see in this news alert.&nbsp;</p>
<p style="text-align:justify">Against the backdrop of the <a href="https://www.thehindubusinessline.com/markets/commodities/govt-reviews-cooking-oil-imports-as-ukraine-crisis-disrupts-supplies-prices-shoot-up/article65190879.ece">Russia-Ukraine conflict</a>, which is anticipated to cause both <a href="https://www.ndtv.com/business/indias-economy-faces-a-potential-stagflation-risk-from-ukraine-war-2796624">food and fuel retail inflation</a> in India in the coming times, it is even more important to look at the past trends in wage rate growth of the rural workers. It should be noted that the <a href="https://public.flourish.studio/visualisation/8706137">year-on-year inflation</a> in <a href="https://public.flourish.studio/visualisation/8706137">Consumer</a> <a href="https://public.flourish.studio/visualisation/8706137">Price Index Rural</a> exceeded the <a href="https://public.flourish.studio/visualisation/8706137">year-on-year inflation</a> in <a href="https://public.flourish.studio/visualisation/8706137">CPI Urban</a> during January 2022 at the national level. Even before the beginning of Russia-Ukraine conflict <em>(i.e., during January 2022)</em>, in rural areas, <a href="https://im4change.org/upload/files/CPI%20Press%20Release%20January%202022%281%29.pdf">retail inflation rate of 20.6 percent</a> was noticed for &#39;oils and fats&#39;, aside from&nbsp;<a href="https://im4change.org/upload/files/CPI%20Press%20Release%20January%202022%281%29.pdf">8.44 percent retail inflation for &#39;fuel and light&#39;</a>, <a href="https://im4change.org/upload/files/CPI%20Press%20Release%20January%202022%281%29.pdf">8.27 percent</a> for &#39;transport and communication&#39;, and <a href="https://im4change.org/upload/files/CPI%20Press%20Release%20January%202022%281%29.pdf">9.65 percent for &#39;clothing and footwear&#39;</a>.&nbsp; &nbsp;&nbsp;</p>
<p style="text-align:justify">At the national level, the average daily nominal wage rate&nbsp;for male construction workers in rural areas during the period from 2014-15 to 2020-21 was Rs. 316.9, which was greater than that of the male non-farm workers in rural areas. The average daily nominal wage rate&nbsp;for male non-agricultural labourers in rural areas during the period from 2014-15 to 2020-21 was Rs. 273.8, which exceeded the average daily nominal wage rates for male farm labourers in rural areas <em>(i.e., Rs. 265.1)</em>. However, in Andhra Pradesh, Haryana, Himachal Pradesh, Jammu and Kashmir,&nbsp;Karnataka, Kerala, Meghalaya, Punjab, and Tripura, the average daily nominal wage rates for male agricultural labourers in rural areas during the period from 2014-15 to 2020-21 exceeded the average daily nominal wage rates for male non-farm labourers in rural areas. Please see chart-1.</p>
<p style="text-align:justify"><img alt="" src="/upload/images/Chart%201.png" style="height:670px; width:1000px" /></p>
<p style="text-align:justify"><em><strong>Notes:</strong> The average (i.e., arithmetic mean) daily nominal wage rates for various categories of workers in rural India in the period from 2014-15 to 2020-21 has been calculated by the Inclusive Media for Change staff</em></p>
<p style="text-align:justify"><em>Please <a href="https://docs.google.com/spreadsheets/d/1avu0-WtaKV2RHXtz2eiP7iS8znGVBdKC/edit?usp=sharing&amp;ouid=112233925171588304692&amp;rtpof=true&amp;sd=true">click here</a> to access the data in spreadsheet format</em></p>
<p style="text-align:justify"><em><strong>Source:&nbsp;</strong>Handbook of Statistics on Indian States 2020-21, released in November 2021, please <a href="https://m.rbi.org.in/scripts/AnnualPublications.aspx?head=Handbook%20of%20Statistics%20on%20Indian%20States">click here</a> to access</em></p>
<p style="text-align:justify"><em>State-wise Average Daily Wage Rates in Rural India (Men - General Agricultural Labourers), RBI Handbook of Statistics on Indian States 2020-21, released in November 2021, please <a href="/upload/files/State-wise%20Average%20Daily%20Wage%20Rates%20in%20Rural%20India%20Men%20-%20General%20Agricultural%20Labourers.PDF">click here</a> to access&nbsp;</em></p>
<p style="text-align:justify"><em>State-wise Average Daily Wage Rates in Rural India (Men - Non-Agricultural Labourers), RBI Handbook of Statistics on Indian States 2020-21, released in November 2021, please <a href="/upload/files/State-wise%20Average%20Daily%20Wage%20Rates%20in%20Rural%20India%20Men%20-%20Non%20Agricultural%20Labourers.PDF">click here</a> to access&nbsp;</em></p>
<p style="text-align:justify"><em>State-wise Average Daily Wage Rates in Rural India (Men - Construction Workers), RBI Handbook of Statistics on Indian States 2020-21, released in November 2021, please <a href="/upload/files/State-wise%20Average%20Daily%20Wage%20Rates%20in%20Rural%20India%20Men%20-%20Construction%20Workers.PDF">click here</a> to access&nbsp;</em></p>
<p style="text-align:justify"><em>State-wise Average Inflation (CPI) - Inflation, RBI Handbook of Statistics on Indian States 2020-21, released in November 2021, please <a href="/upload/files/State-wise%20Average%20Inflation%20CPI%20-%20Inflation.PDF">click here</a> to access&nbsp;</em></p>
<p style="text-align:justify"><strong>---</strong></p>
<p style="text-align:justify">At the national level, the agricultural nominal wage rate&nbsp;grew faster than the non-farm wage&nbsp;rate&nbsp;on average for male labourers in rural areas during the period from 2015-16 to 2020-21. However, in states like Assam, Bihar, Haryana, Madhya Pradesh, Odisha, Punjab, and West Bengal, the non-farm nominal wage rates grew faster than the farm wage rates on average for male workers in rural areas during the period from 2015-16 to 2020-21. Please see chart-2.&nbsp;</p>
<p style="text-align:justify"><img alt="" src="/upload/images/Chart%202.png" style="height:653px; width:1000px" /></p>
<p style="text-align:justify"><em><strong>Notes: </strong>The average growth in daily nominal wage rates for various categories of workers in rural India in the period from 2015-16 to 2020-21 has been calculated by the Inclusive Media for Change staff</em></p>
<p style="text-align:justify"><em>Please <a href="https://docs.google.com/spreadsheets/d/1avu0-WtaKV2RHXtz2eiP7iS8znGVBdKC/edit?usp=sharing&amp;ouid=112233925171588304692&amp;rtpof=true&amp;sd=true">click here</a> to access the data in spreadsheet format</em></p>
<p style="text-align:justify"><em><strong>Source: </strong>Same as above</em><br />
<strong>---</strong></p>
<p style="text-align:justify">At the national level, the construction sector nominal wage rate&nbsp;grew slower than the non-agricultural wage&nbsp;rate&nbsp;on average for male labourers in rural areas during the period from 2015-16 to 2020-21. However, in states like Andhra Pradesh, Bihar, Himachal Pradesh, Maharashtra, Meghalaya, Punjab,&nbsp;Tamil Nadu, and Uttar Pradesh, the construction sector nominal wage rates grew faster than the non-farm wage rates on average for male workers in rural areas during the period from 2015-16 to 2020-21. Please take a look at chart-2. &nbsp;</p>
<p style="text-align:justify">At the national level, the agricultural wage rate&nbsp;in real terms grew faster than the non-farm wage rate&nbsp;on average for male labourers in rural areas during the period from 2015-16 to 2020-21. However, in states like Assam, Bihar, Haryana, Madhya Pradesh, Odisha, Punjab, and West Bengal, the non-farm wage rates in real terms grew faster than the farm wage rates on average for male workers in rural areas during the period from 2015-16 to 2020-21. Please see table-1.</p>
<p style="text-align:justify"><strong>Table 1: State-wise Growth in Average Daily Wage Rates in Real terms for Male Agricultural Labourers, Male Non-Agricultural Labourers, and Male Construction Workers in Rural India, in %</strong><br />
<img alt="" src="/upload/images/Table%201%20State-wise%20Growth%20in%20Average%20Daily%20Wage%20Rates%20in%20Real%20terms%20for%20Male%20Agricultural%20Labourers%20Male%20Non-Agricultural%20Labourers%20and%20Male%20Construction%20Workers%20in%20Rural%20India%20in%20percent.png" style="height:539px; width:750px" /></p>
<p style="text-align:justify"><em><strong>Notes: </strong>The average growth in daily wage rates in real terms for various categories of workers in rural India in the period from 2015-16 to 2020-21 has been calculated by the Inclusive Media for Change staff</em></p>
<p style="text-align:justify"><em>Please <a href="https://docs.google.com/spreadsheets/d/1avu0-WtaKV2RHXtz2eiP7iS8znGVBdKC/edit?usp=sharing&amp;ouid=112233925171588304692&amp;rtpof=true&amp;sd=true">click here</a> to access the data in spreadsheet format</em></p>
<p style="text-align:justify"><em><strong>Source: </strong>Same as above</em><br />
<strong>---</strong></p>
<p style="text-align:justify">At the national level, the construction sector wage rate&nbsp;in real terms grew slower than the non-agricultural wage rate&nbsp;on average for male labourers in rural areas during the period from 2015-16 to 2020-21. However, in states like Andhra Pradesh, Bihar, Himachal Pradesh, Maharashtra, Meghalaya, Punjab, Tamil Nadu, and Uttar Pradesh, the construction sector wage rates in real terms grew faster than the non-farm wage rates on average for male workers in rural areas during the period from 2015-16 to 2020-21. Please take a look at table-1. &nbsp;</p>
<p style="text-align:justify">In the following paragraphs, we have discussed the trends in agricultural wage rates, non-farm wage rates, and construction sector wage rates <em>(in rural areas)</em> in detail.&nbsp;</p>
<p style="text-align:justify"><strong>Agricultural wages in rural areas</strong></p>
<p style="text-align:justify">The highest <a href="https://im4change.org/upload/files/State%20wise%20average%20daily%20nominal%20wage%20rates%20in%20rural%20india%20men%20farm%20labourers.JPG">average daily nominal wage rate</a> <a href="https://im4change.org/upload/files/State%20wise%20average%20daily%20nominal%20wage%20rates%20in%20rural%20india%20men%20farm%20labourers.JPG">for male agricultural labourers</a> in rural India during the period from 2014-15 to 2020-21 was found in Kerala <em>(Rs. 653.93)</em>, followed by Jammu and Kashmir <em>(Rs. 429.19)</em>, Tamil Nadu <em>(Rs. 385.6)</em>, Haryana <em>(Rs. 368.53)</em>, Himachal Pradesh <em>(Rs. 366.23)</em>, and Punjab <em>(Rs. 325.31)</em>. Please have a look at chart-1.</p>
<p style="text-align:justify">The lowest <a href="https://im4change.org/upload/files/State%20wise%20average%20daily%20nominal%20wage%20rates%20in%20rural%20india%20men%20farm%20labourers.JPG">average daily nominal wage rate</a> <a href="https://im4change.org/upload/files/State%20wise%20average%20daily%20nominal%20wage%20rates%20in%20rural%20india%20men%20farm%20labourers.JPG">for male agricultural labourers</a> in rural India during the period from 2014-15 to 2020-21 was observed in Madhya Pradesh <em>(Rs. 183.97)</em>, followed by Gujarat <em>(Rs. 190.07)</em>, Maharashtra <em>(Rs. 215.71)</em>, Odisha <em>(Rs. 216.87)</em>, Meghalaya <em>(Rs. 219.93)</em>, Bihar <em>(Rs. 230.43)</em>, Uttar Pradesh <em>(Rs. 230.5)</em>, and Assam <em>(Rs. 237.3)</em>. The related national level figure was Rs. 265.09 during the period from 2014-15 to 2020-21. Please consult chart-1.&nbsp;</p>
<p style="text-align:justify">The highest <a href="https://im4change.org/upload/files/State%20wise%20growth%20in%20average%20daily%20nominal%20wage%20rates%20in%20rural%20india%20men%20farm%20labourers.JPG">average annual growth rate in</a> <a href="https://im4change.org/upload/files/State%20wise%20growth%20in%20average%20daily%20nominal%20wage%20rates%20in%20rural%20india%20men%20farm%20labourers.JPG">nominal wage rates</a> during the period from 2015-16 to 2020-21 was found in Karnataka <em>(7.3 percent)</em>, followed by Andhra Pradesh <em>(6.8 percent)</em>, Madhya Pradesh <em>(6.4 percent)</em>, Uttar Pradesh <em>(6.2 percent)</em>, Odisha <em>(6.1 percent)</em>, and Meghalaya <em>(6.0 percent)</em>. Please see chart-2.</p>
<p style="text-align:justify">The lowest <a href="https://im4change.org/upload/files/State%20wise%20growth%20in%20average%20daily%20nominal%20wage%20rates%20in%20rural%20india%20men%20farm%20labourers.JPG">average annual growth rate</a> <a href="https://im4change.org/upload/files/State%20wise%20growth%20in%20average%20daily%20nominal%20wage%20rates%20in%20rural%20india%20men%20farm%20labourers.JPG">in nominal wage rates</a> during the same period was noticed in Haryana <em>(2.1 percent)</em>, followed by Rajasthan <em>(3.3 percent)</em>, Kerala <em>(3.5 percent)</em>, Punjab <em>(3.9 percent)</em>, and Tamil Nadu <em>(4.5 percent)</em>. Please consult chart-2.</p>
<p style="text-align:justify">The average annual <a href="https://im4change.org/upload/files/State%20wise%20growth%20in%20average%20daily%20wage%20rates%20in%20real%20terms%20for%20male%20farm%20labourers%20in%20rural%20India.JPG">growth of agricultural labourers&rsquo;</a> <a href="https://im4change.org/upload/files/State%20wise%20growth%20in%20average%20daily%20wage%20rates%20in%20real%20terms%20for%20male%20farm%20labourers%20in%20rural%20India.JPG">wage rates in real terms</a> during the period from 2015-16 to 2020-21 were negative in Haryana <em>(-2.1 percent)</em>, Jammu and Kashmir <em>(-0.3 percent)</em>, Kerala <em>(-1.7 percent)</em>, Punjab <em>(-0.4 percent)</em>, Rajasthan <em>(-1.1 percent)</em>, Tamil Nadu <em>(-0.8 percent)</em>, Tripura <em>(-0.5 percent)</em>, and West Bengal <em>(-0.1 percent)</em>. It should be noted that the <a href="https://im4change.org/upload/files/State-wise%20Average%20Inflation%20CPI%20-%20Inflation.PDF">rate of inflation</a> in <a href="https://im4change.org/upload/files/State-wise%20Average%20Inflation%20CPI%20-%20Inflation.PDF">Consumer Price Index-General</a> has been used to get the average annual growth of agricultural labourers&rsquo; wage rates in real terms. Kindly consult table-1. &nbsp;</p>
<p style="text-align:justify">Some states witnessed negative <a href="https://im4change.org/upload/files/State%20wise%20growth%20in%20average%20daily%20wage%20rates%20in%20real%20terms%20for%20male%20farm%20labourers%20in%20rural%20India.JPG">growth in agricultural labourers&rsquo;</a> <a href="https://im4change.org/upload/files/State%20wise%20growth%20in%20average%20daily%20wage%20rates%20in%20real%20terms%20for%20male%20farm%20labourers%20in%20rural%20India.JPG">wage rates in real terms</a> for more than two years between 2015-16 and 2020-21. For example, <a href="https://im4change.org/upload/files/State%20wise%20growth%20in%20average%20daily%20wage%20rates%20in%20real%20terms%20for%20male%20farm%20labourers%20in%20rural%20India.JPG">Haryana</a> experienced negative growth in 2015-16, 2016-17, 2017-18, 2019-20, and 2020-21. Likewise, <a href="https://im4change.org/upload/files/State%20wise%20growth%20in%20average%20daily%20wage%20rates%20in%20real%20terms%20for%20male%20farm%20labourers%20in%20rural%20India.JPG">Kerala</a> faced negative growth in 2017-18, 2018-19, 2019-20, and 2020-21. &nbsp;</p>
<p style="text-align:justify">At the national level, the <a href="https://im4change.org/upload/files/State%20wise%20growth%20in%20average%20daily%20wage%20rates%20in%20real%20terms%20for%20male%20farm%20labourers%20in%20rural%20India.JPG">agricultural labourers&rsquo;</a> <a href="https://im4change.org/upload/files/State%20wise%20growth%20in%20average%20daily%20wage%20rates%20in%20real%20terms%20for%20male%20farm%20labourers%20in%20rural%20India.JPG">wage rates in real terms</a> on average grew by 1.0 percent annually during the period from 2015-16 to 2020-21.</p>
<p style="text-align:justify">Please <a href="https://docs.google.com/spreadsheets/d/1avu0-WtaKV2RHXtz2eiP7iS8znGVBdKC/edit?usp=sharing&amp;ouid=112233925171588304692&amp;rtpof=true&amp;sd=true">click here</a> to access the spreadsheet in order to look at the trends in <a href="/upload/files/State%20wise%20average%20daily%20nominal%20wage%20rates%20in%20rural%20india%20men%20farm%20labourers.JPG">nominal wage rates</a>, <a href="/upload/files/State%20wise%20growth%20in%20average%20daily%20nominal%20wage%20rates%20in%20rural%20india%20men%20farm%20labourers.JPG">annual growth in nominal wage rates</a> and <a href="/upload/files/State%20wise%20growth%20in%20average%20daily%20wage%20rates%20in%20real%20terms%20for%20male%20farm%20labourers%20in%20rural%20India.JPG">annual growth in real wage rates</a> for farm labourers in rural areas.&nbsp;</p>
<p style="text-align:justify"><strong>Non-agricultural wages in rural areas</strong></p>
<p style="text-align:justify">The rural economy is not just about farming any longer. That is why we have looked at the wage growth in the non-farm sector too.&nbsp;The highest <a href="https://im4change.org/upload/files/State%20wise%20average%20daily%20nominal%20wage%20rates%20in%20rural%20india%20men%20non%20farm%20labourers.JPG">average daily nominal wage rate for male</a> <a href="https://im4change.org/upload/files/State%20wise%20average%20daily%20nominal%20wage%20rates%20in%20rural%20india%20men%20non%20farm%20labourers.JPG">non-agricultural labourers</a> in rural India during the period from 2014-15 to 2020-21 was detected in Kerala <em>(Rs. 639.01)</em>, followed by Jammu and Kashmir <em>(Rs. 426.37)</em>, Tamil Nadu <em>(Rs. 405.77)</em>, Haryana <em>(Rs. 359.24)</em>, Himachal Pradesh <em>(Rs. 311.10)</em>, and Punjab <em>(Rs. 309.09)</em>. Please see chart-1.</p>
<p style="text-align:justify">The lowest average <a href="https://im4change.org/upload/files/State%20wise%20average%20daily%20nominal%20wage%20rates%20in%20rural%20india%20men%20non%20farm%20labourers.JPG">daily nominal wage rate for male</a> <a href="https://im4change.org/upload/files/State%20wise%20average%20daily%20nominal%20wage%20rates%20in%20rural%20india%20men%20non%20farm%20labourers.JPG">non-agricultural labourers in rural India</a> during the period from 2014-15 to 2020-21 was found in Madhya Pradesh <em>(Rs. 191.47)</em>, followed by Meghalaya <em>(Rs. 210.26)</em>, Gujarat <em>(Rs. 213.51)</em>, Odisha <em>(Rs. 218.06)</em>, Maharashtra <em>(Rs. 226.70)</em>, Tripura <em>(Rs. 230.36)</em>, Bihar <em>(Rs. 243.51)</em>, and Uttar Pradesh <em>(Rs. 243.97)</em>. The related national level figure was Rs. 273.79 during the period from 2014-15 to 2020-21. Please see chart-1.</p>
<p style="text-align:justify">The highest <a href="https://im4change.org/upload/files/State%20wise%20growth%20in%20average%20daily%20nominal%20wage%20rates%20in%20rural%20india%20men%20non%20farm%20labourers.JPG">average annual growth rate in</a> <a href="https://im4change.org/upload/files/State%20wise%20growth%20in%20average%20daily%20nominal%20wage%20rates%20in%20rural%20india%20men%20non%20farm%20labourers.JPG">nominal wage rates</a> during the period from 2015-16 to 2020-21 was noticed in Odisha <em>(8.0 percent)</em>, followed by Madhya Pradesh <em>(7.6 percent)</em>, Assam <em>(6.6 percent)</em>, West Bengal <em>(5.9 percent)</em>, Uttar Pradesh and Andhra Pradesh <em>(5.6 percent each)</em>, and Bihar <em>(5.5 percent)</em>. Kindly consult chart-2.</p>
<p style="text-align:justify">The lowest <a href="https://im4change.org/upload/files/State%20wise%20growth%20in%20average%20daily%20nominal%20wage%20rates%20in%20rural%20india%20men%20non%20farm%20labourers.JPG">average annual growth rate</a> <a href="https://im4change.org/upload/files/State%20wise%20growth%20in%20average%20daily%20nominal%20wage%20rates%20in%20rural%20india%20men%20non%20farm%20labourers.JPG">in nominal wage rates</a> during the same period was observed in Kerala <em>(1.8 percent)</em>, followed by Haryana <em>(2.4 percent)</em>, Meghalaya <em>(2.8 percent)</em>, Tamil Nadu and Rajasthan <em>(3.2 percent each)</em>, Tripura and Jammu and Kashmir <em>(4.0 percent each),</em> and Maharashtra and Punjab <em>(4.2 percent each)</em>. Kindly consult chart-2.&nbsp;</p>
<p style="text-align:justify">The average annual <a href="https://im4change.org/upload/files/State%20wise%20growth%20in%20average%20daily%20wage%20rates%20in%20real%20terms%20for%20male%20non%20farm%20labourers%20in%20rural%20India.JPG">growth of non-agricultural labourers&rsquo;</a> <a href="https://im4change.org/upload/files/State%20wise%20growth%20in%20average%20daily%20wage%20rates%20in%20real%20terms%20for%20male%20non%20farm%20labourers%20in%20rural%20India.JPG">wage rates in real terms</a> during the period from 2015-16 to 2020-21 were negative in Haryana <em>(-1.9 percent)</em>, Jammu and Kashmir <em>(-1.7 percent)</em>, Kerala <em>(-3.5 percent)</em>, Maharashtra <em>(-0.3 percent)</em>, Meghalaya <em>(-1.2 percent)</em>, Punjab <em>(-0.1 percent)</em>, Rajasthan <em>(-1.2 percent)</em>, Tamil Nadu <em>(-2.1 percent)</em>, and Tripura <em>(-1.1 percent)</em>. It should be noted that the <a href="https://im4change.org/upload/files/State-wise%20Average%20Inflation%20CPI%20-%20Inflation.PDF">rate of inflation</a> in <a href="https://im4change.org/upload/files/State-wise%20Average%20Inflation%20CPI%20-%20Inflation.PDF">CPI-General</a> has been used to get the average annual growth of non-agricultural labourers&rsquo; wage rates in real terms. Kindly have a look at table-1. &nbsp;&nbsp;</p>
<p style="text-align:justify">Some states experienced negative growth in <a href="https://im4change.org/upload/files/State%20wise%20growth%20in%20average%20daily%20wage%20rates%20in%20real%20terms%20for%20male%20non%20farm%20labourers%20in%20rural%20India.JPG">non-agricultural labourers&rsquo; wage</a> <a href="https://im4change.org/upload/files/State%20wise%20growth%20in%20average%20daily%20wage%20rates%20in%20real%20terms%20for%20male%20non%20farm%20labourers%20in%20rural%20India.JPG">rates in real terms</a> for more than two years between 2015-16 and 2020-21. For example, <a href="https://im4change.org/upload/files/State%20wise%20growth%20in%20average%20daily%20wage%20rates%20in%20real%20terms%20for%20male%20non%20farm%20labourers%20in%20rural%20India.JPG">Haryana</a> experienced negative <a href="https://im4change.org/upload/files/State%20wise%20growth%20in%20average%20daily%20wage%20rates%20in%20real%20terms%20for%20male%20non%20farm%20labourers%20in%20rural%20India.JPG">growth in wage rates</a> <a href="https://im4change.org/upload/files/State%20wise%20growth%20in%20average%20daily%20wage%20rates%20in%20real%20terms%20for%20male%20non%20farm%20labourers%20in%20rural%20India.JPG"><em>(in real terms)</em></a> during 2016-17, 2017-18, 2018-19, 2019-20, and 2020-21. Likewise, <a href="https://im4change.org/upload/files/State%20wise%20growth%20in%20average%20daily%20wage%20rates%20in%20real%20terms%20for%20male%20non%20farm%20labourers%20in%20rural%20India.JPG">Kerala</a> faced negative growth rates in 2015-16, 2016-17, 2017-18, 2019-20, and 2020-21. &nbsp;</p>
<p style="text-align:justify">At the national level, the&nbsp;<a href="https://im4change.org/upload/files/State%20wise%20growth%20in%20average%20daily%20wage%20rates%20in%20real%20terms%20for%20male%20non%20farm%20labourers%20in%20rural%20India.JPG">non-agricultural labourers&rsquo;</a> <a href="https://im4change.org/upload/files/State%20wise%20growth%20in%20average%20daily%20wage%20rates%20in%20real%20terms%20for%20male%20non%20farm%20labourers%20in%20rural%20India.JPG">wage rates in real terms</a> on average grew by just 0.3 percent annually during the period from 2015-16 to 2020-21.&nbsp;</p>
<p style="text-align:justify">Please <a href="https://docs.google.com/spreadsheets/d/1avu0-WtaKV2RHXtz2eiP7iS8znGVBdKC/edit?usp=sharing&amp;ouid=112233925171588304692&amp;rtpof=true&amp;sd=true">click here</a> to access the spreadsheet in order to look at the <a href="/upload/files/State%20wise%20average%20daily%20nominal%20wage%20rates%20in%20rural%20india%20men%20non%20farm%20labourers.JPG">trends in nominal wage rates</a>, <a href="/upload/files/State%20wise%20growth%20in%20average%20daily%20nominal%20wage%20rates%20in%20rural%20india%20men%20non%20farm%20labourers.JPG">annual growth in nominal wage rates</a>, and <a href="/upload/files/State%20wise%20growth%20in%20average%20daily%20wage%20rates%20in%20real%20terms%20for%20male%20non%20farm%20labourers%20in%20rural%20India.JPG">annual growth in real wage rates</a> for non-farm labourers in rural areas.&nbsp;</p>
<p style="text-align:justify"><strong>Construction sector wages in rural areas</strong></p>
<p style="text-align:justify">The <a href="https://im4change.org/upload/files/State%20wise%20average%20daily%20nominal%20wage%20rates%20in%20rural%20india%20men%20construction%20workers.JPG">highest average daily nominal wage rates</a> <a href="https://im4change.org/upload/files/State%20wise%20average%20daily%20nominal%20wage%20rates%20in%20rural%20india%20men%20construction%20workers.JPG">for male construction workers in rural India</a> during the period from 2014-15 to 2020-21 was detected in Kerala <em>(Rs. 810.3)</em>, followed by Jammu and Kashmir <em>(Rs. 445.1)</em>, Tamil Nadu <em>(Rs. 424.1)</em>, Haryana <em>(Rs. 379.9)</em>, Himachal Pradesh <em>(Rs. 368.7)</em>, Rajasthan <em>(Rs. 347.7)</em>, and Punjab <em>(Rs. 339.1)</em>. Kindly see chart-1.&nbsp;</p>
<p style="text-align:justify">The <a href="https://im4change.org/upload/files/State%20wise%20average%20daily%20nominal%20wage%20rates%20in%20rural%20india%20men%20construction%20workers.JPG">lowest average daily nominal wage rates</a> <a href="https://im4change.org/upload/files/State%20wise%20average%20daily%20nominal%20wage%20rates%20in%20rural%20india%20men%20construction%20workers.JPG">for male construction workers in rural areas</a> during the period from 2014-15 to 2020-21 was found in Madhya Pradesh <em>(Rs. 212.4)</em>, followed by Tripura <em>(Rs. 230.4)</em>, Meghalaya <em>(Rs. 231.7)</em>, Odisha <em>(Rs. 247.1)</em>, Gujarat <em>(Rs. 251.8)</em>, Uttar Pradesh <em>(Rs. 267.4)</em>, Bihar <em>(Rs. 270.8)</em>, and West Bengal <em>(Rs. 274.0)</em>. The related national level figure was Rs. 316.9 during the period from 2014-15 to 2020-21. Kindly consult chart-1.</p>
<p style="text-align:justify">The <a href="https://im4change.org/upload/files/State%20wise%20growth%20in%20average%20daily%20nominal%20wage%20rates%20in%20rural%20india%20men%20construction%20workers.JPG">highest average annual growth rates in</a> <a href="https://im4change.org/upload/files/State%20wise%20growth%20in%20average%20daily%20nominal%20wage%20rates%20in%20rural%20india%20men%20construction%20workers.JPG">nominal wage rates</a> during the period from 2015-16 to 2020-21 was noticed in Meghalaya <em>(20.9 percent)</em>, followed by Madhya Pradesh <em>(7.4 percent)</em>, Odisha and Andhra Pradesh <em>(6.8 percent each)</em>, Uttar Pradesh <em>(6.4 percent)</em>, and Bihar <em>(6.2 percent)</em>. Please see chart-2.&nbsp;</p>
<p style="text-align:justify">The <a href="https://im4change.org/upload/files/State%20wise%20growth%20in%20average%20daily%20nominal%20wage%20rates%20in%20rural%20india%20men%20construction%20workers.JPG">lowest average annual growth rates in</a> <a href="https://im4change.org/upload/files/State%20wise%20growth%20in%20average%20daily%20nominal%20wage%20rates%20in%20rural%20india%20men%20construction%20workers.JPG">nominal wage rates</a> during the same period was observed in Kerala <em>(0.9 percent)</em>, followed by Manipur <em>(2.0 percent)</em>, Haryana <em>(2.1 percent)</em>, Jammu and Kashmir <em>(3.0 percent)</em>, Rajasthan <em>(3.2 percent)</em>, and Gujarat <em>(3.6 percent)</em>. Please see chart-2.</p>
<p style="text-align:justify">The <a href="https://im4change.org/upload/files/State%20wise%20growth%20in%20average%20daily%20wage%20rates%20in%20real%20terms%20for%20male%20construction%20workers%20in%20rural%20India%281%29.JPG">average annual growth of construction workers&rsquo;</a> <a href="https://im4change.org/upload/files/State%20wise%20growth%20in%20average%20daily%20wage%20rates%20in%20real%20terms%20for%20male%20construction%20workers%20in%20rural%20India%281%29.JPG">wage rates in real terms</a> during the period from 2015-16 to 2020-21 was negative in Assam <em>(-1.2 percent)</em>, Haryana <em>(-2.1 percent)</em>, Jammu and Kashmir <em>(-2.7 percent)</em>, Karnataka <em>(-0.6 percent)</em>, Kerala <em>(-4.4 percent)</em>, Manipur <em>(-6.3 percent)</em>, Rajasthan <em>(-1.2 percent)</em>, Tamil Nadu <em>(-0.9 percent)</em>, and Tripura <em>(-1.1 percent)</em>. Please note that the <a href="https://im4change.org/upload/files/State-wise%20Average%20Inflation%20CPI%20-%20Inflation.PDF">rate of inflation</a> in <a href="https://im4change.org/upload/files/State-wise%20Average%20Inflation%20CPI%20-%20Inflation.PDF">CPI-General</a> has been used to get the average annual growth of construction workers&rsquo; wage rates in real terms. Kindly have a look at table-1. &nbsp;&nbsp;</p>
<p style="text-align:justify">In the case of Meghalaya, the <a href="https://im4change.org/upload/files/State%20wise%20average%20daily%20nominal%20wage%20rates%20in%20rural%20india%20men%20construction%20workers.JPG">nominal daily wage rate of male construction</a> <a href="https://im4change.org/upload/files/State%20wise%20average%20daily%20nominal%20wage%20rates%20in%20rural%20india%20men%20construction%20workers.JPG">workers</a> fell from Rs. 186.0 in 2016-17 to Rs. 100.0 in 2017-18 i.e., a decline&nbsp;by -46.2 percent over previous year. However, the same bounced back to Rs. 273.2 in 2018-19 i.e., an increase by 173.2 percent over previous year. In <a href="https://im4change.org/upload/files/State%20wise%20growth%20in%20average%20daily%20wage%20rates%20in%20real%20terms%20for%20male%20construction%20workers%20in%20rural%20India%281%29.JPG">real terms, the construction sector</a> <a href="https://im4change.org/upload/files/State%20wise%20growth%20in%20average%20daily%20wage%20rates%20in%20real%20terms%20for%20male%20construction%20workers%20in%20rural%20India%281%29.JPG">wage rate in Meghalaya</a> grew by -47.7 percent in 2017-18 <em>(over previous year)</em> and 171.0 percent in 2018-19 <em>(over previous year)</em>.</p>
<p style="text-align:justify">Some states experienced negative <a href="https://im4change.org/upload/files/State%20wise%20growth%20in%20average%20daily%20wage%20rates%20in%20real%20terms%20for%20male%20construction%20workers%20in%20rural%20India%281%29.JPG">growth in construction workers&rsquo;</a> <a href="https://im4change.org/upload/files/State%20wise%20growth%20in%20average%20daily%20wage%20rates%20in%20real%20terms%20for%20male%20construction%20workers%20in%20rural%20India%281%29.JPG">wage rates in real terms</a> for more than two years between 2015-16 and 2020-21. For example, <a href="https://im4change.org/upload/files/State%20wise%20growth%20in%20average%20daily%20wage%20rates%20in%20real%20terms%20for%20male%20construction%20workers%20in%20rural%20India%281%29.JPG">Assam</a> experienced negative growth in wage rates <em>(in real terms)</em> during 2017-18, 2018-19, 2019-20, and 2020-21. &nbsp;</p>
<p style="text-align:justify">At the national level, the&nbsp;<a href="https://im4change.org/upload/files/State%20wise%20growth%20in%20average%20daily%20wage%20rates%20in%20real%20terms%20for%20male%20construction%20workers%20in%20rural%20India%281%29.JPG">construction workers&rsquo; wage rates in real terms</a> on average grew by just 0.1 percent annually during the period from 2015-16 to 2020-21.</p>
<p style="text-align:justify">Kindly <a href="https://docs.google.com/spreadsheets/d/1avu0-WtaKV2RHXtz2eiP7iS8znGVBdKC/edit?usp=sharing&amp;ouid=112233925171588304692&amp;rtpof=true&amp;sd=true">click here</a> to access the spreadsheet in order to look at the <a href="/upload/files/State%20wise%20average%20daily%20nominal%20wage%20rates%20in%20rural%20india%20men%20construction%20workers.JPG">trends in nominal wage rates</a>, <a href="/upload/files/State%20wise%20growth%20in%20average%20daily%20nominal%20wage%20rates%20in%20rural%20india%20men%20construction%20workers.JPG">annual growth in nominal wage rates</a>, and <a href="/upload/files/State%20wise%20growth%20in%20average%20daily%20wage%20rates%20in%20real%20terms%20for%20male%20construction%20workers%20in%20rural%20India%281%29.JPG">annual growth in real wage rates</a> for construction workers in rural areas.&nbsp;</p>
<p style="text-align:justify"><strong>Data collection methodology</strong></p>
<p style="text-align:justify">As a part of Rural Labour Enquiry, the&nbsp;<a href="https://im4change.org/upload/files/ilj_feb_2013.pdf">daily wage rates</a> in respect of eighteen agricultural and non-agricultural occupations are being collected along with rural retail price data by the Field Operations Division of the National Sample Survey Organisation since 1986-87, according to a February 2013 <a href="https://im4change.org/upload/files/ilj_feb_2013.pdf">edition of the Indian Labour Journal</a>.&nbsp;On the recommendations of the Governing Council of the National Sample Survey Organisation in its 61st meeting,&nbsp;the <a href="https://im4change.org/upload/files/ilj_feb_2013.pdf">Labour Bureau</a> started the compilation and analysis of wage rate data with effect from April, 1998.&nbsp;</p>
<p style="text-align:justify">The Field Operations Division of the National Sample Survey Organisation has been entrusted with the work of <a href="https://im4change.org/upload/files/METHOLOGY%20FOR%20COMPILATION%20OF%20THE%20WAGE%20RATE%20DATA.pdf">data collection</a>. The <a href="https://im4change.org/upload/files/METHOLOGY%20FOR%20COMPILATION%20OF%20THE%20WAGE%20RATE%20DATA.pdf">wage rate data</a> are being collected along with rural retail prices from 600 sample villages spread over 66 NSS regions of 20 States by canvassing Block-5 <em>(Annexure-I)</em> of Schedule 3.01(R). The data collection from these sample villages is staggered over the four weeks of a month with one-fourth of them being covered every week. The days of canvassing of Schedule 3.01(R) are fixed. The village functionaries like the Panchayat Secretary, Progress Assistant, Patwari and other Village or Block Officials are the primary informants for collection of data on wage rates. The data on normal working hours and the prevailing wage rates in cash and kind for the reported working hours are collected sex-wise for each of the 18 selected occupations in 20 states, indicates an old&nbsp;<a href="https://im4change.org/upload/files/METHOLOGY%20FOR%20COMPILATION%20OF%20THE%20WAGE%20RATE%20DATA.pdf">document</a> of the Labour Bureau. &nbsp;&nbsp;</p>
<p style="text-align:justify">The wage rates are sometimes reported for a duration that is less/more than the normal working hours. In such cases, they are <a href="https://im4change.org/upload/files/METHOLOGY%20FOR%20COMPILATION%20OF%20THE%20WAGE%20RATE%20DATA.pdf">first normalised for eight hours</a> working day. As regards the mode of payment of wages, it is made in both ways i.e., in cash and/or in kind. The payments made in kind are very common in rural areas, which include foodgrains, cooked food, tea, fuel, cigarette, beedi, fodder, etc.&nbsp;The wages reported in kind are evaluated at local retail prices. Thereafter, the data is thoroughly scrutinised and discrepant points are referred back to the field for clarification. In the next stage, the simple arithmetic average of these normalised daily wage rates is worked out occupation-wise and sex-wise for each state.</p>
<p style="text-align:justify"><a href="http://ras.org.in/methodology_of_data_collection_unsuited_to_changing_rural_reality">Up to June 2000</a>, the average wage rates at the national level were derived by taking the simple average of state figures; since July 2000, the averages have been obtained by dividing the sum total of wages of all 20 states by the number of centres or villages from which data were collected. The state-wise averages are restricted only to those occupations where the number of centres is five or more to avoid abnormal fluctuations and inconsistency in wages paid to different categories of workers on account of varying numbers of centres. However, in order to calculate the all-India averages, all neglected centres are taken into account to arrive at the total number of centres at the national level.</p>
<p style="text-align:justify">The <a href="/upload/files/RBI%20note%20Average%20Daily%20Wage%20rate%20Methodology.pdf">Reserve Bank of India</a>&nbsp;<em>(whose data we have used in writing this news alert)</em> has collated and is releasing monthly time series data on rural wage rates based on the data published by the Labour Bureau, Government of India. Starting from November 2013 the Labour Bureau is collecting the rural wage data in respect of 12 agricultural and 13 non-agricultural occupations across 20 major states, namely, Andhra Pradesh, Assam, Bihar, Gujarat, Haryana, Himachal Pradesh, Jammu &amp; Kashmir, Karnataka, Kerala, Madhya Pradesh, Maharashtra, Manipur, Meghalaya, Orissa, Punjab, Rajasthan, Tamil Nadu, Tripura, Uttar Pradesh and West Bengal. The occupations for which the daily wage rates are collected every month are: <u>(A) Agricultural occupations</u> &ndash; (1) &nbsp;Ploughing/ Tilling workers, (2) Sowing <em>(including planting/ Transplanting/ Weeding)</em> workers, (3) Harvesting/ Winnowing/ Threshing workers, (4) Picking workers <em>(including Tea, Cotton, Tobacco and other commercial crops)</em>, (5) Horticulture workers <em>(including nursery growers)</em>, (6) Fishermen-inland, (7) Fishermen coastal/deep-sea, (8) Loggers and wood cutters, (9) Animal husbandry workers <em>(including poultry workers, dairy workers and herdsman)</em>, (10) Packaging labourers, agriculture, (11) General agricultural labourers <em>(including watering/ irrigation workers, etc.)</em>, (12) Plant protection workers <em>(applying pesticides, treating seeds, etc.)</em>; and <u>(B) Non-agricultural occupations</u> &ndash; (13) Carpenter, (14) Blacksmith, (15) Mason, (16) Weavers, (17) Beedi makers, (18) Bamboo, cane basket weavers, (19) Handicraft workers, (20) Plumbers, (21) Electrician, (22) Construction workers <em>(for roads, dams, industrial &amp; project construction work and Well diggers)</em>, (23) LMV &amp; Tractor drivers, (24) Non-agricultural labourers <em>(including porters, loaders)</em>, and (25) Sweeping/cleaning workers.&nbsp;</p>
<p style="text-align:justify"><strong><em>References&nbsp;</em></strong></p>
<p style="text-align:justify">Handbook of Statistics on Indian States 2020-21, released in November 2021, please <a href="https://m.rbi.org.in/scripts/AnnualPublications.aspx?head=Handbook%20of%20Statistics%20on%20Indian%20States">click here</a> to access</p>
<p style="text-align:justify">State-wise Average Daily Wage Rates in Rural India (Men - General Agricultural Labourers), RBI Handbook of Statistics on Indian States 2020-21, released in November 2021, please <a href="/upload/files/State-wise%20Average%20Daily%20Wage%20Rates%20in%20Rural%20India%20Men%20-%20General%20Agricultural%20Labourers.PDF">click here</a> to access&nbsp;</p>
<p style="text-align:justify">State-wise Average Daily Wage Rates in Rural India (Men - Non-Agricultural Labourers), RBI Handbook of Statistics on Indian States 2020-21, released in November 2021, please <a href="/upload/files/State-wise%20Average%20Daily%20Wage%20Rates%20in%20Rural%20India%20Men%20-%20Non%20Agricultural%20Labourers.PDF">click here</a> to access&nbsp;</p>
<p style="text-align:justify">State-wise Average Daily Wage Rates in Rural India (Men - Construction Workers), RBI Handbook of Statistics on Indian States 2020-21, released in November 2021, please <a href="/upload/files/State-wise%20Average%20Daily%20Wage%20Rates%20in%20Rural%20India%20Men%20-%20Construction%20Workers.PDF">click here</a> to access&nbsp;</p>
<p style="text-align:justify">State-wise Average Inflation (CPI) - Inflation, RBI Handbook of Statistics on Indian States 2020-21, released in November 2021, please <a href="/upload/files/State-wise%20Average%20Inflation%20CPI%20-%20Inflation.PDF">click here</a> to access&nbsp;</p>
<p style="text-align:justify">Indian Labour Journal, February 2013, please <a href="/upload/files/ilj_feb_2013.pdf">click here</a> to access &nbsp;</p>
<p style="text-align:justify">Wage Rates in Rural India 2003-04: Methodology for Compilation of the Wage Rate Data, Labour Bureau, please <a href="/upload/files/METHOLOGY%20FOR%20COMPILATION%20OF%20THE%20WAGE%20RATE%20DATA.pdf">click here</a> to access&nbsp; &nbsp;&nbsp;</p>
<p style="text-align:justify">Average Daily Wage Rates in Rural India: Methodology and coverage (From November 2013), Reserve Bank of India, please <a href="https://dbie.rbi.org.in">click here</a>&nbsp;and <a href="/upload/files/RBI%20note%20Average%20Daily%20Wage%20rate%20Methodology%281%29.pdf">here</a> to access&nbsp;</p>
<p style="text-align:justify">Consumer Price Index Numbers on Base 2012=100 for Rural, Urban and Combined for the month of January 2022, Ministry of Statistics and Programme Implementation (MoSPI), National Statistical Office (NSO), released on 14th February 2022, please <a href="/upload/files/CPI%20Press%20Release%20January%202022%281%29.pdf">click here</a> to access&nbsp;</p>
<p style="text-align:justify">Methodology of Data Collection Unsuited to Changing Rural Reality: A Study of Agricultural Wage Data in India -Yoshifumi Usami, Arindam Das, and Madhura Swaminathan, Review of Agrarian Studies, Vol. 10, No. 2, July-December, 2020, please <a href="http://ras.org.in/methodology_of_data_collection_unsuited_to_changing_rural_reality">click here</a> to access</p>
<p>Russia-ukraine crisis to push up fertiliser prices, govt subsidies, IANS/ Business Standard, 4 March, 2022, please <a href="https://www.business-standard.com/article/economy-policy/russia-ukraine-crisis-to-push-up-fertiliser-prices-govt-subsidies-122030400560_1.html">click here</a> to access &nbsp;</p>
<p>Cooking oil prices spike in India due to Russia-ukraine crisis -B Krishna Mohan, TelanganaToday.com, 3 March, 2022, please <a href="https://telanganatoday.com/cooking-oil-prices-spike-in-india-due-to-russia-ukraine-crisis">click here</a> to access &nbsp;</p>
<p>Govt reviews cooking oil imports as ukraine crisis disrupts supplies, prices shoot up -Amiti Sen and Prabhudutta Mishra, The Hindu Business Line, 4 March, 2022, please <a href="https://www.thehindubusinessline.com/markets/commodities/govt-reviews-cooking-oil-imports-as-ukraine-crisis-disrupts-supplies-prices-shoot-up/article65190879.ece">click here</a> to access &nbsp;</p>
<p>India&#39;s Economy Faces A Potential Stagflation Risk From Ukraine War -Sunil Prabhu, NDTV.com, 1 March, 2022, please <a href="https://www.ndtv.com/business/indias-economy-faces-a-potential-stagflation-risk-from-ukraine-war-2796624">click here</a> to access</p>
<p>India to be one of Asia&rsquo;s &lsquo;biggest losers&rsquo; from the Ukraine war as Russia slammed by global sanctions -Paran Balakrishnan, The Telegraph, 1 March, 2022, please <a href="https://www.telegraphindia.com/business/russia-ukraine-crisis-india-to-be-one-of-asias-biggest-losers-from-the-ukraine-war-as-russia-slammed-by-global-sanctions/cid/1854032">click here</a> to access</p>
<p>Crude Oil Prices Rise, Tracking Russia-Ukraine Conflict -Rahul Karunakar, NDTV.com <em>(with inputs from Agencies)</em>, 1 March, 2022, please <a href="https://www.ndtv.com/business/crude-oil-prices-rise-on-tuesday-tracking-russia-ukraine-conflict-2796187">click here</a> to access</p>
<p>Cooking Oil May Become Costlier Due to Russia-ukraine War. Know Why, News18.com, 27 February, 2022, please <a href="https://www.news18.com/news/business/markets/cooking-oil-may-become-costlier-due-to-russia-ukraine-war-know-why-4812740.html">click here</a> to access &nbsp;</p>
<p style="text-align:justify"><strong>Image Courtesy: Inclusive Media for Change/ Shambhu Ghatak</strong></p>
',
'credit_writer' => '',
'article_img' => 'Image construction worker 11 Mar 2022.jpg',
'article_img_thumb' => 'Image construction worker 11 Mar 2022.jpg',
'status' => (int) 1,
'show_on_home' => (int) 1,
'lang' => 'EN',
'category_id' => (int) 4,
'tag_keyword' => '',
'seo_url' => 'real-wage-rates-of-the-rural-workers-hardly-increased-during-the-past-6-years',
'meta_title' => '',
'meta_keywords' => '',
'meta_description' => '',
'noindex' => (int) 1,
'publish_date' => object(Cake\I18n\FrozenDate) {},
'most_visit_section_id' => null,
'article_big_img' => null,
'liveid' => null,
'created' => object(Cake\I18n\FrozenTime) {},
'modified' => object(Cake\I18n\FrozenTime) {},
'edate' => '',
'tags' => [
(int) 0 => object(Cake\ORM\Entity) {},
(int) 1 => object(Cake\ORM\Entity) {},
(int) 2 => object(Cake\ORM\Entity) {},
(int) 3 => object(Cake\ORM\Entity) {},
(int) 4 => object(Cake\ORM\Entity) {},
(int) 5 => object(Cake\ORM\Entity) {},
(int) 6 => object(Cake\ORM\Entity) {},
(int) 7 => object(Cake\ORM\Entity) {},
(int) 8 => object(Cake\ORM\Entity) {},
(int) 9 => object(Cake\ORM\Entity) {},
(int) 10 => object(Cake\ORM\Entity) {},
(int) 11 => object(Cake\ORM\Entity) {},
(int) 12 => object(Cake\ORM\Entity) {},
(int) 13 => object(Cake\ORM\Entity) {},
(int) 14 => object(Cake\ORM\Entity) {},
(int) 15 => object(Cake\ORM\Entity) {},
(int) 16 => object(Cake\ORM\Entity) {}
],
'category' => object(App\Model\Entity\Category) {},
'[new]' => false,
'[accessible]' => [
'*' => true,
'id' => false
],
'[dirty]' => [],
'[original]' => [],
'[virtual]' => [],
'[hasErrors]' => false,
'[errors]' => [],
'[invalid]' => [],
'[repository]' => 'Articles'
}
$articleid = (int) 62349
$metaTitle = 'NEWS ALERTS | Real wage rates of the rural workers hardly increased during the last 6 years'
$metaKeywords = 'Construction Workers,Consumer Price Index,CPI Rural,CPI Urban,Farm Labourers,Farm Workers,Food Inflation,Food Prices,Fuel Inflation,Fuel Prices,Nominal Wage Rate,Non-Farm Labourers,Non-Farm Workers,Real Wage Growth,Real Wages,Retail Inflation,Rural Workers'
$metaDesc = 'In the absence of income or expenditure-based headcount ratio, the growth in the real wages (i.e., nominal wages adjusted against retail inflation) of the manual workers is considered to be a good proxy to assess the trends in poverty. This...'
$disp = '<p style="text-align:justify">In the absence of income or expenditure-based headcount ratio, the growth in the real wages <em>(i.e., nominal wages adjusted against retail inflation)</em> of the manual workers is considered to be a good proxy to assess the trends in poverty. This is because the manual, unskilled/ semi-skilled labourers exist at the bottom of the pyramid or economic hierarchy, and most of them belong to the social categories Scheduled Castes (SCs) and Scheduled Tribes (STs). A positive growth in their real wages <em>(or real wage rates) </em>is anticipated to improve their purchasing power <em>(i.e., income or consumption expenditure)</em> and lift them out of the poverty trap. &nbsp;</p><p style="text-align:justify">Clearly, there exists inter-state differences in nominal wage rates, growth in nominal wage rates and growth in real wage rates, which we will see in this news alert.&nbsp;</p><p style="text-align:justify">Against the backdrop of the <a href="https://www.thehindubusinessline.com/markets/commodities/govt-reviews-cooking-oil-imports-as-ukraine-crisis-disrupts-supplies-prices-shoot-up/article65190879.ece" title="https://www.thehindubusinessline.com/markets/commodities/govt-reviews-cooking-oil-imports-as-ukraine-crisis-disrupts-supplies-prices-shoot-up/article65190879.ece">Russia-Ukraine conflict</a>, which is anticipated to cause both <a href="https://www.ndtv.com/business/indias-economy-faces-a-potential-stagflation-risk-from-ukraine-war-2796624" title="https://www.ndtv.com/business/indias-economy-faces-a-potential-stagflation-risk-from-ukraine-war-2796624">food and fuel retail inflation</a> in India in the coming times, it is even more important to look at the past trends in wage rate growth of the rural workers. It should be noted that the <a href="https://public.flourish.studio/visualisation/8706137" title="https://public.flourish.studio/visualisation/8706137">year-on-year inflation</a> in <a href="https://public.flourish.studio/visualisation/8706137" title="https://public.flourish.studio/visualisation/8706137">Consumer</a> <a href="https://public.flourish.studio/visualisation/8706137" title="https://public.flourish.studio/visualisation/8706137">Price Index Rural</a> exceeded the <a href="https://public.flourish.studio/visualisation/8706137" title="https://public.flourish.studio/visualisation/8706137">year-on-year inflation</a> in <a href="https://public.flourish.studio/visualisation/8706137" title="https://public.flourish.studio/visualisation/8706137">CPI Urban</a> during January 2022 at the national level. Even before the beginning of Russia-Ukraine conflict <em>(i.e., during January 2022)</em>, in rural areas, <a href="https://im4change.org/upload/files/CPI%20Press%20Release%20January%202022%281%29.pdf" title="https://im4change.org/upload/files/CPI%20Press%20Release%20January%202022%281%29.pdf">retail inflation rate of 20.6 percent</a> was noticed for &#39;oils and fats&#39;, aside from&nbsp;<a href="https://im4change.org/upload/files/CPI%20Press%20Release%20January%202022%281%29.pdf" title="https://im4change.org/upload/files/CPI%20Press%20Release%20January%202022%281%29.pdf">8.44 percent retail inflation for &#39;fuel and light&#39;</a>, <a href="https://im4change.org/upload/files/CPI%20Press%20Release%20January%202022%281%29.pdf" title="https://im4change.org/upload/files/CPI%20Press%20Release%20January%202022%281%29.pdf">8.27 percent</a> for &#39;transport and communication&#39;, and <a href="https://im4change.org/upload/files/CPI%20Press%20Release%20January%202022%281%29.pdf" title="https://im4change.org/upload/files/CPI%20Press%20Release%20January%202022%281%29.pdf">9.65 percent for &#39;clothing and footwear&#39;</a>.&nbsp; &nbsp;&nbsp;</p><p style="text-align:justify">At the national level, the average daily nominal wage rate&nbsp;for male construction workers in rural areas during the period from 2014-15 to 2020-21 was Rs. 316.9, which was greater than that of the male non-farm workers in rural areas. The average daily nominal wage rate&nbsp;for male non-agricultural labourers in rural areas during the period from 2014-15 to 2020-21 was Rs. 273.8, which exceeded the average daily nominal wage rates for male farm labourers in rural areas <em>(i.e., Rs. 265.1)</em>. However, in Andhra Pradesh, Haryana, Himachal Pradesh, Jammu and Kashmir,&nbsp;Karnataka, Kerala, Meghalaya, Punjab, and Tripura, the average daily nominal wage rates for male agricultural labourers in rural areas during the period from 2014-15 to 2020-21 exceeded the average daily nominal wage rates for male non-farm labourers in rural areas. Please see chart-1.</p><p style="text-align:justify"><img alt="" src="/upload/images/Chart%201.png" style="height:670px; width:1000px" /></p><p style="text-align:justify"><em><strong>Notes:</strong> The average (i.e., arithmetic mean) daily nominal wage rates for various categories of workers in rural India in the period from 2014-15 to 2020-21 has been calculated by the Inclusive Media for Change staff</em></p><p style="text-align:justify"><em>Please <a href="https://docs.google.com/spreadsheets/d/1avu0-WtaKV2RHXtz2eiP7iS8znGVBdKC/edit?usp=sharing&amp;ouid=112233925171588304692&amp;rtpof=true&amp;sd=true" title="https://docs.google.com/spreadsheets/d/1avu0-WtaKV2RHXtz2eiP7iS8znGVBdKC/edit?usp=sharing&amp;ouid=112233925171588304692&amp;rtpof=true&amp;sd=true">click here</a> to access the data in spreadsheet format</em></p><p style="text-align:justify"><em><strong>Source:&nbsp;</strong>Handbook of Statistics on Indian States 2020-21, released in November 2021, please <a href="https://m.rbi.org.in/scripts/AnnualPublications.aspx?head=Handbook%20of%20Statistics%20on%20Indian%20States" title="https://m.rbi.org.in/scripts/AnnualPublications.aspx?head=Handbook%20of%20Statistics%20on%20Indian%20States">click here</a> to access</em></p><p style="text-align:justify"><em>State-wise Average Daily Wage Rates in Rural India (Men - General Agricultural Labourers), RBI Handbook of Statistics on Indian States 2020-21, released in November 2021, please <a href="/upload/files/State-wise%20Average%20Daily%20Wage%20Rates%20in%20Rural%20India%20Men%20-%20General%20Agricultural%20Labourers.PDF" title="/upload/files/State-wise%20Average%20Daily%20Wage%20Rates%20in%20Rural%20India%20Men%20-%20General%20Agricultural%20Labourers.PDF">click here</a> to access&nbsp;</em></p><p style="text-align:justify"><em>State-wise Average Daily Wage Rates in Rural India (Men - Non-Agricultural Labourers), RBI Handbook of Statistics on Indian States 2020-21, released in November 2021, please <a href="/upload/files/State-wise%20Average%20Daily%20Wage%20Rates%20in%20Rural%20India%20Men%20-%20Non%20Agricultural%20Labourers.PDF" title="/upload/files/State-wise%20Average%20Daily%20Wage%20Rates%20in%20Rural%20India%20Men%20-%20Non%20Agricultural%20Labourers.PDF">click here</a> to access&nbsp;</em></p><p style="text-align:justify"><em>State-wise Average Daily Wage Rates in Rural India (Men - Construction Workers), RBI Handbook of Statistics on Indian States 2020-21, released in November 2021, please <a href="/upload/files/State-wise%20Average%20Daily%20Wage%20Rates%20in%20Rural%20India%20Men%20-%20Construction%20Workers.PDF" title="/upload/files/State-wise%20Average%20Daily%20Wage%20Rates%20in%20Rural%20India%20Men%20-%20Construction%20Workers.PDF">click here</a> to access&nbsp;</em></p><p style="text-align:justify"><em>State-wise Average Inflation (CPI) - Inflation, RBI Handbook of Statistics on Indian States 2020-21, released in November 2021, please <a href="/upload/files/State-wise%20Average%20Inflation%20CPI%20-%20Inflation.PDF" title="/upload/files/State-wise%20Average%20Inflation%20CPI%20-%20Inflation.PDF">click here</a> to access&nbsp;</em></p><p style="text-align:justify"><strong>---</strong></p><p style="text-align:justify">At the national level, the agricultural nominal wage rate&nbsp;grew faster than the non-farm wage&nbsp;rate&nbsp;on average for male labourers in rural areas during the period from 2015-16 to 2020-21. However, in states like Assam, Bihar, Haryana, Madhya Pradesh, Odisha, Punjab, and West Bengal, the non-farm nominal wage rates grew faster than the farm wage rates on average for male workers in rural areas during the period from 2015-16 to 2020-21. Please see chart-2.&nbsp;</p><p style="text-align:justify"><img alt="" src="/upload/images/Chart%202.png" style="height:653px; width:1000px" /></p><p style="text-align:justify"><em><strong>Notes: </strong>The average growth in daily nominal wage rates for various categories of workers in rural India in the period from 2015-16 to 2020-21 has been calculated by the Inclusive Media for Change staff</em></p><p style="text-align:justify"><em>Please <a href="https://docs.google.com/spreadsheets/d/1avu0-WtaKV2RHXtz2eiP7iS8znGVBdKC/edit?usp=sharing&amp;ouid=112233925171588304692&amp;rtpof=true&amp;sd=true" title="https://docs.google.com/spreadsheets/d/1avu0-WtaKV2RHXtz2eiP7iS8znGVBdKC/edit?usp=sharing&amp;ouid=112233925171588304692&amp;rtpof=true&amp;sd=true">click here</a> to access the data in spreadsheet format</em></p><p style="text-align:justify"><em><strong>Source: </strong>Same as above</em><br /><strong>---</strong></p><p style="text-align:justify">At the national level, the construction sector nominal wage rate&nbsp;grew slower than the non-agricultural wage&nbsp;rate&nbsp;on average for male labourers in rural areas during the period from 2015-16 to 2020-21. However, in states like Andhra Pradesh, Bihar, Himachal Pradesh, Maharashtra, Meghalaya, Punjab,&nbsp;Tamil Nadu, and Uttar Pradesh, the construction sector nominal wage rates grew faster than the non-farm wage rates on average for male workers in rural areas during the period from 2015-16 to 2020-21. Please take a look at chart-2. &nbsp;</p><p style="text-align:justify">At the national level, the agricultural wage rate&nbsp;in real terms grew faster than the non-farm wage rate&nbsp;on average for male labourers in rural areas during the period from 2015-16 to 2020-21. However, in states like Assam, Bihar, Haryana, Madhya Pradesh, Odisha, Punjab, and West Bengal, the non-farm wage rates in real terms grew faster than the farm wage rates on average for male workers in rural areas during the period from 2015-16 to 2020-21. Please see table-1.</p><p style="text-align:justify"><strong>Table 1: State-wise Growth in Average Daily Wage Rates in Real terms for Male Agricultural Labourers, Male Non-Agricultural Labourers, and Male Construction Workers in Rural India, in %</strong><br /><img alt="" src="/upload/images/Table%201%20State-wise%20Growth%20in%20Average%20Daily%20Wage%20Rates%20in%20Real%20terms%20for%20Male%20Agricultural%20Labourers%20Male%20Non-Agricultural%20Labourers%20and%20Male%20Construction%20Workers%20in%20Rural%20India%20in%20percent.png" style="height:539px; width:750px" /></p><p style="text-align:justify"><em><strong>Notes: </strong>The average growth in daily wage rates in real terms for various categories of workers in rural India in the period from 2015-16 to 2020-21 has been calculated by the Inclusive Media for Change staff</em></p><p style="text-align:justify"><em>Please <a href="https://docs.google.com/spreadsheets/d/1avu0-WtaKV2RHXtz2eiP7iS8znGVBdKC/edit?usp=sharing&amp;ouid=112233925171588304692&amp;rtpof=true&amp;sd=true" title="https://docs.google.com/spreadsheets/d/1avu0-WtaKV2RHXtz2eiP7iS8znGVBdKC/edit?usp=sharing&amp;ouid=112233925171588304692&amp;rtpof=true&amp;sd=true">click here</a> to access the data in spreadsheet format</em></p><p style="text-align:justify"><em><strong>Source: </strong>Same as above</em><br /><strong>---</strong></p><p style="text-align:justify">At the national level, the construction sector wage rate&nbsp;in real terms grew slower than the non-agricultural wage rate&nbsp;on average for male labourers in rural areas during the period from 2015-16 to 2020-21. However, in states like Andhra Pradesh, Bihar, Himachal Pradesh, Maharashtra, Meghalaya, Punjab, Tamil Nadu, and Uttar Pradesh, the construction sector wage rates in real terms grew faster than the non-farm wage rates on average for male workers in rural areas during the period from 2015-16 to 2020-21. Please take a look at table-1. &nbsp;</p><p style="text-align:justify">In the following paragraphs, we have discussed the trends in agricultural wage rates, non-farm wage rates, and construction sector wage rates <em>(in rural areas)</em> in detail.&nbsp;</p><p style="text-align:justify"><strong>Agricultural wages in rural areas</strong></p><p style="text-align:justify">The highest <a href="https://im4change.org/upload/files/State%20wise%20average%20daily%20nominal%20wage%20rates%20in%20rural%20india%20men%20farm%20labourers.JPG" title="https://im4change.org/upload/files/State%20wise%20average%20daily%20nominal%20wage%20rates%20in%20rural%20india%20men%20farm%20labourers.JPG">average daily nominal wage rate</a> <a href="https://im4change.org/upload/files/State%20wise%20average%20daily%20nominal%20wage%20rates%20in%20rural%20india%20men%20farm%20labourers.JPG" title="https://im4change.org/upload/files/State%20wise%20average%20daily%20nominal%20wage%20rates%20in%20rural%20india%20men%20farm%20labourers.JPG">for male agricultural labourers</a> in rural India during the period from 2014-15 to 2020-21 was found in Kerala <em>(Rs. 653.93)</em>, followed by Jammu and Kashmir <em>(Rs. 429.19)</em>, Tamil Nadu <em>(Rs. 385.6)</em>, Haryana <em>(Rs. 368.53)</em>, Himachal Pradesh <em>(Rs. 366.23)</em>, and Punjab <em>(Rs. 325.31)</em>. Please have a look at chart-1.</p><p style="text-align:justify">The lowest <a href="https://im4change.org/upload/files/State%20wise%20average%20daily%20nominal%20wage%20rates%20in%20rural%20india%20men%20farm%20labourers.JPG" title="https://im4change.org/upload/files/State%20wise%20average%20daily%20nominal%20wage%20rates%20in%20rural%20india%20men%20farm%20labourers.JPG">average daily nominal wage rate</a> <a href="https://im4change.org/upload/files/State%20wise%20average%20daily%20nominal%20wage%20rates%20in%20rural%20india%20men%20farm%20labourers.JPG" title="https://im4change.org/upload/files/State%20wise%20average%20daily%20nominal%20wage%20rates%20in%20rural%20india%20men%20farm%20labourers.JPG">for male agricultural labourers</a> in rural India during the period from 2014-15 to 2020-21 was observed in Madhya Pradesh <em>(Rs. 183.97)</em>, followed by Gujarat <em>(Rs. 190.07)</em>, Maharashtra <em>(Rs. 215.71)</em>, Odisha <em>(Rs. 216.87)</em>, Meghalaya <em>(Rs. 219.93)</em>, Bihar <em>(Rs. 230.43)</em>, Uttar Pradesh <em>(Rs. 230.5)</em>, and Assam <em>(Rs. 237.3)</em>. The related national level figure was Rs. 265.09 during the period from 2014-15 to 2020-21. Please consult chart-1.&nbsp;</p><p style="text-align:justify">The highest <a href="https://im4change.org/upload/files/State%20wise%20growth%20in%20average%20daily%20nominal%20wage%20rates%20in%20rural%20india%20men%20farm%20labourers.JPG" title="https://im4change.org/upload/files/State%20wise%20growth%20in%20average%20daily%20nominal%20wage%20rates%20in%20rural%20india%20men%20farm%20labourers.JPG">average annual growth rate in</a> <a href="https://im4change.org/upload/files/State%20wise%20growth%20in%20average%20daily%20nominal%20wage%20rates%20in%20rural%20india%20men%20farm%20labourers.JPG" title="https://im4change.org/upload/files/State%20wise%20growth%20in%20average%20daily%20nominal%20wage%20rates%20in%20rural%20india%20men%20farm%20labourers.JPG">nominal wage rates</a> during the period from 2015-16 to 2020-21 was found in Karnataka <em>(7.3 percent)</em>, followed by Andhra Pradesh <em>(6.8 percent)</em>, Madhya Pradesh <em>(6.4 percent)</em>, Uttar Pradesh <em>(6.2 percent)</em>, Odisha <em>(6.1 percent)</em>, and Meghalaya <em>(6.0 percent)</em>. Please see chart-2.</p><p style="text-align:justify">The lowest <a href="https://im4change.org/upload/files/State%20wise%20growth%20in%20average%20daily%20nominal%20wage%20rates%20in%20rural%20india%20men%20farm%20labourers.JPG" title="https://im4change.org/upload/files/State%20wise%20growth%20in%20average%20daily%20nominal%20wage%20rates%20in%20rural%20india%20men%20farm%20labourers.JPG">average annual growth rate</a> <a href="https://im4change.org/upload/files/State%20wise%20growth%20in%20average%20daily%20nominal%20wage%20rates%20in%20rural%20india%20men%20farm%20labourers.JPG" title="https://im4change.org/upload/files/State%20wise%20growth%20in%20average%20daily%20nominal%20wage%20rates%20in%20rural%20india%20men%20farm%20labourers.JPG">in nominal wage rates</a> during the same period was noticed in Haryana <em>(2.1 percent)</em>, followed by Rajasthan <em>(3.3 percent)</em>, Kerala <em>(3.5 percent)</em>, Punjab <em>(3.9 percent)</em>, and Tamil Nadu <em>(4.5 percent)</em>. Please consult chart-2.</p><p style="text-align:justify">The average annual <a href="https://im4change.org/upload/files/State%20wise%20growth%20in%20average%20daily%20wage%20rates%20in%20real%20terms%20for%20male%20farm%20labourers%20in%20rural%20India.JPG" title="https://im4change.org/upload/files/State%20wise%20growth%20in%20average%20daily%20wage%20rates%20in%20real%20terms%20for%20male%20farm%20labourers%20in%20rural%20India.JPG">growth of agricultural labourers&rsquo;</a> <a href="https://im4change.org/upload/files/State%20wise%20growth%20in%20average%20daily%20wage%20rates%20in%20real%20terms%20for%20male%20farm%20labourers%20in%20rural%20India.JPG" title="https://im4change.org/upload/files/State%20wise%20growth%20in%20average%20daily%20wage%20rates%20in%20real%20terms%20for%20male%20farm%20labourers%20in%20rural%20India.JPG">wage rates in real terms</a> during the period from 2015-16 to 2020-21 were negative in Haryana <em>(-2.1 percent)</em>, Jammu and Kashmir <em>(-0.3 percent)</em>, Kerala <em>(-1.7 percent)</em>, Punjab <em>(-0.4 percent)</em>, Rajasthan <em>(-1.1 percent)</em>, Tamil Nadu <em>(-0.8 percent)</em>, Tripura <em>(-0.5 percent)</em>, and West Bengal <em>(-0.1 percent)</em>. It should be noted that the <a href="https://im4change.org/upload/files/State-wise%20Average%20Inflation%20CPI%20-%20Inflation.PDF" title="https://im4change.org/upload/files/State-wise%20Average%20Inflation%20CPI%20-%20Inflation.PDF">rate of inflation</a> in <a href="https://im4change.org/upload/files/State-wise%20Average%20Inflation%20CPI%20-%20Inflation.PDF" title="https://im4change.org/upload/files/State-wise%20Average%20Inflation%20CPI%20-%20Inflation.PDF">Consumer Price Index-General</a> has been used to get the average annual growth of agricultural labourers&rsquo; wage rates in real terms. Kindly consult table-1. &nbsp;</p><p style="text-align:justify">Some states witnessed negative <a href="https://im4change.org/upload/files/State%20wise%20growth%20in%20average%20daily%20wage%20rates%20in%20real%20terms%20for%20male%20farm%20labourers%20in%20rural%20India.JPG" title="https://im4change.org/upload/files/State%20wise%20growth%20in%20average%20daily%20wage%20rates%20in%20real%20terms%20for%20male%20farm%20labourers%20in%20rural%20India.JPG">growth in agricultural labourers&rsquo;</a> <a href="https://im4change.org/upload/files/State%20wise%20growth%20in%20average%20daily%20wage%20rates%20in%20real%20terms%20for%20male%20farm%20labourers%20in%20rural%20India.JPG" title="https://im4change.org/upload/files/State%20wise%20growth%20in%20average%20daily%20wage%20rates%20in%20real%20terms%20for%20male%20farm%20labourers%20in%20rural%20India.JPG">wage rates in real terms</a> for more than two years between 2015-16 and 2020-21. For example, <a href="https://im4change.org/upload/files/State%20wise%20growth%20in%20average%20daily%20wage%20rates%20in%20real%20terms%20for%20male%20farm%20labourers%20in%20rural%20India.JPG" title="https://im4change.org/upload/files/State%20wise%20growth%20in%20average%20daily%20wage%20rates%20in%20real%20terms%20for%20male%20farm%20labourers%20in%20rural%20India.JPG">Haryana</a> experienced negative growth in 2015-16, 2016-17, 2017-18, 2019-20, and 2020-21. Likewise, <a href="https://im4change.org/upload/files/State%20wise%20growth%20in%20average%20daily%20wage%20rates%20in%20real%20terms%20for%20male%20farm%20labourers%20in%20rural%20India.JPG" title="https://im4change.org/upload/files/State%20wise%20growth%20in%20average%20daily%20wage%20rates%20in%20real%20terms%20for%20male%20farm%20labourers%20in%20rural%20India.JPG">Kerala</a> faced negative growth in 2017-18, 2018-19, 2019-20, and 2020-21. &nbsp;</p><p style="text-align:justify">At the national level, the <a href="https://im4change.org/upload/files/State%20wise%20growth%20in%20average%20daily%20wage%20rates%20in%20real%20terms%20for%20male%20farm%20labourers%20in%20rural%20India.JPG" title="https://im4change.org/upload/files/State%20wise%20growth%20in%20average%20daily%20wage%20rates%20in%20real%20terms%20for%20male%20farm%20labourers%20in%20rural%20India.JPG">agricultural labourers&rsquo;</a> <a href="https://im4change.org/upload/files/State%20wise%20growth%20in%20average%20daily%20wage%20rates%20in%20real%20terms%20for%20male%20farm%20labourers%20in%20rural%20India.JPG" title="https://im4change.org/upload/files/State%20wise%20growth%20in%20average%20daily%20wage%20rates%20in%20real%20terms%20for%20male%20farm%20labourers%20in%20rural%20India.JPG">wage rates in real terms</a> on average grew by 1.0 percent annually during the period from 2015-16 to 2020-21.</p><p style="text-align:justify">Please <a href="https://docs.google.com/spreadsheets/d/1avu0-WtaKV2RHXtz2eiP7iS8znGVBdKC/edit?usp=sharing&amp;ouid=112233925171588304692&amp;rtpof=true&amp;sd=true" title="https://docs.google.com/spreadsheets/d/1avu0-WtaKV2RHXtz2eiP7iS8znGVBdKC/edit?usp=sharing&amp;ouid=112233925171588304692&amp;rtpof=true&amp;sd=true">click here</a> to access the spreadsheet in order to look at the trends in <a href="/upload/files/State%20wise%20average%20daily%20nominal%20wage%20rates%20in%20rural%20india%20men%20farm%20labourers.JPG" title="/upload/files/State%20wise%20average%20daily%20nominal%20wage%20rates%20in%20rural%20india%20men%20farm%20labourers.JPG">nominal wage rates</a>, <a href="/upload/files/State%20wise%20growth%20in%20average%20daily%20nominal%20wage%20rates%20in%20rural%20india%20men%20farm%20labourers.JPG" title="/upload/files/State%20wise%20growth%20in%20average%20daily%20nominal%20wage%20rates%20in%20rural%20india%20men%20farm%20labourers.JPG">annual growth in nominal wage rates</a> and <a href="/upload/files/State%20wise%20growth%20in%20average%20daily%20wage%20rates%20in%20real%20terms%20for%20male%20farm%20labourers%20in%20rural%20India.JPG" title="/upload/files/State%20wise%20growth%20in%20average%20daily%20wage%20rates%20in%20real%20terms%20for%20male%20farm%20labourers%20in%20rural%20India.JPG">annual growth in real wage rates</a> for farm labourers in rural areas.&nbsp;</p><p style="text-align:justify"><strong>Non-agricultural wages in rural areas</strong></p><p style="text-align:justify">The rural economy is not just about farming any longer. That is why we have looked at the wage growth in the non-farm sector too.&nbsp;The highest <a href="https://im4change.org/upload/files/State%20wise%20average%20daily%20nominal%20wage%20rates%20in%20rural%20india%20men%20non%20farm%20labourers.JPG" title="https://im4change.org/upload/files/State%20wise%20average%20daily%20nominal%20wage%20rates%20in%20rural%20india%20men%20non%20farm%20labourers.JPG">average daily nominal wage rate for male</a> <a href="https://im4change.org/upload/files/State%20wise%20average%20daily%20nominal%20wage%20rates%20in%20rural%20india%20men%20non%20farm%20labourers.JPG" title="https://im4change.org/upload/files/State%20wise%20average%20daily%20nominal%20wage%20rates%20in%20rural%20india%20men%20non%20farm%20labourers.JPG">non-agricultural labourers</a> in rural India during the period from 2014-15 to 2020-21 was detected in Kerala <em>(Rs. 639.01)</em>, followed by Jammu and Kashmir <em>(Rs. 426.37)</em>, Tamil Nadu <em>(Rs. 405.77)</em>, Haryana <em>(Rs. 359.24)</em>, Himachal Pradesh <em>(Rs. 311.10)</em>, and Punjab <em>(Rs. 309.09)</em>. Please see chart-1.</p><p style="text-align:justify">The lowest average <a href="https://im4change.org/upload/files/State%20wise%20average%20daily%20nominal%20wage%20rates%20in%20rural%20india%20men%20non%20farm%20labourers.JPG" title="https://im4change.org/upload/files/State%20wise%20average%20daily%20nominal%20wage%20rates%20in%20rural%20india%20men%20non%20farm%20labourers.JPG">daily nominal wage rate for male</a> <a href="https://im4change.org/upload/files/State%20wise%20average%20daily%20nominal%20wage%20rates%20in%20rural%20india%20men%20non%20farm%20labourers.JPG" title="https://im4change.org/upload/files/State%20wise%20average%20daily%20nominal%20wage%20rates%20in%20rural%20india%20men%20non%20farm%20labourers.JPG">non-agricultural labourers in rural India</a> during the period from 2014-15 to 2020-21 was found in Madhya Pradesh <em>(Rs. 191.47)</em>, followed by Meghalaya <em>(Rs. 210.26)</em>, Gujarat <em>(Rs. 213.51)</em>, Odisha <em>(Rs. 218.06)</em>, Maharashtra <em>(Rs. 226.70)</em>, Tripura <em>(Rs. 230.36)</em>, Bihar <em>(Rs. 243.51)</em>, and Uttar Pradesh <em>(Rs. 243.97)</em>. The related national level figure was Rs. 273.79 during the period from 2014-15 to 2020-21. Please see chart-1.</p><p style="text-align:justify">The highest <a href="https://im4change.org/upload/files/State%20wise%20growth%20in%20average%20daily%20nominal%20wage%20rates%20in%20rural%20india%20men%20non%20farm%20labourers.JPG" title="https://im4change.org/upload/files/State%20wise%20growth%20in%20average%20daily%20nominal%20wage%20rates%20in%20rural%20india%20men%20non%20farm%20labourers.JPG">average annual growth rate in</a> <a href="https://im4change.org/upload/files/State%20wise%20growth%20in%20average%20daily%20nominal%20wage%20rates%20in%20rural%20india%20men%20non%20farm%20labourers.JPG" title="https://im4change.org/upload/files/State%20wise%20growth%20in%20average%20daily%20nominal%20wage%20rates%20in%20rural%20india%20men%20non%20farm%20labourers.JPG">nominal wage rates</a> during the period from 2015-16 to 2020-21 was noticed in Odisha <em>(8.0 percent)</em>, followed by Madhya Pradesh <em>(7.6 percent)</em>, Assam <em>(6.6 percent)</em>, West Bengal <em>(5.9 percent)</em>, Uttar Pradesh and Andhra Pradesh <em>(5.6 percent each)</em>, and Bihar <em>(5.5 percent)</em>. Kindly consult chart-2.</p><p style="text-align:justify">The lowest <a href="https://im4change.org/upload/files/State%20wise%20growth%20in%20average%20daily%20nominal%20wage%20rates%20in%20rural%20india%20men%20non%20farm%20labourers.JPG" title="https://im4change.org/upload/files/State%20wise%20growth%20in%20average%20daily%20nominal%20wage%20rates%20in%20rural%20india%20men%20non%20farm%20labourers.JPG">average annual growth rate</a> <a href="https://im4change.org/upload/files/State%20wise%20growth%20in%20average%20daily%20nominal%20wage%20rates%20in%20rural%20india%20men%20non%20farm%20labourers.JPG" title="https://im4change.org/upload/files/State%20wise%20growth%20in%20average%20daily%20nominal%20wage%20rates%20in%20rural%20india%20men%20non%20farm%20labourers.JPG">in nominal wage rates</a> during the same period was observed in Kerala <em>(1.8 percent)</em>, followed by Haryana <em>(2.4 percent)</em>, Meghalaya <em>(2.8 percent)</em>, Tamil Nadu and Rajasthan <em>(3.2 percent each)</em>, Tripura and Jammu and Kashmir <em>(4.0 percent each),</em> and Maharashtra and Punjab <em>(4.2 percent each)</em>. Kindly consult chart-2.&nbsp;</p><p style="text-align:justify">The average annual <a href="https://im4change.org/upload/files/State%20wise%20growth%20in%20average%20daily%20wage%20rates%20in%20real%20terms%20for%20male%20non%20farm%20labourers%20in%20rural%20India.JPG" title="https://im4change.org/upload/files/State%20wise%20growth%20in%20average%20daily%20wage%20rates%20in%20real%20terms%20for%20male%20non%20farm%20labourers%20in%20rural%20India.JPG">growth of non-agricultural labourers&rsquo;</a> <a href="https://im4change.org/upload/files/State%20wise%20growth%20in%20average%20daily%20wage%20rates%20in%20real%20terms%20for%20male%20non%20farm%20labourers%20in%20rural%20India.JPG" title="https://im4change.org/upload/files/State%20wise%20growth%20in%20average%20daily%20wage%20rates%20in%20real%20terms%20for%20male%20non%20farm%20labourers%20in%20rural%20India.JPG">wage rates in real terms</a> during the period from 2015-16 to 2020-21 were negative in Haryana <em>(-1.9 percent)</em>, Jammu and Kashmir <em>(-1.7 percent)</em>, Kerala <em>(-3.5 percent)</em>, Maharashtra <em>(-0.3 percent)</em>, Meghalaya <em>(-1.2 percent)</em>, Punjab <em>(-0.1 percent)</em>, Rajasthan <em>(-1.2 percent)</em>, Tamil Nadu <em>(-2.1 percent)</em>, and Tripura <em>(-1.1 percent)</em>. It should be noted that the <a href="https://im4change.org/upload/files/State-wise%20Average%20Inflation%20CPI%20-%20Inflation.PDF" title="https://im4change.org/upload/files/State-wise%20Average%20Inflation%20CPI%20-%20Inflation.PDF">rate of inflation</a> in <a href="https://im4change.org/upload/files/State-wise%20Average%20Inflation%20CPI%20-%20Inflation.PDF" title="https://im4change.org/upload/files/State-wise%20Average%20Inflation%20CPI%20-%20Inflation.PDF">CPI-General</a> has been used to get the average annual growth of non-agricultural labourers&rsquo; wage rates in real terms. Kindly have a look at table-1. &nbsp;&nbsp;</p><p style="text-align:justify">Some states experienced negative growth in <a href="https://im4change.org/upload/files/State%20wise%20growth%20in%20average%20daily%20wage%20rates%20in%20real%20terms%20for%20male%20non%20farm%20labourers%20in%20rural%20India.JPG" title="https://im4change.org/upload/files/State%20wise%20growth%20in%20average%20daily%20wage%20rates%20in%20real%20terms%20for%20male%20non%20farm%20labourers%20in%20rural%20India.JPG">non-agricultural labourers&rsquo; wage</a> <a href="https://im4change.org/upload/files/State%20wise%20growth%20in%20average%20daily%20wage%20rates%20in%20real%20terms%20for%20male%20non%20farm%20labourers%20in%20rural%20India.JPG" title="https://im4change.org/upload/files/State%20wise%20growth%20in%20average%20daily%20wage%20rates%20in%20real%20terms%20for%20male%20non%20farm%20labourers%20in%20rural%20India.JPG">rates in real terms</a> for more than two years between 2015-16 and 2020-21. For example, <a href="https://im4change.org/upload/files/State%20wise%20growth%20in%20average%20daily%20wage%20rates%20in%20real%20terms%20for%20male%20non%20farm%20labourers%20in%20rural%20India.JPG" title="https://im4change.org/upload/files/State%20wise%20growth%20in%20average%20daily%20wage%20rates%20in%20real%20terms%20for%20male%20non%20farm%20labourers%20in%20rural%20India.JPG">Haryana</a> experienced negative <a href="https://im4change.org/upload/files/State%20wise%20growth%20in%20average%20daily%20wage%20rates%20in%20real%20terms%20for%20male%20non%20farm%20labourers%20in%20rural%20India.JPG" title="https://im4change.org/upload/files/State%20wise%20growth%20in%20average%20daily%20wage%20rates%20in%20real%20terms%20for%20male%20non%20farm%20labourers%20in%20rural%20India.JPG">growth in wage rates</a> <a href="https://im4change.org/upload/files/State%20wise%20growth%20in%20average%20daily%20wage%20rates%20in%20real%20terms%20for%20male%20non%20farm%20labourers%20in%20rural%20India.JPG" title="https://im4change.org/upload/files/State%20wise%20growth%20in%20average%20daily%20wage%20rates%20in%20real%20terms%20for%20male%20non%20farm%20labourers%20in%20rural%20India.JPG">(in real terms)</a> during 2016-17, 2017-18, 2018-19, 2019-20, and 2020-21. Likewise, <a href="https://im4change.org/upload/files/State%20wise%20growth%20in%20average%20daily%20wage%20rates%20in%20real%20terms%20for%20male%20non%20farm%20labourers%20in%20rural%20India.JPG" title="https://im4change.org/upload/files/State%20wise%20growth%20in%20average%20daily%20wage%20rates%20in%20real%20terms%20for%20male%20non%20farm%20labourers%20in%20rural%20India.JPG">Kerala</a> faced negative growth rates in 2015-16, 2016-17, 2017-18, 2019-20, and 2020-21. &nbsp;</p><p style="text-align:justify">At the national level, the&nbsp;<a href="https://im4change.org/upload/files/State%20wise%20growth%20in%20average%20daily%20wage%20rates%20in%20real%20terms%20for%20male%20non%20farm%20labourers%20in%20rural%20India.JPG" title="https://im4change.org/upload/files/State%20wise%20growth%20in%20average%20daily%20wage%20rates%20in%20real%20terms%20for%20male%20non%20farm%20labourers%20in%20rural%20India.JPG">non-agricultural labourers&rsquo;</a> <a href="https://im4change.org/upload/files/State%20wise%20growth%20in%20average%20daily%20wage%20rates%20in%20real%20terms%20for%20male%20non%20farm%20labourers%20in%20rural%20India.JPG" title="https://im4change.org/upload/files/State%20wise%20growth%20in%20average%20daily%20wage%20rates%20in%20real%20terms%20for%20male%20non%20farm%20labourers%20in%20rural%20India.JPG">wage rates in real terms</a> on average grew by just 0.3 percent annually during the period from 2015-16 to 2020-21.&nbsp;</p><p style="text-align:justify">Please <a href="https://docs.google.com/spreadsheets/d/1avu0-WtaKV2RHXtz2eiP7iS8znGVBdKC/edit?usp=sharing&amp;ouid=112233925171588304692&amp;rtpof=true&amp;sd=true" title="https://docs.google.com/spreadsheets/d/1avu0-WtaKV2RHXtz2eiP7iS8znGVBdKC/edit?usp=sharing&amp;ouid=112233925171588304692&amp;rtpof=true&amp;sd=true">click here</a> to access the spreadsheet in order to look at the <a href="/upload/files/State%20wise%20average%20daily%20nominal%20wage%20rates%20in%20rural%20india%20men%20non%20farm%20labourers.JPG" title="/upload/files/State%20wise%20average%20daily%20nominal%20wage%20rates%20in%20rural%20india%20men%20non%20farm%20labourers.JPG">trends in nominal wage rates</a>, <a href="/upload/files/State%20wise%20growth%20in%20average%20daily%20nominal%20wage%20rates%20in%20rural%20india%20men%20non%20farm%20labourers.JPG" title="/upload/files/State%20wise%20growth%20in%20average%20daily%20nominal%20wage%20rates%20in%20rural%20india%20men%20non%20farm%20labourers.JPG">annual growth in nominal wage rates</a>, and <a href="/upload/files/State%20wise%20growth%20in%20average%20daily%20wage%20rates%20in%20real%20terms%20for%20male%20non%20farm%20labourers%20in%20rural%20India.JPG" title="/upload/files/State%20wise%20growth%20in%20average%20daily%20wage%20rates%20in%20real%20terms%20for%20male%20non%20farm%20labourers%20in%20rural%20India.JPG">annual growth in real wage rates</a> for non-farm labourers in rural areas.&nbsp;</p><p style="text-align:justify"><strong>Construction sector wages in rural areas</strong></p><p style="text-align:justify">The <a href="https://im4change.org/upload/files/State%20wise%20average%20daily%20nominal%20wage%20rates%20in%20rural%20india%20men%20construction%20workers.JPG" title="https://im4change.org/upload/files/State%20wise%20average%20daily%20nominal%20wage%20rates%20in%20rural%20india%20men%20construction%20workers.JPG">highest average daily nominal wage rates</a> <a href="https://im4change.org/upload/files/State%20wise%20average%20daily%20nominal%20wage%20rates%20in%20rural%20india%20men%20construction%20workers.JPG" title="https://im4change.org/upload/files/State%20wise%20average%20daily%20nominal%20wage%20rates%20in%20rural%20india%20men%20construction%20workers.JPG">for male construction workers in rural India</a> during the period from 2014-15 to 2020-21 was detected in Kerala <em>(Rs. 810.3)</em>, followed by Jammu and Kashmir <em>(Rs. 445.1)</em>, Tamil Nadu <em>(Rs. 424.1)</em>, Haryana <em>(Rs. 379.9)</em>, Himachal Pradesh <em>(Rs. 368.7)</em>, Rajasthan <em>(Rs. 347.7)</em>, and Punjab <em>(Rs. 339.1)</em>. Kindly see chart-1.&nbsp;</p><p style="text-align:justify">The <a href="https://im4change.org/upload/files/State%20wise%20average%20daily%20nominal%20wage%20rates%20in%20rural%20india%20men%20construction%20workers.JPG" title="https://im4change.org/upload/files/State%20wise%20average%20daily%20nominal%20wage%20rates%20in%20rural%20india%20men%20construction%20workers.JPG">lowest average daily nominal wage rates</a> <a href="https://im4change.org/upload/files/State%20wise%20average%20daily%20nominal%20wage%20rates%20in%20rural%20india%20men%20construction%20workers.JPG" title="https://im4change.org/upload/files/State%20wise%20average%20daily%20nominal%20wage%20rates%20in%20rural%20india%20men%20construction%20workers.JPG">for male construction workers in rural areas</a> during the period from 2014-15 to 2020-21 was found in Madhya Pradesh <em>(Rs. 212.4)</em>, followed by Tripura <em>(Rs. 230.4)</em>, Meghalaya <em>(Rs. 231.7)</em>, Odisha <em>(Rs. 247.1)</em>, Gujarat <em>(Rs. 251.8)</em>, Uttar Pradesh <em>(Rs. 267.4)</em>, Bihar <em>(Rs. 270.8)</em>, and West Bengal <em>(Rs. 274.0)</em>. The related national level figure was Rs. 316.9 during the period from 2014-15 to 2020-21. Kindly consult chart-1.</p><p style="text-align:justify">The <a href="https://im4change.org/upload/files/State%20wise%20growth%20in%20average%20daily%20nominal%20wage%20rates%20in%20rural%20india%20men%20construction%20workers.JPG" title="https://im4change.org/upload/files/State%20wise%20growth%20in%20average%20daily%20nominal%20wage%20rates%20in%20rural%20india%20men%20construction%20workers.JPG">highest average annual growth rates in</a> <a href="https://im4change.org/upload/files/State%20wise%20growth%20in%20average%20daily%20nominal%20wage%20rates%20in%20rural%20india%20men%20construction%20workers.JPG" title="https://im4change.org/upload/files/State%20wise%20growth%20in%20average%20daily%20nominal%20wage%20rates%20in%20rural%20india%20men%20construction%20workers.JPG">nominal wage rates</a> during the period from 2015-16 to 2020-21 was noticed in Meghalaya <em>(20.9 percent)</em>, followed by Madhya Pradesh <em>(7.4 percent)</em>, Odisha and Andhra Pradesh <em>(6.8 percent each)</em>, Uttar Pradesh <em>(6.4 percent)</em>, and Bihar <em>(6.2 percent)</em>. Please see chart-2.&nbsp;</p><p style="text-align:justify">The <a href="https://im4change.org/upload/files/State%20wise%20growth%20in%20average%20daily%20nominal%20wage%20rates%20in%20rural%20india%20men%20construction%20workers.JPG" title="https://im4change.org/upload/files/State%20wise%20growth%20in%20average%20daily%20nominal%20wage%20rates%20in%20rural%20india%20men%20construction%20workers.JPG">lowest average annual growth rates in</a> <a href="https://im4change.org/upload/files/State%20wise%20growth%20in%20average%20daily%20nominal%20wage%20rates%20in%20rural%20india%20men%20construction%20workers.JPG" title="https://im4change.org/upload/files/State%20wise%20growth%20in%20average%20daily%20nominal%20wage%20rates%20in%20rural%20india%20men%20construction%20workers.JPG">nominal wage rates</a> during the same period was observed in Kerala <em>(0.9 percent)</em>, followed by Manipur <em>(2.0 percent)</em>, Haryana <em>(2.1 percent)</em>, Jammu and Kashmir <em>(3.0 percent)</em>, Rajasthan <em>(3.2 percent)</em>, and Gujarat <em>(3.6 percent)</em>. Please see chart-2.</p><p style="text-align:justify">The <a href="https://im4change.org/upload/files/State%20wise%20growth%20in%20average%20daily%20wage%20rates%20in%20real%20terms%20for%20male%20construction%20workers%20in%20rural%20India%281%29.JPG" title="https://im4change.org/upload/files/State%20wise%20growth%20in%20average%20daily%20wage%20rates%20in%20real%20terms%20for%20male%20construction%20workers%20in%20rural%20India%281%29.JPG">average annual growth of construction workers&rsquo;</a> <a href="https://im4change.org/upload/files/State%20wise%20growth%20in%20average%20daily%20wage%20rates%20in%20real%20terms%20for%20male%20construction%20workers%20in%20rural%20India%281%29.JPG" title="https://im4change.org/upload/files/State%20wise%20growth%20in%20average%20daily%20wage%20rates%20in%20real%20terms%20for%20male%20construction%20workers%20in%20rural%20India%281%29.JPG">wage rates in real terms</a> during the period from 2015-16 to 2020-21 was negative in Assam <em>(-1.2 percent)</em>, Haryana <em>(-2.1 percent)</em>, Jammu and Kashmir <em>(-2.7 percent)</em>, Karnataka <em>(-0.6 percent)</em>, Kerala <em>(-4.4 percent)</em>, Manipur <em>(-6.3 percent)</em>, Rajasthan <em>(-1.2 percent)</em>, Tamil Nadu <em>(-0.9 percent)</em>, and Tripura <em>(-1.1 percent)</em>. Please note that the <a href="https://im4change.org/upload/files/State-wise%20Average%20Inflation%20CPI%20-%20Inflation.PDF" title="https://im4change.org/upload/files/State-wise%20Average%20Inflation%20CPI%20-%20Inflation.PDF">rate of inflation</a> in <a href="https://im4change.org/upload/files/State-wise%20Average%20Inflation%20CPI%20-%20Inflation.PDF" title="https://im4change.org/upload/files/State-wise%20Average%20Inflation%20CPI%20-%20Inflation.PDF">CPI-General</a> has been used to get the average annual growth of construction workers&rsquo; wage rates in real terms. Kindly have a look at table-1. &nbsp;&nbsp;</p><p style="text-align:justify">In the case of Meghalaya, the <a href="https://im4change.org/upload/files/State%20wise%20average%20daily%20nominal%20wage%20rates%20in%20rural%20india%20men%20construction%20workers.JPG" title="https://im4change.org/upload/files/State%20wise%20average%20daily%20nominal%20wage%20rates%20in%20rural%20india%20men%20construction%20workers.JPG">nominal daily wage rate of male construction</a> <a href="https://im4change.org/upload/files/State%20wise%20average%20daily%20nominal%20wage%20rates%20in%20rural%20india%20men%20construction%20workers.JPG" title="https://im4change.org/upload/files/State%20wise%20average%20daily%20nominal%20wage%20rates%20in%20rural%20india%20men%20construction%20workers.JPG">workers</a> fell from Rs. 186.0 in 2016-17 to Rs. 100.0 in 2017-18 i.e., a decline&nbsp;by -46.2 percent over previous year. However, the same bounced back to Rs. 273.2 in 2018-19 i.e., an increase by 173.2 percent over previous year. In <a href="https://im4change.org/upload/files/State%20wise%20growth%20in%20average%20daily%20wage%20rates%20in%20real%20terms%20for%20male%20construction%20workers%20in%20rural%20India%281%29.JPG" title="https://im4change.org/upload/files/State%20wise%20growth%20in%20average%20daily%20wage%20rates%20in%20real%20terms%20for%20male%20construction%20workers%20in%20rural%20India%281%29.JPG">real terms, the construction sector</a> <a href="https://im4change.org/upload/files/State%20wise%20growth%20in%20average%20daily%20wage%20rates%20in%20real%20terms%20for%20male%20construction%20workers%20in%20rural%20India%281%29.JPG" title="https://im4change.org/upload/files/State%20wise%20growth%20in%20average%20daily%20wage%20rates%20in%20real%20terms%20for%20male%20construction%20workers%20in%20rural%20India%281%29.JPG">wage rate in Meghalaya</a> grew by -47.7 percent in 2017-18 <em>(over previous year)</em> and 171.0 percent in 2018-19 <em>(over previous year)</em>.</p><p style="text-align:justify">Some states experienced negative <a href="https://im4change.org/upload/files/State%20wise%20growth%20in%20average%20daily%20wage%20rates%20in%20real%20terms%20for%20male%20construction%20workers%20in%20rural%20India%281%29.JPG" title="https://im4change.org/upload/files/State%20wise%20growth%20in%20average%20daily%20wage%20rates%20in%20real%20terms%20for%20male%20construction%20workers%20in%20rural%20India%281%29.JPG">growth in construction workers&rsquo;</a> <a href="https://im4change.org/upload/files/State%20wise%20growth%20in%20average%20daily%20wage%20rates%20in%20real%20terms%20for%20male%20construction%20workers%20in%20rural%20India%281%29.JPG" title="https://im4change.org/upload/files/State%20wise%20growth%20in%20average%20daily%20wage%20rates%20in%20real%20terms%20for%20male%20construction%20workers%20in%20rural%20India%281%29.JPG">wage rates in real terms</a> for more than two years between 2015-16 and 2020-21. For example, <a href="https://im4change.org/upload/files/State%20wise%20growth%20in%20average%20daily%20wage%20rates%20in%20real%20terms%20for%20male%20construction%20workers%20in%20rural%20India%281%29.JPG" title="https://im4change.org/upload/files/State%20wise%20growth%20in%20average%20daily%20wage%20rates%20in%20real%20terms%20for%20male%20construction%20workers%20in%20rural%20India%281%29.JPG">Assam</a> experienced negative growth in wage rates <em>(in real terms)</em> during 2017-18, 2018-19, 2019-20, and 2020-21. &nbsp;</p><p style="text-align:justify">At the national level, the&nbsp;<a href="https://im4change.org/upload/files/State%20wise%20growth%20in%20average%20daily%20wage%20rates%20in%20real%20terms%20for%20male%20construction%20workers%20in%20rural%20India%281%29.JPG" title="https://im4change.org/upload/files/State%20wise%20growth%20in%20average%20daily%20wage%20rates%20in%20real%20terms%20for%20male%20construction%20workers%20in%20rural%20India%281%29.JPG">construction workers&rsquo; wage rates in real terms</a> on average grew by just 0.1 percent annually during the period from 2015-16 to 2020-21.</p><p style="text-align:justify">Kindly <a href="https://docs.google.com/spreadsheets/d/1avu0-WtaKV2RHXtz2eiP7iS8znGVBdKC/edit?usp=sharing&amp;ouid=112233925171588304692&amp;rtpof=true&amp;sd=true" title="https://docs.google.com/spreadsheets/d/1avu0-WtaKV2RHXtz2eiP7iS8znGVBdKC/edit?usp=sharing&amp;ouid=112233925171588304692&amp;rtpof=true&amp;sd=true">click here</a> to access the spreadsheet in order to look at the <a href="/upload/files/State%20wise%20average%20daily%20nominal%20wage%20rates%20in%20rural%20india%20men%20construction%20workers.JPG" title="/upload/files/State%20wise%20average%20daily%20nominal%20wage%20rates%20in%20rural%20india%20men%20construction%20workers.JPG">trends in nominal wage rates</a>, <a href="/upload/files/State%20wise%20growth%20in%20average%20daily%20nominal%20wage%20rates%20in%20rural%20india%20men%20construction%20workers.JPG" title="/upload/files/State%20wise%20growth%20in%20average%20daily%20nominal%20wage%20rates%20in%20rural%20india%20men%20construction%20workers.JPG">annual growth in nominal wage rates</a>, and <a href="/upload/files/State%20wise%20growth%20in%20average%20daily%20wage%20rates%20in%20real%20terms%20for%20male%20construction%20workers%20in%20rural%20India%281%29.JPG" title="/upload/files/State%20wise%20growth%20in%20average%20daily%20wage%20rates%20in%20real%20terms%20for%20male%20construction%20workers%20in%20rural%20India%281%29.JPG">annual growth in real wage rates</a> for construction workers in rural areas.&nbsp;</p><p style="text-align:justify"><strong>Data collection methodology</strong></p><p style="text-align:justify">As a part of Rural Labour Enquiry, the&nbsp;<a href="https://im4change.org/upload/files/ilj_feb_2013.pdf" title="https://im4change.org/upload/files/ilj_feb_2013.pdf">daily wage rates</a> in respect of eighteen agricultural and non-agricultural occupations are being collected along with rural retail price data by the Field Operations Division of the National Sample Survey Organisation since 1986-87, according to a February 2013 <a href="https://im4change.org/upload/files/ilj_feb_2013.pdf" title="https://im4change.org/upload/files/ilj_feb_2013.pdf">edition of the Indian Labour Journal</a>.&nbsp;On the recommendations of the Governing Council of the National Sample Survey Organisation in its 61st meeting,&nbsp;the <a href="https://im4change.org/upload/files/ilj_feb_2013.pdf" title="https://im4change.org/upload/files/ilj_feb_2013.pdf">Labour Bureau</a> started the compilation and analysis of wage rate data with effect from April, 1998.&nbsp;</p><p style="text-align:justify">The Field Operations Division of the National Sample Survey Organisation has been entrusted with the work of <a href="https://im4change.org/upload/files/METHOLOGY%20FOR%20COMPILATION%20OF%20THE%20WAGE%20RATE%20DATA.pdf" title="https://im4change.org/upload/files/METHOLOGY%20FOR%20COMPILATION%20OF%20THE%20WAGE%20RATE%20DATA.pdf">data collection</a>. The <a href="https://im4change.org/upload/files/METHOLOGY%20FOR%20COMPILATION%20OF%20THE%20WAGE%20RATE%20DATA.pdf" title="https://im4change.org/upload/files/METHOLOGY%20FOR%20COMPILATION%20OF%20THE%20WAGE%20RATE%20DATA.pdf">wage rate data</a> are being collected along with rural retail prices from 600 sample villages spread over 66 NSS regions of 20 States by canvassing Block-5 <em>(Annexure-I)</em> of Schedule 3.01(R). The data collection from these sample villages is staggered over the four weeks of a month with one-fourth of them being covered every week. The days of canvassing of Schedule 3.01(R) are fixed. The village functionaries like the Panchayat Secretary, Progress Assistant, Patwari and other Village or Block Officials are the primary informants for collection of data on wage rates. The data on normal working hours and the prevailing wage rates in cash and kind for the reported working hours are collected sex-wise for each of the 18 selected occupations in 20 states, indicates an old&nbsp;<a href="https://im4change.org/upload/files/METHOLOGY%20FOR%20COMPILATION%20OF%20THE%20WAGE%20RATE%20DATA.pdf" title="https://im4change.org/upload/files/METHOLOGY%20FOR%20COMPILATION%20OF%20THE%20WAGE%20RATE%20DATA.pdf">document</a> of the Labour Bureau. &nbsp;&nbsp;</p><p style="text-align:justify">The wage rates are sometimes reported for a duration that is less/more than the normal working hours. In such cases, they are <a href="https://im4change.org/upload/files/METHOLOGY%20FOR%20COMPILATION%20OF%20THE%20WAGE%20RATE%20DATA.pdf" title="https://im4change.org/upload/files/METHOLOGY%20FOR%20COMPILATION%20OF%20THE%20WAGE%20RATE%20DATA.pdf">first normalised for eight hours</a> working day. As regards the mode of payment of wages, it is made in both ways i.e., in cash and/or in kind. The payments made in kind are very common in rural areas, which include foodgrains, cooked food, tea, fuel, cigarette, beedi, fodder, etc.&nbsp;The wages reported in kind are evaluated at local retail prices. Thereafter, the data is thoroughly scrutinised and discrepant points are referred back to the field for clarification. In the next stage, the simple arithmetic average of these normalised daily wage rates is worked out occupation-wise and sex-wise for each state.</p><p style="text-align:justify"><a href="http://ras.org.in/methodology_of_data_collection_unsuited_to_changing_rural_reality" title="http://ras.org.in/methodology_of_data_collection_unsuited_to_changing_rural_reality">Up to June 2000</a>, the average wage rates at the national level were derived by taking the simple average of state figures; since July 2000, the averages have been obtained by dividing the sum total of wages of all 20 states by the number of centres or villages from which data were collected. The state-wise averages are restricted only to those occupations where the number of centres is five or more to avoid abnormal fluctuations and inconsistency in wages paid to different categories of workers on account of varying numbers of centres. However, in order to calculate the all-India averages, all neglected centres are taken into account to arrive at the total number of centres at the national level.</p><p style="text-align:justify">The <a href="/upload/files/RBI%20note%20Average%20Daily%20Wage%20rate%20Methodology.pdf" title="/upload/files/RBI%20note%20Average%20Daily%20Wage%20rate%20Methodology.pdf">Reserve Bank of India</a>&nbsp;<em>(whose data we have used in writing this news alert)</em> has collated and is releasing monthly time series data on rural wage rates based on the data published by the Labour Bureau, Government of India. Starting from November 2013 the Labour Bureau is collecting the rural wage data in respect of 12 agricultural and 13 non-agricultural occupations across 20 major states, namely, Andhra Pradesh, Assam, Bihar, Gujarat, Haryana, Himachal Pradesh, Jammu &amp; Kashmir, Karnataka, Kerala, Madhya Pradesh, Maharashtra, Manipur, Meghalaya, Orissa, Punjab, Rajasthan, Tamil Nadu, Tripura, Uttar Pradesh and West Bengal. The occupations for which the daily wage rates are collected every month are: <u>(A) Agricultural occupations</u> &ndash; (1) &nbsp;Ploughing/ Tilling workers, (2) Sowing <em>(including planting/ Transplanting/ Weeding)</em> workers, (3) Harvesting/ Winnowing/ Threshing workers, (4) Picking workers <em>(including Tea, Cotton, Tobacco and other commercial crops)</em>, (5) Horticulture workers <em>(including nursery growers)</em>, (6) Fishermen-inland, (7) Fishermen coastal/deep-sea, (8) Loggers and wood cutters, (9) Animal husbandry workers <em>(including poultry workers, dairy workers and herdsman)</em>, (10) Packaging labourers, agriculture, (11) General agricultural labourers <em>(including watering/ irrigation workers, etc.)</em>, (12) Plant protection workers <em>(applying pesticides, treating seeds, etc.)</em>; and <u>(B) Non-agricultural occupations</u> &ndash; (13) Carpenter, (14) Blacksmith, (15) Mason, (16) Weavers, (17) Beedi makers, (18) Bamboo, cane basket weavers, (19) Handicraft workers, (20) Plumbers, (21) Electrician, (22) Construction workers <em>(for roads, dams, industrial &amp; project construction work and Well diggers)</em>, (23) LMV &amp; Tractor drivers, (24) Non-agricultural labourers <em>(including porters, loaders)</em>, and (25) Sweeping/cleaning workers.&nbsp;</p><p style="text-align:justify"><strong><em>References&nbsp;</em></strong></p><p style="text-align:justify">Handbook of Statistics on Indian States 2020-21, released in November 2021, please <a href="https://m.rbi.org.in/scripts/AnnualPublications.aspx?head=Handbook%20of%20Statistics%20on%20Indian%20States" title="https://m.rbi.org.in/scripts/AnnualPublications.aspx?head=Handbook%20of%20Statistics%20on%20Indian%20States">click here</a> to access</p><p style="text-align:justify">State-wise Average Daily Wage Rates in Rural India (Men - General Agricultural Labourers), RBI Handbook of Statistics on Indian States 2020-21, released in November 2021, please <a href="/upload/files/State-wise%20Average%20Daily%20Wage%20Rates%20in%20Rural%20India%20Men%20-%20General%20Agricultural%20Labourers.PDF" title="/upload/files/State-wise%20Average%20Daily%20Wage%20Rates%20in%20Rural%20India%20Men%20-%20General%20Agricultural%20Labourers.PDF">click here</a> to access&nbsp;</p><p style="text-align:justify">State-wise Average Daily Wage Rates in Rural India (Men - Non-Agricultural Labourers), RBI Handbook of Statistics on Indian States 2020-21, released in November 2021, please <a href="/upload/files/State-wise%20Average%20Daily%20Wage%20Rates%20in%20Rural%20India%20Men%20-%20Non%20Agricultural%20Labourers.PDF" title="/upload/files/State-wise%20Average%20Daily%20Wage%20Rates%20in%20Rural%20India%20Men%20-%20Non%20Agricultural%20Labourers.PDF">click here</a> to access&nbsp;</p><p style="text-align:justify">State-wise Average Daily Wage Rates in Rural India (Men - Construction Workers), RBI Handbook of Statistics on Indian States 2020-21, released in November 2021, please <a href="/upload/files/State-wise%20Average%20Daily%20Wage%20Rates%20in%20Rural%20India%20Men%20-%20Construction%20Workers.PDF" title="/upload/files/State-wise%20Average%20Daily%20Wage%20Rates%20in%20Rural%20India%20Men%20-%20Construction%20Workers.PDF">click here</a> to access&nbsp;</p><p style="text-align:justify">State-wise Average Inflation (CPI) - Inflation, RBI Handbook of Statistics on Indian States 2020-21, released in November 2021, please <a href="/upload/files/State-wise%20Average%20Inflation%20CPI%20-%20Inflation.PDF" title="/upload/files/State-wise%20Average%20Inflation%20CPI%20-%20Inflation.PDF">click here</a> to access&nbsp;</p><p style="text-align:justify">Indian Labour Journal, February 2013, please <a href="/upload/files/ilj_feb_2013.pdf" title="/upload/files/ilj_feb_2013.pdf">click here</a> to access &nbsp;</p><p style="text-align:justify">Wage Rates in Rural India 2003-04: Methodology for Compilation of the Wage Rate Data, Labour Bureau, please <a href="/upload/files/METHOLOGY%20FOR%20COMPILATION%20OF%20THE%20WAGE%20RATE%20DATA.pdf" title="/upload/files/METHOLOGY%20FOR%20COMPILATION%20OF%20THE%20WAGE%20RATE%20DATA.pdf">click here</a> to access&nbsp; &nbsp;&nbsp;</p><p style="text-align:justify">Average Daily Wage Rates in Rural India: Methodology and coverage (From November 2013), Reserve Bank of India, please <a href="https://dbie.rbi.org.in" title="https://dbie.rbi.org.in">click here</a>&nbsp;and <a href="/upload/files/RBI%20note%20Average%20Daily%20Wage%20rate%20Methodology%281%29.pdf" title="/upload/files/RBI%20note%20Average%20Daily%20Wage%20rate%20Methodology%281%29.pdf">here</a> to access&nbsp;</p><p style="text-align:justify">Consumer Price Index Numbers on Base 2012=100 for Rural, Urban and Combined for the month of January 2022, Ministry of Statistics and Programme Implementation (MoSPI), National Statistical Office (NSO), released on 14th February 2022, please <a href="/upload/files/CPI%20Press%20Release%20January%202022%281%29.pdf" title="/upload/files/CPI%20Press%20Release%20January%202022%281%29.pdf">click here</a> to access&nbsp;</p><p style="text-align:justify">Methodology of Data Collection Unsuited to Changing Rural Reality: A Study of Agricultural Wage Data in India -Yoshifumi Usami, Arindam Das, and Madhura Swaminathan, Review of Agrarian Studies, Vol. 10, No. 2, July-December, 2020, please <a href="http://ras.org.in/methodology_of_data_collection_unsuited_to_changing_rural_reality" title="http://ras.org.in/methodology_of_data_collection_unsuited_to_changing_rural_reality">click here</a> to access</p><p>Russia-ukraine crisis to push up fertiliser prices, govt subsidies, IANS/ Business Standard, 4 March, 2022, please <a href="https://www.business-standard.com/article/economy-policy/russia-ukraine-crisis-to-push-up-fertiliser-prices-govt-subsidies-122030400560_1.html" title="https://www.business-standard.com/article/economy-policy/russia-ukraine-crisis-to-push-up-fertiliser-prices-govt-subsidies-122030400560_1.html">click here</a> to access &nbsp;</p><p>Cooking oil prices spike in India due to Russia-ukraine crisis -B Krishna Mohan, TelanganaToday.com, 3 March, 2022, please <a href="https://telanganatoday.com/cooking-oil-prices-spike-in-india-due-to-russia-ukraine-crisis" title="https://telanganatoday.com/cooking-oil-prices-spike-in-india-due-to-russia-ukraine-crisis">click here</a> to access &nbsp;</p><p>Govt reviews cooking oil imports as ukraine crisis disrupts supplies, prices shoot up -Amiti Sen and Prabhudutta Mishra, The Hindu Business Line, 4 March, 2022, please <a href="https://www.thehindubusinessline.com/markets/commodities/govt-reviews-cooking-oil-imports-as-ukraine-crisis-disrupts-supplies-prices-shoot-up/article65190879.ece" title="https://www.thehindubusinessline.com/markets/commodities/govt-reviews-cooking-oil-imports-as-ukraine-crisis-disrupts-supplies-prices-shoot-up/article65190879.ece">click here</a> to access &nbsp;</p><p>India&#39;s Economy Faces A Potential Stagflation Risk From Ukraine War -Sunil Prabhu, NDTV.com, 1 March, 2022, please <a href="https://www.ndtv.com/business/indias-economy-faces-a-potential-stagflation-risk-from-ukraine-war-2796624" title="https://www.ndtv.com/business/indias-economy-faces-a-potential-stagflation-risk-from-ukraine-war-2796624">click here</a> to access</p><p>India to be one of Asia&rsquo;s &lsquo;biggest losers&rsquo; from the Ukraine war as Russia slammed by global sanctions -Paran Balakrishnan, The Telegraph, 1 March, 2022, please <a href="https://www.telegraphindia.com/business/russia-ukraine-crisis-india-to-be-one-of-asias-biggest-losers-from-the-ukraine-war-as-russia-slammed-by-global-sanctions/cid/1854032" title="https://www.telegraphindia.com/business/russia-ukraine-crisis-india-to-be-one-of-asias-biggest-losers-from-the-ukraine-war-as-russia-slammed-by-global-sanctions/cid/1854032">click here</a> to access</p><p>Crude Oil Prices Rise, Tracking Russia-Ukraine Conflict -Rahul Karunakar, NDTV.com <em>(with inputs from Agencies)</em>, 1 March, 2022, please <a href="https://www.ndtv.com/business/crude-oil-prices-rise-on-tuesday-tracking-russia-ukraine-conflict-2796187" title="https://www.ndtv.com/business/crude-oil-prices-rise-on-tuesday-tracking-russia-ukraine-conflict-2796187">click here</a> to access</p><p>Cooking Oil May Become Costlier Due to Russia-ukraine War. Know Why, News18.com, 27 February, 2022, please <a href="https://www.news18.com/news/business/markets/cooking-oil-may-become-costlier-due-to-russia-ukraine-war-know-why-4812740.html" title="https://www.news18.com/news/business/markets/cooking-oil-may-become-costlier-due-to-russia-ukraine-war-know-why-4812740.html">click here</a> to access &nbsp;</p><p style="text-align:justify"><strong>Image Courtesy: Inclusive Media for Change/ Shambhu Ghatak</strong></p>'
$lang = 'English'
$SITE_URL = 'https://im4change.in/'
$site_title = 'im4change'
$adminprix = 'admin'</pre><pre class="stack-trace">include - APP/Template/Layout/printlayout.ctp, line 8
Cake\View\View::_evaluate() - CORE/src/View/View.php, line 1413
Cake\View\View::_render() - CORE/src/View/View.php, line 1374
Cake\View\View::renderLayout() - CORE/src/View/View.php, line 927
Cake\View\View::render() - CORE/src/View/View.php, line 885
Cake\Controller\Controller::render() - CORE/src/Controller/Controller.php, line 791
Cake\Http\ActionDispatcher::_invoke() - CORE/src/Http/ActionDispatcher.php, line 126
Cake\Http\ActionDispatcher::dispatch() - CORE/src/Http/ActionDispatcher.php, line 94
Cake\Http\BaseApplication::__invoke() - CORE/src/Http/BaseApplication.php, line 235
Cake\Http\Runner::__invoke() - CORE/src/Http/Runner.php, line 65
Cake\Routing\Middleware\RoutingMiddleware::__invoke() - CORE/src/Routing/Middleware/RoutingMiddleware.php, line 162
Cake\Http\Runner::__invoke() - CORE/src/Http/Runner.php, line 65
Cake\Routing\Middleware\AssetMiddleware::__invoke() - CORE/src/Routing/Middleware/AssetMiddleware.php, line 88
Cake\Http\Runner::__invoke() - CORE/src/Http/Runner.php, line 65
Cake\Error\Middleware\ErrorHandlerMiddleware::__invoke() - CORE/src/Error/Middleware/ErrorHandlerMiddleware.php, line 96
Cake\Http\Runner::__invoke() - CORE/src/Http/Runner.php, line 65
Cake\Http\Runner::run() - CORE/src/Http/Runner.php, line 51</pre></div></pre>news-alerts-57/real-wage-rates-of-the-rural-workers-hardly-increased-during-the-past-6-years.html"/>
<meta http-equiv="Content-Type" content="text/html; charset=utf-8"/>
<link href="https://im4change.in/css/control.css" rel="stylesheet" type="text/css"
media="all"/>
<title>NEWS ALERTS | Real wage rates of the rural workers hardly increased during the last 6 years | Im4change.org</title>
<meta name="description" content="In the absence of income or expenditure-based headcount ratio, the growth in the real wages (i.e., nominal wages adjusted against retail inflation) of the manual workers is considered to be a good proxy to assess the trends in poverty. This..."/>
<script src="https://im4change.in/js/jquery-1.10.2.js"></script>
<script type="text/javascript" src="https://im4change.in/js/jquery-migrate.min.js"></script>
<script language="javascript" type="text/javascript">
$(document).ready(function () {
var img = $("img")[0]; // Get my img elem
var pic_real_width, pic_real_height;
$("<img/>") // Make in memory copy of image to avoid css issues
.attr("src", $(img).attr("src"))
.load(function () {
pic_real_width = this.width; // Note: $(this).width() will not
pic_real_height = this.height; // work for in memory images.
});
});
</script>
<style type="text/css">
@media screen {
div.divFooter {
display: block;
}
}
@media print {
.printbutton {
display: none !important;
}
}
</style>
</head>
<body>
<table cellpadding="0" cellspacing="0" border="0" width="98%" align="center">
<tr>
<td class="top_bg">
<div class="divFooter">
<img src="https://im4change.in/images/logo1.jpg" height="59" border="0"
alt="Resource centre on India's rural distress" style="padding-top:14px;"/>
</div>
</td>
</tr>
<tr>
<td id="topspace"> </td>
</tr>
<tr id="topspace">
<td> </td>
</tr>
<tr>
<td height="50" style="border-bottom:1px solid #000; padding-top:10px;" class="printbutton">
<form><input type="button" value=" Print this page "
onclick="window.print();return false;"/></form>
</td>
</tr>
<tr>
<td width="100%">
<h1 class="news_headlines" style="font-style:normal">
<strong>Real wage rates of the rural workers hardly increased during the last 6 years</strong></h1>
</td>
</tr>
<tr>
<td width="100%" style="font-family:Arial, 'Segoe Script', 'Segoe UI', sans-serif, serif"><font size="3">
<p style="text-align:justify">In the absence of income or expenditure-based headcount ratio, the growth in the real wages <em>(i.e., nominal wages adjusted against retail inflation)</em> of the manual workers is considered to be a good proxy to assess the trends in poverty. This is because the manual, unskilled/ semi-skilled labourers exist at the bottom of the pyramid or economic hierarchy, and most of them belong to the social categories Scheduled Castes (SCs) and Scheduled Tribes (STs). A positive growth in their real wages <em>(or real wage rates) </em>is anticipated to improve their purchasing power <em>(i.e., income or consumption expenditure)</em> and lift them out of the poverty trap. </p><p style="text-align:justify">Clearly, there exists inter-state differences in nominal wage rates, growth in nominal wage rates and growth in real wage rates, which we will see in this news alert. </p><p style="text-align:justify">Against the backdrop of the <a href="https://www.thehindubusinessline.com/markets/commodities/govt-reviews-cooking-oil-imports-as-ukraine-crisis-disrupts-supplies-prices-shoot-up/article65190879.ece" title="https://www.thehindubusinessline.com/markets/commodities/govt-reviews-cooking-oil-imports-as-ukraine-crisis-disrupts-supplies-prices-shoot-up/article65190879.ece">Russia-Ukraine conflict</a>, which is anticipated to cause both <a href="https://www.ndtv.com/business/indias-economy-faces-a-potential-stagflation-risk-from-ukraine-war-2796624" title="https://www.ndtv.com/business/indias-economy-faces-a-potential-stagflation-risk-from-ukraine-war-2796624">food and fuel retail inflation</a> in India in the coming times, it is even more important to look at the past trends in wage rate growth of the rural workers. It should be noted that the <a href="https://public.flourish.studio/visualisation/8706137" title="https://public.flourish.studio/visualisation/8706137">year-on-year inflation</a> in <a href="https://public.flourish.studio/visualisation/8706137" title="https://public.flourish.studio/visualisation/8706137">Consumer</a> <a href="https://public.flourish.studio/visualisation/8706137" title="https://public.flourish.studio/visualisation/8706137">Price Index Rural</a> exceeded the <a href="https://public.flourish.studio/visualisation/8706137" title="https://public.flourish.studio/visualisation/8706137">year-on-year inflation</a> in <a href="https://public.flourish.studio/visualisation/8706137" title="https://public.flourish.studio/visualisation/8706137">CPI Urban</a> during January 2022 at the national level. Even before the beginning of Russia-Ukraine conflict <em>(i.e., during January 2022)</em>, in rural areas, <a href="https://im4change.org/upload/files/CPI%20Press%20Release%20January%202022%281%29.pdf" title="https://im4change.org/upload/files/CPI%20Press%20Release%20January%202022%281%29.pdf">retail inflation rate of 20.6 percent</a> was noticed for 'oils and fats', aside from <a href="https://im4change.org/upload/files/CPI%20Press%20Release%20January%202022%281%29.pdf" title="https://im4change.org/upload/files/CPI%20Press%20Release%20January%202022%281%29.pdf">8.44 percent retail inflation for 'fuel and light'</a>, <a href="https://im4change.org/upload/files/CPI%20Press%20Release%20January%202022%281%29.pdf" title="https://im4change.org/upload/files/CPI%20Press%20Release%20January%202022%281%29.pdf">8.27 percent</a> for 'transport and communication', and <a href="https://im4change.org/upload/files/CPI%20Press%20Release%20January%202022%281%29.pdf" title="https://im4change.org/upload/files/CPI%20Press%20Release%20January%202022%281%29.pdf">9.65 percent for 'clothing and footwear'</a>. </p><p style="text-align:justify">At the national level, the average daily nominal wage rate for male construction workers in rural areas during the period from 2014-15 to 2020-21 was Rs. 316.9, which was greater than that of the male non-farm workers in rural areas. The average daily nominal wage rate for male non-agricultural labourers in rural areas during the period from 2014-15 to 2020-21 was Rs. 273.8, which exceeded the average daily nominal wage rates for male farm labourers in rural areas <em>(i.e., Rs. 265.1)</em>. However, in Andhra Pradesh, Haryana, Himachal Pradesh, Jammu and Kashmir, Karnataka, Kerala, Meghalaya, Punjab, and Tripura, the average daily nominal wage rates for male agricultural labourers in rural areas during the period from 2014-15 to 2020-21 exceeded the average daily nominal wage rates for male non-farm labourers in rural areas. Please see chart-1.</p><p style="text-align:justify"><img alt="" src="/upload/images/Chart%201.png" style="height:670px; width:1000px" /></p><p style="text-align:justify"><em><strong>Notes:</strong> The average (i.e., arithmetic mean) daily nominal wage rates for various categories of workers in rural India in the period from 2014-15 to 2020-21 has been calculated by the Inclusive Media for Change staff</em></p><p style="text-align:justify"><em>Please <a href="https://docs.google.com/spreadsheets/d/1avu0-WtaKV2RHXtz2eiP7iS8znGVBdKC/edit?usp=sharing&ouid=112233925171588304692&rtpof=true&sd=true" title="https://docs.google.com/spreadsheets/d/1avu0-WtaKV2RHXtz2eiP7iS8znGVBdKC/edit?usp=sharing&ouid=112233925171588304692&rtpof=true&sd=true">click here</a> to access the data in spreadsheet format</em></p><p style="text-align:justify"><em><strong>Source: </strong>Handbook of Statistics on Indian States 2020-21, released in November 2021, please <a href="https://m.rbi.org.in/scripts/AnnualPublications.aspx?head=Handbook%20of%20Statistics%20on%20Indian%20States" title="https://m.rbi.org.in/scripts/AnnualPublications.aspx?head=Handbook%20of%20Statistics%20on%20Indian%20States">click here</a> to access</em></p><p style="text-align:justify"><em>State-wise Average Daily Wage Rates in Rural India (Men - General Agricultural Labourers), RBI Handbook of Statistics on Indian States 2020-21, released in November 2021, please <a href="/upload/files/State-wise%20Average%20Daily%20Wage%20Rates%20in%20Rural%20India%20Men%20-%20General%20Agricultural%20Labourers.PDF" title="/upload/files/State-wise%20Average%20Daily%20Wage%20Rates%20in%20Rural%20India%20Men%20-%20General%20Agricultural%20Labourers.PDF">click here</a> to access </em></p><p style="text-align:justify"><em>State-wise Average Daily Wage Rates in Rural India (Men - Non-Agricultural Labourers), RBI Handbook of Statistics on Indian States 2020-21, released in November 2021, please <a href="/upload/files/State-wise%20Average%20Daily%20Wage%20Rates%20in%20Rural%20India%20Men%20-%20Non%20Agricultural%20Labourers.PDF" title="/upload/files/State-wise%20Average%20Daily%20Wage%20Rates%20in%20Rural%20India%20Men%20-%20Non%20Agricultural%20Labourers.PDF">click here</a> to access </em></p><p style="text-align:justify"><em>State-wise Average Daily Wage Rates in Rural India (Men - Construction Workers), RBI Handbook of Statistics on Indian States 2020-21, released in November 2021, please <a href="/upload/files/State-wise%20Average%20Daily%20Wage%20Rates%20in%20Rural%20India%20Men%20-%20Construction%20Workers.PDF" title="/upload/files/State-wise%20Average%20Daily%20Wage%20Rates%20in%20Rural%20India%20Men%20-%20Construction%20Workers.PDF">click here</a> to access </em></p><p style="text-align:justify"><em>State-wise Average Inflation (CPI) - Inflation, RBI Handbook of Statistics on Indian States 2020-21, released in November 2021, please <a href="/upload/files/State-wise%20Average%20Inflation%20CPI%20-%20Inflation.PDF" title="/upload/files/State-wise%20Average%20Inflation%20CPI%20-%20Inflation.PDF">click here</a> to access </em></p><p style="text-align:justify"><strong>---</strong></p><p style="text-align:justify">At the national level, the agricultural nominal wage rate grew faster than the non-farm wage rate on average for male labourers in rural areas during the period from 2015-16 to 2020-21. However, in states like Assam, Bihar, Haryana, Madhya Pradesh, Odisha, Punjab, and West Bengal, the non-farm nominal wage rates grew faster than the farm wage rates on average for male workers in rural areas during the period from 2015-16 to 2020-21. Please see chart-2. </p><p style="text-align:justify"><img alt="" src="/upload/images/Chart%202.png" style="height:653px; width:1000px" /></p><p style="text-align:justify"><em><strong>Notes: </strong>The average growth in daily nominal wage rates for various categories of workers in rural India in the period from 2015-16 to 2020-21 has been calculated by the Inclusive Media for Change staff</em></p><p style="text-align:justify"><em>Please <a href="https://docs.google.com/spreadsheets/d/1avu0-WtaKV2RHXtz2eiP7iS8znGVBdKC/edit?usp=sharing&ouid=112233925171588304692&rtpof=true&sd=true" title="https://docs.google.com/spreadsheets/d/1avu0-WtaKV2RHXtz2eiP7iS8znGVBdKC/edit?usp=sharing&ouid=112233925171588304692&rtpof=true&sd=true">click here</a> to access the data in spreadsheet format</em></p><p style="text-align:justify"><em><strong>Source: </strong>Same as above</em><br /><strong>---</strong></p><p style="text-align:justify">At the national level, the construction sector nominal wage rate grew slower than the non-agricultural wage rate on average for male labourers in rural areas during the period from 2015-16 to 2020-21. However, in states like Andhra Pradesh, Bihar, Himachal Pradesh, Maharashtra, Meghalaya, Punjab, Tamil Nadu, and Uttar Pradesh, the construction sector nominal wage rates grew faster than the non-farm wage rates on average for male workers in rural areas during the period from 2015-16 to 2020-21. Please take a look at chart-2. </p><p style="text-align:justify">At the national level, the agricultural wage rate in real terms grew faster than the non-farm wage rate on average for male labourers in rural areas during the period from 2015-16 to 2020-21. However, in states like Assam, Bihar, Haryana, Madhya Pradesh, Odisha, Punjab, and West Bengal, the non-farm wage rates in real terms grew faster than the farm wage rates on average for male workers in rural areas during the period from 2015-16 to 2020-21. Please see table-1.</p><p style="text-align:justify"><strong>Table 1: State-wise Growth in Average Daily Wage Rates in Real terms for Male Agricultural Labourers, Male Non-Agricultural Labourers, and Male Construction Workers in Rural India, in %</strong><br /><img alt="" src="/upload/images/Table%201%20State-wise%20Growth%20in%20Average%20Daily%20Wage%20Rates%20in%20Real%20terms%20for%20Male%20Agricultural%20Labourers%20Male%20Non-Agricultural%20Labourers%20and%20Male%20Construction%20Workers%20in%20Rural%20India%20in%20percent.png" style="height:539px; width:750px" /></p><p style="text-align:justify"><em><strong>Notes: </strong>The average growth in daily wage rates in real terms for various categories of workers in rural India in the period from 2015-16 to 2020-21 has been calculated by the Inclusive Media for Change staff</em></p><p style="text-align:justify"><em>Please <a href="https://docs.google.com/spreadsheets/d/1avu0-WtaKV2RHXtz2eiP7iS8znGVBdKC/edit?usp=sharing&ouid=112233925171588304692&rtpof=true&sd=true" title="https://docs.google.com/spreadsheets/d/1avu0-WtaKV2RHXtz2eiP7iS8znGVBdKC/edit?usp=sharing&ouid=112233925171588304692&rtpof=true&sd=true">click here</a> to access the data in spreadsheet format</em></p><p style="text-align:justify"><em><strong>Source: </strong>Same as above</em><br /><strong>---</strong></p><p style="text-align:justify">At the national level, the construction sector wage rate in real terms grew slower than the non-agricultural wage rate on average for male labourers in rural areas during the period from 2015-16 to 2020-21. However, in states like Andhra Pradesh, Bihar, Himachal Pradesh, Maharashtra, Meghalaya, Punjab, Tamil Nadu, and Uttar Pradesh, the construction sector wage rates in real terms grew faster than the non-farm wage rates on average for male workers in rural areas during the period from 2015-16 to 2020-21. Please take a look at table-1. </p><p style="text-align:justify">In the following paragraphs, we have discussed the trends in agricultural wage rates, non-farm wage rates, and construction sector wage rates <em>(in rural areas)</em> in detail. </p><p style="text-align:justify"><strong>Agricultural wages in rural areas</strong></p><p style="text-align:justify">The highest <a href="https://im4change.org/upload/files/State%20wise%20average%20daily%20nominal%20wage%20rates%20in%20rural%20india%20men%20farm%20labourers.JPG" title="https://im4change.org/upload/files/State%20wise%20average%20daily%20nominal%20wage%20rates%20in%20rural%20india%20men%20farm%20labourers.JPG">average daily nominal wage rate</a> <a href="https://im4change.org/upload/files/State%20wise%20average%20daily%20nominal%20wage%20rates%20in%20rural%20india%20men%20farm%20labourers.JPG" title="https://im4change.org/upload/files/State%20wise%20average%20daily%20nominal%20wage%20rates%20in%20rural%20india%20men%20farm%20labourers.JPG">for male agricultural labourers</a> in rural India during the period from 2014-15 to 2020-21 was found in Kerala <em>(Rs. 653.93)</em>, followed by Jammu and Kashmir <em>(Rs. 429.19)</em>, Tamil Nadu <em>(Rs. 385.6)</em>, Haryana <em>(Rs. 368.53)</em>, Himachal Pradesh <em>(Rs. 366.23)</em>, and Punjab <em>(Rs. 325.31)</em>. Please have a look at chart-1.</p><p style="text-align:justify">The lowest <a href="https://im4change.org/upload/files/State%20wise%20average%20daily%20nominal%20wage%20rates%20in%20rural%20india%20men%20farm%20labourers.JPG" title="https://im4change.org/upload/files/State%20wise%20average%20daily%20nominal%20wage%20rates%20in%20rural%20india%20men%20farm%20labourers.JPG">average daily nominal wage rate</a> <a href="https://im4change.org/upload/files/State%20wise%20average%20daily%20nominal%20wage%20rates%20in%20rural%20india%20men%20farm%20labourers.JPG" title="https://im4change.org/upload/files/State%20wise%20average%20daily%20nominal%20wage%20rates%20in%20rural%20india%20men%20farm%20labourers.JPG">for male agricultural labourers</a> in rural India during the period from 2014-15 to 2020-21 was observed in Madhya Pradesh <em>(Rs. 183.97)</em>, followed by Gujarat <em>(Rs. 190.07)</em>, Maharashtra <em>(Rs. 215.71)</em>, Odisha <em>(Rs. 216.87)</em>, Meghalaya <em>(Rs. 219.93)</em>, Bihar <em>(Rs. 230.43)</em>, Uttar Pradesh <em>(Rs. 230.5)</em>, and Assam <em>(Rs. 237.3)</em>. The related national level figure was Rs. 265.09 during the period from 2014-15 to 2020-21. Please consult chart-1. </p><p style="text-align:justify">The highest <a href="https://im4change.org/upload/files/State%20wise%20growth%20in%20average%20daily%20nominal%20wage%20rates%20in%20rural%20india%20men%20farm%20labourers.JPG" title="https://im4change.org/upload/files/State%20wise%20growth%20in%20average%20daily%20nominal%20wage%20rates%20in%20rural%20india%20men%20farm%20labourers.JPG">average annual growth rate in</a> <a href="https://im4change.org/upload/files/State%20wise%20growth%20in%20average%20daily%20nominal%20wage%20rates%20in%20rural%20india%20men%20farm%20labourers.JPG" title="https://im4change.org/upload/files/State%20wise%20growth%20in%20average%20daily%20nominal%20wage%20rates%20in%20rural%20india%20men%20farm%20labourers.JPG">nominal wage rates</a> during the period from 2015-16 to 2020-21 was found in Karnataka <em>(7.3 percent)</em>, followed by Andhra Pradesh <em>(6.8 percent)</em>, Madhya Pradesh <em>(6.4 percent)</em>, Uttar Pradesh <em>(6.2 percent)</em>, Odisha <em>(6.1 percent)</em>, and Meghalaya <em>(6.0 percent)</em>. Please see chart-2.</p><p style="text-align:justify">The lowest <a href="https://im4change.org/upload/files/State%20wise%20growth%20in%20average%20daily%20nominal%20wage%20rates%20in%20rural%20india%20men%20farm%20labourers.JPG" title="https://im4change.org/upload/files/State%20wise%20growth%20in%20average%20daily%20nominal%20wage%20rates%20in%20rural%20india%20men%20farm%20labourers.JPG">average annual growth rate</a> <a href="https://im4change.org/upload/files/State%20wise%20growth%20in%20average%20daily%20nominal%20wage%20rates%20in%20rural%20india%20men%20farm%20labourers.JPG" title="https://im4change.org/upload/files/State%20wise%20growth%20in%20average%20daily%20nominal%20wage%20rates%20in%20rural%20india%20men%20farm%20labourers.JPG">in nominal wage rates</a> during the same period was noticed in Haryana <em>(2.1 percent)</em>, followed by Rajasthan <em>(3.3 percent)</em>, Kerala <em>(3.5 percent)</em>, Punjab <em>(3.9 percent)</em>, and Tamil Nadu <em>(4.5 percent)</em>. Please consult chart-2.</p><p style="text-align:justify">The average annual <a href="https://im4change.org/upload/files/State%20wise%20growth%20in%20average%20daily%20wage%20rates%20in%20real%20terms%20for%20male%20farm%20labourers%20in%20rural%20India.JPG" title="https://im4change.org/upload/files/State%20wise%20growth%20in%20average%20daily%20wage%20rates%20in%20real%20terms%20for%20male%20farm%20labourers%20in%20rural%20India.JPG">growth of agricultural labourers’</a> <a href="https://im4change.org/upload/files/State%20wise%20growth%20in%20average%20daily%20wage%20rates%20in%20real%20terms%20for%20male%20farm%20labourers%20in%20rural%20India.JPG" title="https://im4change.org/upload/files/State%20wise%20growth%20in%20average%20daily%20wage%20rates%20in%20real%20terms%20for%20male%20farm%20labourers%20in%20rural%20India.JPG">wage rates in real terms</a> during the period from 2015-16 to 2020-21 were negative in Haryana <em>(-2.1 percent)</em>, Jammu and Kashmir <em>(-0.3 percent)</em>, Kerala <em>(-1.7 percent)</em>, Punjab <em>(-0.4 percent)</em>, Rajasthan <em>(-1.1 percent)</em>, Tamil Nadu <em>(-0.8 percent)</em>, Tripura <em>(-0.5 percent)</em>, and West Bengal <em>(-0.1 percent)</em>. It should be noted that the <a href="https://im4change.org/upload/files/State-wise%20Average%20Inflation%20CPI%20-%20Inflation.PDF" title="https://im4change.org/upload/files/State-wise%20Average%20Inflation%20CPI%20-%20Inflation.PDF">rate of inflation</a> in <a href="https://im4change.org/upload/files/State-wise%20Average%20Inflation%20CPI%20-%20Inflation.PDF" title="https://im4change.org/upload/files/State-wise%20Average%20Inflation%20CPI%20-%20Inflation.PDF">Consumer Price Index-General</a> has been used to get the average annual growth of agricultural labourers’ wage rates in real terms. Kindly consult table-1. </p><p style="text-align:justify">Some states witnessed negative <a href="https://im4change.org/upload/files/State%20wise%20growth%20in%20average%20daily%20wage%20rates%20in%20real%20terms%20for%20male%20farm%20labourers%20in%20rural%20India.JPG" title="https://im4change.org/upload/files/State%20wise%20growth%20in%20average%20daily%20wage%20rates%20in%20real%20terms%20for%20male%20farm%20labourers%20in%20rural%20India.JPG">growth in agricultural labourers’</a> <a href="https://im4change.org/upload/files/State%20wise%20growth%20in%20average%20daily%20wage%20rates%20in%20real%20terms%20for%20male%20farm%20labourers%20in%20rural%20India.JPG" title="https://im4change.org/upload/files/State%20wise%20growth%20in%20average%20daily%20wage%20rates%20in%20real%20terms%20for%20male%20farm%20labourers%20in%20rural%20India.JPG">wage rates in real terms</a> for more than two years between 2015-16 and 2020-21. For example, <a href="https://im4change.org/upload/files/State%20wise%20growth%20in%20average%20daily%20wage%20rates%20in%20real%20terms%20for%20male%20farm%20labourers%20in%20rural%20India.JPG" title="https://im4change.org/upload/files/State%20wise%20growth%20in%20average%20daily%20wage%20rates%20in%20real%20terms%20for%20male%20farm%20labourers%20in%20rural%20India.JPG">Haryana</a> experienced negative growth in 2015-16, 2016-17, 2017-18, 2019-20, and 2020-21. Likewise, <a href="https://im4change.org/upload/files/State%20wise%20growth%20in%20average%20daily%20wage%20rates%20in%20real%20terms%20for%20male%20farm%20labourers%20in%20rural%20India.JPG" title="https://im4change.org/upload/files/State%20wise%20growth%20in%20average%20daily%20wage%20rates%20in%20real%20terms%20for%20male%20farm%20labourers%20in%20rural%20India.JPG">Kerala</a> faced negative growth in 2017-18, 2018-19, 2019-20, and 2020-21. </p><p style="text-align:justify">At the national level, the <a href="https://im4change.org/upload/files/State%20wise%20growth%20in%20average%20daily%20wage%20rates%20in%20real%20terms%20for%20male%20farm%20labourers%20in%20rural%20India.JPG" title="https://im4change.org/upload/files/State%20wise%20growth%20in%20average%20daily%20wage%20rates%20in%20real%20terms%20for%20male%20farm%20labourers%20in%20rural%20India.JPG">agricultural labourers’</a> <a href="https://im4change.org/upload/files/State%20wise%20growth%20in%20average%20daily%20wage%20rates%20in%20real%20terms%20for%20male%20farm%20labourers%20in%20rural%20India.JPG" title="https://im4change.org/upload/files/State%20wise%20growth%20in%20average%20daily%20wage%20rates%20in%20real%20terms%20for%20male%20farm%20labourers%20in%20rural%20India.JPG">wage rates in real terms</a> on average grew by 1.0 percent annually during the period from 2015-16 to 2020-21.</p><p style="text-align:justify">Please <a href="https://docs.google.com/spreadsheets/d/1avu0-WtaKV2RHXtz2eiP7iS8znGVBdKC/edit?usp=sharing&ouid=112233925171588304692&rtpof=true&sd=true" title="https://docs.google.com/spreadsheets/d/1avu0-WtaKV2RHXtz2eiP7iS8znGVBdKC/edit?usp=sharing&ouid=112233925171588304692&rtpof=true&sd=true">click here</a> to access the spreadsheet in order to look at the trends in <a href="/upload/files/State%20wise%20average%20daily%20nominal%20wage%20rates%20in%20rural%20india%20men%20farm%20labourers.JPG" title="/upload/files/State%20wise%20average%20daily%20nominal%20wage%20rates%20in%20rural%20india%20men%20farm%20labourers.JPG">nominal wage rates</a>, <a href="/upload/files/State%20wise%20growth%20in%20average%20daily%20nominal%20wage%20rates%20in%20rural%20india%20men%20farm%20labourers.JPG" title="/upload/files/State%20wise%20growth%20in%20average%20daily%20nominal%20wage%20rates%20in%20rural%20india%20men%20farm%20labourers.JPG">annual growth in nominal wage rates</a> and <a href="/upload/files/State%20wise%20growth%20in%20average%20daily%20wage%20rates%20in%20real%20terms%20for%20male%20farm%20labourers%20in%20rural%20India.JPG" title="/upload/files/State%20wise%20growth%20in%20average%20daily%20wage%20rates%20in%20real%20terms%20for%20male%20farm%20labourers%20in%20rural%20India.JPG">annual growth in real wage rates</a> for farm labourers in rural areas. </p><p style="text-align:justify"><strong>Non-agricultural wages in rural areas</strong></p><p style="text-align:justify">The rural economy is not just about farming any longer. That is why we have looked at the wage growth in the non-farm sector too. The highest <a href="https://im4change.org/upload/files/State%20wise%20average%20daily%20nominal%20wage%20rates%20in%20rural%20india%20men%20non%20farm%20labourers.JPG" title="https://im4change.org/upload/files/State%20wise%20average%20daily%20nominal%20wage%20rates%20in%20rural%20india%20men%20non%20farm%20labourers.JPG">average daily nominal wage rate for male</a> <a href="https://im4change.org/upload/files/State%20wise%20average%20daily%20nominal%20wage%20rates%20in%20rural%20india%20men%20non%20farm%20labourers.JPG" title="https://im4change.org/upload/files/State%20wise%20average%20daily%20nominal%20wage%20rates%20in%20rural%20india%20men%20non%20farm%20labourers.JPG">non-agricultural labourers</a> in rural India during the period from 2014-15 to 2020-21 was detected in Kerala <em>(Rs. 639.01)</em>, followed by Jammu and Kashmir <em>(Rs. 426.37)</em>, Tamil Nadu <em>(Rs. 405.77)</em>, Haryana <em>(Rs. 359.24)</em>, Himachal Pradesh <em>(Rs. 311.10)</em>, and Punjab <em>(Rs. 309.09)</em>. Please see chart-1.</p><p style="text-align:justify">The lowest average <a href="https://im4change.org/upload/files/State%20wise%20average%20daily%20nominal%20wage%20rates%20in%20rural%20india%20men%20non%20farm%20labourers.JPG" title="https://im4change.org/upload/files/State%20wise%20average%20daily%20nominal%20wage%20rates%20in%20rural%20india%20men%20non%20farm%20labourers.JPG">daily nominal wage rate for male</a> <a href="https://im4change.org/upload/files/State%20wise%20average%20daily%20nominal%20wage%20rates%20in%20rural%20india%20men%20non%20farm%20labourers.JPG" title="https://im4change.org/upload/files/State%20wise%20average%20daily%20nominal%20wage%20rates%20in%20rural%20india%20men%20non%20farm%20labourers.JPG">non-agricultural labourers in rural India</a> during the period from 2014-15 to 2020-21 was found in Madhya Pradesh <em>(Rs. 191.47)</em>, followed by Meghalaya <em>(Rs. 210.26)</em>, Gujarat <em>(Rs. 213.51)</em>, Odisha <em>(Rs. 218.06)</em>, Maharashtra <em>(Rs. 226.70)</em>, Tripura <em>(Rs. 230.36)</em>, Bihar <em>(Rs. 243.51)</em>, and Uttar Pradesh <em>(Rs. 243.97)</em>. The related national level figure was Rs. 273.79 during the period from 2014-15 to 2020-21. Please see chart-1.</p><p style="text-align:justify">The highest <a href="https://im4change.org/upload/files/State%20wise%20growth%20in%20average%20daily%20nominal%20wage%20rates%20in%20rural%20india%20men%20non%20farm%20labourers.JPG" title="https://im4change.org/upload/files/State%20wise%20growth%20in%20average%20daily%20nominal%20wage%20rates%20in%20rural%20india%20men%20non%20farm%20labourers.JPG">average annual growth rate in</a> <a href="https://im4change.org/upload/files/State%20wise%20growth%20in%20average%20daily%20nominal%20wage%20rates%20in%20rural%20india%20men%20non%20farm%20labourers.JPG" title="https://im4change.org/upload/files/State%20wise%20growth%20in%20average%20daily%20nominal%20wage%20rates%20in%20rural%20india%20men%20non%20farm%20labourers.JPG">nominal wage rates</a> during the period from 2015-16 to 2020-21 was noticed in Odisha <em>(8.0 percent)</em>, followed by Madhya Pradesh <em>(7.6 percent)</em>, Assam <em>(6.6 percent)</em>, West Bengal <em>(5.9 percent)</em>, Uttar Pradesh and Andhra Pradesh <em>(5.6 percent each)</em>, and Bihar <em>(5.5 percent)</em>. Kindly consult chart-2.</p><p style="text-align:justify">The lowest <a href="https://im4change.org/upload/files/State%20wise%20growth%20in%20average%20daily%20nominal%20wage%20rates%20in%20rural%20india%20men%20non%20farm%20labourers.JPG" title="https://im4change.org/upload/files/State%20wise%20growth%20in%20average%20daily%20nominal%20wage%20rates%20in%20rural%20india%20men%20non%20farm%20labourers.JPG">average annual growth rate</a> <a href="https://im4change.org/upload/files/State%20wise%20growth%20in%20average%20daily%20nominal%20wage%20rates%20in%20rural%20india%20men%20non%20farm%20labourers.JPG" title="https://im4change.org/upload/files/State%20wise%20growth%20in%20average%20daily%20nominal%20wage%20rates%20in%20rural%20india%20men%20non%20farm%20labourers.JPG">in nominal wage rates</a> during the same period was observed in Kerala <em>(1.8 percent)</em>, followed by Haryana <em>(2.4 percent)</em>, Meghalaya <em>(2.8 percent)</em>, Tamil Nadu and Rajasthan <em>(3.2 percent each)</em>, Tripura and Jammu and Kashmir <em>(4.0 percent each),</em> and Maharashtra and Punjab <em>(4.2 percent each)</em>. Kindly consult chart-2. </p><p style="text-align:justify">The average annual <a href="https://im4change.org/upload/files/State%20wise%20growth%20in%20average%20daily%20wage%20rates%20in%20real%20terms%20for%20male%20non%20farm%20labourers%20in%20rural%20India.JPG" title="https://im4change.org/upload/files/State%20wise%20growth%20in%20average%20daily%20wage%20rates%20in%20real%20terms%20for%20male%20non%20farm%20labourers%20in%20rural%20India.JPG">growth of non-agricultural labourers’</a> <a href="https://im4change.org/upload/files/State%20wise%20growth%20in%20average%20daily%20wage%20rates%20in%20real%20terms%20for%20male%20non%20farm%20labourers%20in%20rural%20India.JPG" title="https://im4change.org/upload/files/State%20wise%20growth%20in%20average%20daily%20wage%20rates%20in%20real%20terms%20for%20male%20non%20farm%20labourers%20in%20rural%20India.JPG">wage rates in real terms</a> during the period from 2015-16 to 2020-21 were negative in Haryana <em>(-1.9 percent)</em>, Jammu and Kashmir <em>(-1.7 percent)</em>, Kerala <em>(-3.5 percent)</em>, Maharashtra <em>(-0.3 percent)</em>, Meghalaya <em>(-1.2 percent)</em>, Punjab <em>(-0.1 percent)</em>, Rajasthan <em>(-1.2 percent)</em>, Tamil Nadu <em>(-2.1 percent)</em>, and Tripura <em>(-1.1 percent)</em>. It should be noted that the <a href="https://im4change.org/upload/files/State-wise%20Average%20Inflation%20CPI%20-%20Inflation.PDF" title="https://im4change.org/upload/files/State-wise%20Average%20Inflation%20CPI%20-%20Inflation.PDF">rate of inflation</a> in <a href="https://im4change.org/upload/files/State-wise%20Average%20Inflation%20CPI%20-%20Inflation.PDF" title="https://im4change.org/upload/files/State-wise%20Average%20Inflation%20CPI%20-%20Inflation.PDF">CPI-General</a> has been used to get the average annual growth of non-agricultural labourers’ wage rates in real terms. Kindly have a look at table-1. </p><p style="text-align:justify">Some states experienced negative growth in <a href="https://im4change.org/upload/files/State%20wise%20growth%20in%20average%20daily%20wage%20rates%20in%20real%20terms%20for%20male%20non%20farm%20labourers%20in%20rural%20India.JPG" title="https://im4change.org/upload/files/State%20wise%20growth%20in%20average%20daily%20wage%20rates%20in%20real%20terms%20for%20male%20non%20farm%20labourers%20in%20rural%20India.JPG">non-agricultural labourers’ wage</a> <a href="https://im4change.org/upload/files/State%20wise%20growth%20in%20average%20daily%20wage%20rates%20in%20real%20terms%20for%20male%20non%20farm%20labourers%20in%20rural%20India.JPG" title="https://im4change.org/upload/files/State%20wise%20growth%20in%20average%20daily%20wage%20rates%20in%20real%20terms%20for%20male%20non%20farm%20labourers%20in%20rural%20India.JPG">rates in real terms</a> for more than two years between 2015-16 and 2020-21. For example, <a href="https://im4change.org/upload/files/State%20wise%20growth%20in%20average%20daily%20wage%20rates%20in%20real%20terms%20for%20male%20non%20farm%20labourers%20in%20rural%20India.JPG" title="https://im4change.org/upload/files/State%20wise%20growth%20in%20average%20daily%20wage%20rates%20in%20real%20terms%20for%20male%20non%20farm%20labourers%20in%20rural%20India.JPG">Haryana</a> experienced negative <a href="https://im4change.org/upload/files/State%20wise%20growth%20in%20average%20daily%20wage%20rates%20in%20real%20terms%20for%20male%20non%20farm%20labourers%20in%20rural%20India.JPG" title="https://im4change.org/upload/files/State%20wise%20growth%20in%20average%20daily%20wage%20rates%20in%20real%20terms%20for%20male%20non%20farm%20labourers%20in%20rural%20India.JPG">growth in wage rates</a> <a href="https://im4change.org/upload/files/State%20wise%20growth%20in%20average%20daily%20wage%20rates%20in%20real%20terms%20for%20male%20non%20farm%20labourers%20in%20rural%20India.JPG" title="https://im4change.org/upload/files/State%20wise%20growth%20in%20average%20daily%20wage%20rates%20in%20real%20terms%20for%20male%20non%20farm%20labourers%20in%20rural%20India.JPG">(in real terms)</a> during 2016-17, 2017-18, 2018-19, 2019-20, and 2020-21. Likewise, <a href="https://im4change.org/upload/files/State%20wise%20growth%20in%20average%20daily%20wage%20rates%20in%20real%20terms%20for%20male%20non%20farm%20labourers%20in%20rural%20India.JPG" title="https://im4change.org/upload/files/State%20wise%20growth%20in%20average%20daily%20wage%20rates%20in%20real%20terms%20for%20male%20non%20farm%20labourers%20in%20rural%20India.JPG">Kerala</a> faced negative growth rates in 2015-16, 2016-17, 2017-18, 2019-20, and 2020-21. </p><p style="text-align:justify">At the national level, the <a href="https://im4change.org/upload/files/State%20wise%20growth%20in%20average%20daily%20wage%20rates%20in%20real%20terms%20for%20male%20non%20farm%20labourers%20in%20rural%20India.JPG" title="https://im4change.org/upload/files/State%20wise%20growth%20in%20average%20daily%20wage%20rates%20in%20real%20terms%20for%20male%20non%20farm%20labourers%20in%20rural%20India.JPG">non-agricultural labourers’</a> <a href="https://im4change.org/upload/files/State%20wise%20growth%20in%20average%20daily%20wage%20rates%20in%20real%20terms%20for%20male%20non%20farm%20labourers%20in%20rural%20India.JPG" title="https://im4change.org/upload/files/State%20wise%20growth%20in%20average%20daily%20wage%20rates%20in%20real%20terms%20for%20male%20non%20farm%20labourers%20in%20rural%20India.JPG">wage rates in real terms</a> on average grew by just 0.3 percent annually during the period from 2015-16 to 2020-21. </p><p style="text-align:justify">Please <a href="https://docs.google.com/spreadsheets/d/1avu0-WtaKV2RHXtz2eiP7iS8znGVBdKC/edit?usp=sharing&ouid=112233925171588304692&rtpof=true&sd=true" title="https://docs.google.com/spreadsheets/d/1avu0-WtaKV2RHXtz2eiP7iS8znGVBdKC/edit?usp=sharing&ouid=112233925171588304692&rtpof=true&sd=true">click here</a> to access the spreadsheet in order to look at the <a href="/upload/files/State%20wise%20average%20daily%20nominal%20wage%20rates%20in%20rural%20india%20men%20non%20farm%20labourers.JPG" title="/upload/files/State%20wise%20average%20daily%20nominal%20wage%20rates%20in%20rural%20india%20men%20non%20farm%20labourers.JPG">trends in nominal wage rates</a>, <a href="/upload/files/State%20wise%20growth%20in%20average%20daily%20nominal%20wage%20rates%20in%20rural%20india%20men%20non%20farm%20labourers.JPG" title="/upload/files/State%20wise%20growth%20in%20average%20daily%20nominal%20wage%20rates%20in%20rural%20india%20men%20non%20farm%20labourers.JPG">annual growth in nominal wage rates</a>, and <a href="/upload/files/State%20wise%20growth%20in%20average%20daily%20wage%20rates%20in%20real%20terms%20for%20male%20non%20farm%20labourers%20in%20rural%20India.JPG" title="/upload/files/State%20wise%20growth%20in%20average%20daily%20wage%20rates%20in%20real%20terms%20for%20male%20non%20farm%20labourers%20in%20rural%20India.JPG">annual growth in real wage rates</a> for non-farm labourers in rural areas. </p><p style="text-align:justify"><strong>Construction sector wages in rural areas</strong></p><p style="text-align:justify">The <a href="https://im4change.org/upload/files/State%20wise%20average%20daily%20nominal%20wage%20rates%20in%20rural%20india%20men%20construction%20workers.JPG" title="https://im4change.org/upload/files/State%20wise%20average%20daily%20nominal%20wage%20rates%20in%20rural%20india%20men%20construction%20workers.JPG">highest average daily nominal wage rates</a> <a href="https://im4change.org/upload/files/State%20wise%20average%20daily%20nominal%20wage%20rates%20in%20rural%20india%20men%20construction%20workers.JPG" title="https://im4change.org/upload/files/State%20wise%20average%20daily%20nominal%20wage%20rates%20in%20rural%20india%20men%20construction%20workers.JPG">for male construction workers in rural India</a> during the period from 2014-15 to 2020-21 was detected in Kerala <em>(Rs. 810.3)</em>, followed by Jammu and Kashmir <em>(Rs. 445.1)</em>, Tamil Nadu <em>(Rs. 424.1)</em>, Haryana <em>(Rs. 379.9)</em>, Himachal Pradesh <em>(Rs. 368.7)</em>, Rajasthan <em>(Rs. 347.7)</em>, and Punjab <em>(Rs. 339.1)</em>. Kindly see chart-1. </p><p style="text-align:justify">The <a href="https://im4change.org/upload/files/State%20wise%20average%20daily%20nominal%20wage%20rates%20in%20rural%20india%20men%20construction%20workers.JPG" title="https://im4change.org/upload/files/State%20wise%20average%20daily%20nominal%20wage%20rates%20in%20rural%20india%20men%20construction%20workers.JPG">lowest average daily nominal wage rates</a> <a href="https://im4change.org/upload/files/State%20wise%20average%20daily%20nominal%20wage%20rates%20in%20rural%20india%20men%20construction%20workers.JPG" title="https://im4change.org/upload/files/State%20wise%20average%20daily%20nominal%20wage%20rates%20in%20rural%20india%20men%20construction%20workers.JPG">for male construction workers in rural areas</a> during the period from 2014-15 to 2020-21 was found in Madhya Pradesh <em>(Rs. 212.4)</em>, followed by Tripura <em>(Rs. 230.4)</em>, Meghalaya <em>(Rs. 231.7)</em>, Odisha <em>(Rs. 247.1)</em>, Gujarat <em>(Rs. 251.8)</em>, Uttar Pradesh <em>(Rs. 267.4)</em>, Bihar <em>(Rs. 270.8)</em>, and West Bengal <em>(Rs. 274.0)</em>. The related national level figure was Rs. 316.9 during the period from 2014-15 to 2020-21. Kindly consult chart-1.</p><p style="text-align:justify">The <a href="https://im4change.org/upload/files/State%20wise%20growth%20in%20average%20daily%20nominal%20wage%20rates%20in%20rural%20india%20men%20construction%20workers.JPG" title="https://im4change.org/upload/files/State%20wise%20growth%20in%20average%20daily%20nominal%20wage%20rates%20in%20rural%20india%20men%20construction%20workers.JPG">highest average annual growth rates in</a> <a href="https://im4change.org/upload/files/State%20wise%20growth%20in%20average%20daily%20nominal%20wage%20rates%20in%20rural%20india%20men%20construction%20workers.JPG" title="https://im4change.org/upload/files/State%20wise%20growth%20in%20average%20daily%20nominal%20wage%20rates%20in%20rural%20india%20men%20construction%20workers.JPG">nominal wage rates</a> during the period from 2015-16 to 2020-21 was noticed in Meghalaya <em>(20.9 percent)</em>, followed by Madhya Pradesh <em>(7.4 percent)</em>, Odisha and Andhra Pradesh <em>(6.8 percent each)</em>, Uttar Pradesh <em>(6.4 percent)</em>, and Bihar <em>(6.2 percent)</em>. Please see chart-2. </p><p style="text-align:justify">The <a href="https://im4change.org/upload/files/State%20wise%20growth%20in%20average%20daily%20nominal%20wage%20rates%20in%20rural%20india%20men%20construction%20workers.JPG" title="https://im4change.org/upload/files/State%20wise%20growth%20in%20average%20daily%20nominal%20wage%20rates%20in%20rural%20india%20men%20construction%20workers.JPG">lowest average annual growth rates in</a> <a href="https://im4change.org/upload/files/State%20wise%20growth%20in%20average%20daily%20nominal%20wage%20rates%20in%20rural%20india%20men%20construction%20workers.JPG" title="https://im4change.org/upload/files/State%20wise%20growth%20in%20average%20daily%20nominal%20wage%20rates%20in%20rural%20india%20men%20construction%20workers.JPG">nominal wage rates</a> during the same period was observed in Kerala <em>(0.9 percent)</em>, followed by Manipur <em>(2.0 percent)</em>, Haryana <em>(2.1 percent)</em>, Jammu and Kashmir <em>(3.0 percent)</em>, Rajasthan <em>(3.2 percent)</em>, and Gujarat <em>(3.6 percent)</em>. Please see chart-2.</p><p style="text-align:justify">The <a href="https://im4change.org/upload/files/State%20wise%20growth%20in%20average%20daily%20wage%20rates%20in%20real%20terms%20for%20male%20construction%20workers%20in%20rural%20India%281%29.JPG" title="https://im4change.org/upload/files/State%20wise%20growth%20in%20average%20daily%20wage%20rates%20in%20real%20terms%20for%20male%20construction%20workers%20in%20rural%20India%281%29.JPG">average annual growth of construction workers’</a> <a href="https://im4change.org/upload/files/State%20wise%20growth%20in%20average%20daily%20wage%20rates%20in%20real%20terms%20for%20male%20construction%20workers%20in%20rural%20India%281%29.JPG" title="https://im4change.org/upload/files/State%20wise%20growth%20in%20average%20daily%20wage%20rates%20in%20real%20terms%20for%20male%20construction%20workers%20in%20rural%20India%281%29.JPG">wage rates in real terms</a> during the period from 2015-16 to 2020-21 was negative in Assam <em>(-1.2 percent)</em>, Haryana <em>(-2.1 percent)</em>, Jammu and Kashmir <em>(-2.7 percent)</em>, Karnataka <em>(-0.6 percent)</em>, Kerala <em>(-4.4 percent)</em>, Manipur <em>(-6.3 percent)</em>, Rajasthan <em>(-1.2 percent)</em>, Tamil Nadu <em>(-0.9 percent)</em>, and Tripura <em>(-1.1 percent)</em>. Please note that the <a href="https://im4change.org/upload/files/State-wise%20Average%20Inflation%20CPI%20-%20Inflation.PDF" title="https://im4change.org/upload/files/State-wise%20Average%20Inflation%20CPI%20-%20Inflation.PDF">rate of inflation</a> in <a href="https://im4change.org/upload/files/State-wise%20Average%20Inflation%20CPI%20-%20Inflation.PDF" title="https://im4change.org/upload/files/State-wise%20Average%20Inflation%20CPI%20-%20Inflation.PDF">CPI-General</a> has been used to get the average annual growth of construction workers’ wage rates in real terms. Kindly have a look at table-1. </p><p style="text-align:justify">In the case of Meghalaya, the <a href="https://im4change.org/upload/files/State%20wise%20average%20daily%20nominal%20wage%20rates%20in%20rural%20india%20men%20construction%20workers.JPG" title="https://im4change.org/upload/files/State%20wise%20average%20daily%20nominal%20wage%20rates%20in%20rural%20india%20men%20construction%20workers.JPG">nominal daily wage rate of male construction</a> <a href="https://im4change.org/upload/files/State%20wise%20average%20daily%20nominal%20wage%20rates%20in%20rural%20india%20men%20construction%20workers.JPG" title="https://im4change.org/upload/files/State%20wise%20average%20daily%20nominal%20wage%20rates%20in%20rural%20india%20men%20construction%20workers.JPG">workers</a> fell from Rs. 186.0 in 2016-17 to Rs. 100.0 in 2017-18 i.e., a decline by -46.2 percent over previous year. However, the same bounced back to Rs. 273.2 in 2018-19 i.e., an increase by 173.2 percent over previous year. In <a href="https://im4change.org/upload/files/State%20wise%20growth%20in%20average%20daily%20wage%20rates%20in%20real%20terms%20for%20male%20construction%20workers%20in%20rural%20India%281%29.JPG" title="https://im4change.org/upload/files/State%20wise%20growth%20in%20average%20daily%20wage%20rates%20in%20real%20terms%20for%20male%20construction%20workers%20in%20rural%20India%281%29.JPG">real terms, the construction sector</a> <a href="https://im4change.org/upload/files/State%20wise%20growth%20in%20average%20daily%20wage%20rates%20in%20real%20terms%20for%20male%20construction%20workers%20in%20rural%20India%281%29.JPG" title="https://im4change.org/upload/files/State%20wise%20growth%20in%20average%20daily%20wage%20rates%20in%20real%20terms%20for%20male%20construction%20workers%20in%20rural%20India%281%29.JPG">wage rate in Meghalaya</a> grew by -47.7 percent in 2017-18 <em>(over previous year)</em> and 171.0 percent in 2018-19 <em>(over previous year)</em>.</p><p style="text-align:justify">Some states experienced negative <a href="https://im4change.org/upload/files/State%20wise%20growth%20in%20average%20daily%20wage%20rates%20in%20real%20terms%20for%20male%20construction%20workers%20in%20rural%20India%281%29.JPG" title="https://im4change.org/upload/files/State%20wise%20growth%20in%20average%20daily%20wage%20rates%20in%20real%20terms%20for%20male%20construction%20workers%20in%20rural%20India%281%29.JPG">growth in construction workers’</a> <a href="https://im4change.org/upload/files/State%20wise%20growth%20in%20average%20daily%20wage%20rates%20in%20real%20terms%20for%20male%20construction%20workers%20in%20rural%20India%281%29.JPG" title="https://im4change.org/upload/files/State%20wise%20growth%20in%20average%20daily%20wage%20rates%20in%20real%20terms%20for%20male%20construction%20workers%20in%20rural%20India%281%29.JPG">wage rates in real terms</a> for more than two years between 2015-16 and 2020-21. For example, <a href="https://im4change.org/upload/files/State%20wise%20growth%20in%20average%20daily%20wage%20rates%20in%20real%20terms%20for%20male%20construction%20workers%20in%20rural%20India%281%29.JPG" title="https://im4change.org/upload/files/State%20wise%20growth%20in%20average%20daily%20wage%20rates%20in%20real%20terms%20for%20male%20construction%20workers%20in%20rural%20India%281%29.JPG">Assam</a> experienced negative growth in wage rates <em>(in real terms)</em> during 2017-18, 2018-19, 2019-20, and 2020-21. </p><p style="text-align:justify">At the national level, the <a href="https://im4change.org/upload/files/State%20wise%20growth%20in%20average%20daily%20wage%20rates%20in%20real%20terms%20for%20male%20construction%20workers%20in%20rural%20India%281%29.JPG" title="https://im4change.org/upload/files/State%20wise%20growth%20in%20average%20daily%20wage%20rates%20in%20real%20terms%20for%20male%20construction%20workers%20in%20rural%20India%281%29.JPG">construction workers’ wage rates in real terms</a> on average grew by just 0.1 percent annually during the period from 2015-16 to 2020-21.</p><p style="text-align:justify">Kindly <a href="https://docs.google.com/spreadsheets/d/1avu0-WtaKV2RHXtz2eiP7iS8znGVBdKC/edit?usp=sharing&ouid=112233925171588304692&rtpof=true&sd=true" title="https://docs.google.com/spreadsheets/d/1avu0-WtaKV2RHXtz2eiP7iS8znGVBdKC/edit?usp=sharing&ouid=112233925171588304692&rtpof=true&sd=true">click here</a> to access the spreadsheet in order to look at the <a href="/upload/files/State%20wise%20average%20daily%20nominal%20wage%20rates%20in%20rural%20india%20men%20construction%20workers.JPG" title="/upload/files/State%20wise%20average%20daily%20nominal%20wage%20rates%20in%20rural%20india%20men%20construction%20workers.JPG">trends in nominal wage rates</a>, <a href="/upload/files/State%20wise%20growth%20in%20average%20daily%20nominal%20wage%20rates%20in%20rural%20india%20men%20construction%20workers.JPG" title="/upload/files/State%20wise%20growth%20in%20average%20daily%20nominal%20wage%20rates%20in%20rural%20india%20men%20construction%20workers.JPG">annual growth in nominal wage rates</a>, and <a href="/upload/files/State%20wise%20growth%20in%20average%20daily%20wage%20rates%20in%20real%20terms%20for%20male%20construction%20workers%20in%20rural%20India%281%29.JPG" title="/upload/files/State%20wise%20growth%20in%20average%20daily%20wage%20rates%20in%20real%20terms%20for%20male%20construction%20workers%20in%20rural%20India%281%29.JPG">annual growth in real wage rates</a> for construction workers in rural areas. </p><p style="text-align:justify"><strong>Data collection methodology</strong></p><p style="text-align:justify">As a part of Rural Labour Enquiry, the <a href="https://im4change.org/upload/files/ilj_feb_2013.pdf" title="https://im4change.org/upload/files/ilj_feb_2013.pdf">daily wage rates</a> in respect of eighteen agricultural and non-agricultural occupations are being collected along with rural retail price data by the Field Operations Division of the National Sample Survey Organisation since 1986-87, according to a February 2013 <a href="https://im4change.org/upload/files/ilj_feb_2013.pdf" title="https://im4change.org/upload/files/ilj_feb_2013.pdf">edition of the Indian Labour Journal</a>. On the recommendations of the Governing Council of the National Sample Survey Organisation in its 61st meeting, the <a href="https://im4change.org/upload/files/ilj_feb_2013.pdf" title="https://im4change.org/upload/files/ilj_feb_2013.pdf">Labour Bureau</a> started the compilation and analysis of wage rate data with effect from April, 1998. </p><p style="text-align:justify">The Field Operations Division of the National Sample Survey Organisation has been entrusted with the work of <a href="https://im4change.org/upload/files/METHOLOGY%20FOR%20COMPILATION%20OF%20THE%20WAGE%20RATE%20DATA.pdf" title="https://im4change.org/upload/files/METHOLOGY%20FOR%20COMPILATION%20OF%20THE%20WAGE%20RATE%20DATA.pdf">data collection</a>. The <a href="https://im4change.org/upload/files/METHOLOGY%20FOR%20COMPILATION%20OF%20THE%20WAGE%20RATE%20DATA.pdf" title="https://im4change.org/upload/files/METHOLOGY%20FOR%20COMPILATION%20OF%20THE%20WAGE%20RATE%20DATA.pdf">wage rate data</a> are being collected along with rural retail prices from 600 sample villages spread over 66 NSS regions of 20 States by canvassing Block-5 <em>(Annexure-I)</em> of Schedule 3.01(R). The data collection from these sample villages is staggered over the four weeks of a month with one-fourth of them being covered every week. The days of canvassing of Schedule 3.01(R) are fixed. The village functionaries like the Panchayat Secretary, Progress Assistant, Patwari and other Village or Block Officials are the primary informants for collection of data on wage rates. The data on normal working hours and the prevailing wage rates in cash and kind for the reported working hours are collected sex-wise for each of the 18 selected occupations in 20 states, indicates an old <a href="https://im4change.org/upload/files/METHOLOGY%20FOR%20COMPILATION%20OF%20THE%20WAGE%20RATE%20DATA.pdf" title="https://im4change.org/upload/files/METHOLOGY%20FOR%20COMPILATION%20OF%20THE%20WAGE%20RATE%20DATA.pdf">document</a> of the Labour Bureau. </p><p style="text-align:justify">The wage rates are sometimes reported for a duration that is less/more than the normal working hours. In such cases, they are <a href="https://im4change.org/upload/files/METHOLOGY%20FOR%20COMPILATION%20OF%20THE%20WAGE%20RATE%20DATA.pdf" title="https://im4change.org/upload/files/METHOLOGY%20FOR%20COMPILATION%20OF%20THE%20WAGE%20RATE%20DATA.pdf">first normalised for eight hours</a> working day. As regards the mode of payment of wages, it is made in both ways i.e., in cash and/or in kind. The payments made in kind are very common in rural areas, which include foodgrains, cooked food, tea, fuel, cigarette, beedi, fodder, etc. The wages reported in kind are evaluated at local retail prices. Thereafter, the data is thoroughly scrutinised and discrepant points are referred back to the field for clarification. In the next stage, the simple arithmetic average of these normalised daily wage rates is worked out occupation-wise and sex-wise for each state.</p><p style="text-align:justify"><a href="http://ras.org.in/methodology_of_data_collection_unsuited_to_changing_rural_reality" title="http://ras.org.in/methodology_of_data_collection_unsuited_to_changing_rural_reality">Up to June 2000</a>, the average wage rates at the national level were derived by taking the simple average of state figures; since July 2000, the averages have been obtained by dividing the sum total of wages of all 20 states by the number of centres or villages from which data were collected. The state-wise averages are restricted only to those occupations where the number of centres is five or more to avoid abnormal fluctuations and inconsistency in wages paid to different categories of workers on account of varying numbers of centres. However, in order to calculate the all-India averages, all neglected centres are taken into account to arrive at the total number of centres at the national level.</p><p style="text-align:justify">The <a href="/upload/files/RBI%20note%20Average%20Daily%20Wage%20rate%20Methodology.pdf" title="/upload/files/RBI%20note%20Average%20Daily%20Wage%20rate%20Methodology.pdf">Reserve Bank of India</a> <em>(whose data we have used in writing this news alert)</em> has collated and is releasing monthly time series data on rural wage rates based on the data published by the Labour Bureau, Government of India. Starting from November 2013 the Labour Bureau is collecting the rural wage data in respect of 12 agricultural and 13 non-agricultural occupations across 20 major states, namely, Andhra Pradesh, Assam, Bihar, Gujarat, Haryana, Himachal Pradesh, Jammu & Kashmir, Karnataka, Kerala, Madhya Pradesh, Maharashtra, Manipur, Meghalaya, Orissa, Punjab, Rajasthan, Tamil Nadu, Tripura, Uttar Pradesh and West Bengal. The occupations for which the daily wage rates are collected every month are: <u>(A) Agricultural occupations</u> – (1) Ploughing/ Tilling workers, (2) Sowing <em>(including planting/ Transplanting/ Weeding)</em> workers, (3) Harvesting/ Winnowing/ Threshing workers, (4) Picking workers <em>(including Tea, Cotton, Tobacco and other commercial crops)</em>, (5) Horticulture workers <em>(including nursery growers)</em>, (6) Fishermen-inland, (7) Fishermen coastal/deep-sea, (8) Loggers and wood cutters, (9) Animal husbandry workers <em>(including poultry workers, dairy workers and herdsman)</em>, (10) Packaging labourers, agriculture, (11) General agricultural labourers <em>(including watering/ irrigation workers, etc.)</em>, (12) Plant protection workers <em>(applying pesticides, treating seeds, etc.)</em>; and <u>(B) Non-agricultural occupations</u> – (13) Carpenter, (14) Blacksmith, (15) Mason, (16) Weavers, (17) Beedi makers, (18) Bamboo, cane basket weavers, (19) Handicraft workers, (20) Plumbers, (21) Electrician, (22) Construction workers <em>(for roads, dams, industrial & project construction work and Well diggers)</em>, (23) LMV & Tractor drivers, (24) Non-agricultural labourers <em>(including porters, loaders)</em>, and (25) Sweeping/cleaning workers. </p><p style="text-align:justify"><strong><em>References </em></strong></p><p style="text-align:justify">Handbook of Statistics on Indian States 2020-21, released in November 2021, please <a href="https://m.rbi.org.in/scripts/AnnualPublications.aspx?head=Handbook%20of%20Statistics%20on%20Indian%20States" title="https://m.rbi.org.in/scripts/AnnualPublications.aspx?head=Handbook%20of%20Statistics%20on%20Indian%20States">click here</a> to access</p><p style="text-align:justify">State-wise Average Daily Wage Rates in Rural India (Men - General Agricultural Labourers), RBI Handbook of Statistics on Indian States 2020-21, released in November 2021, please <a href="/upload/files/State-wise%20Average%20Daily%20Wage%20Rates%20in%20Rural%20India%20Men%20-%20General%20Agricultural%20Labourers.PDF" title="/upload/files/State-wise%20Average%20Daily%20Wage%20Rates%20in%20Rural%20India%20Men%20-%20General%20Agricultural%20Labourers.PDF">click here</a> to access </p><p style="text-align:justify">State-wise Average Daily Wage Rates in Rural India (Men - Non-Agricultural Labourers), RBI Handbook of Statistics on Indian States 2020-21, released in November 2021, please <a href="/upload/files/State-wise%20Average%20Daily%20Wage%20Rates%20in%20Rural%20India%20Men%20-%20Non%20Agricultural%20Labourers.PDF" title="/upload/files/State-wise%20Average%20Daily%20Wage%20Rates%20in%20Rural%20India%20Men%20-%20Non%20Agricultural%20Labourers.PDF">click here</a> to access </p><p style="text-align:justify">State-wise Average Daily Wage Rates in Rural India (Men - Construction Workers), RBI Handbook of Statistics on Indian States 2020-21, released in November 2021, please <a href="/upload/files/State-wise%20Average%20Daily%20Wage%20Rates%20in%20Rural%20India%20Men%20-%20Construction%20Workers.PDF" title="/upload/files/State-wise%20Average%20Daily%20Wage%20Rates%20in%20Rural%20India%20Men%20-%20Construction%20Workers.PDF">click here</a> to access </p><p style="text-align:justify">State-wise Average Inflation (CPI) - Inflation, RBI Handbook of Statistics on Indian States 2020-21, released in November 2021, please <a href="/upload/files/State-wise%20Average%20Inflation%20CPI%20-%20Inflation.PDF" title="/upload/files/State-wise%20Average%20Inflation%20CPI%20-%20Inflation.PDF">click here</a> to access </p><p style="text-align:justify">Indian Labour Journal, February 2013, please <a href="/upload/files/ilj_feb_2013.pdf" title="/upload/files/ilj_feb_2013.pdf">click here</a> to access </p><p style="text-align:justify">Wage Rates in Rural India 2003-04: Methodology for Compilation of the Wage Rate Data, Labour Bureau, please <a href="/upload/files/METHOLOGY%20FOR%20COMPILATION%20OF%20THE%20WAGE%20RATE%20DATA.pdf" title="/upload/files/METHOLOGY%20FOR%20COMPILATION%20OF%20THE%20WAGE%20RATE%20DATA.pdf">click here</a> to access </p><p style="text-align:justify">Average Daily Wage Rates in Rural India: Methodology and coverage (From November 2013), Reserve Bank of India, please <a href="https://dbie.rbi.org.in" title="https://dbie.rbi.org.in">click here</a> and <a href="/upload/files/RBI%20note%20Average%20Daily%20Wage%20rate%20Methodology%281%29.pdf" title="/upload/files/RBI%20note%20Average%20Daily%20Wage%20rate%20Methodology%281%29.pdf">here</a> to access </p><p style="text-align:justify">Consumer Price Index Numbers on Base 2012=100 for Rural, Urban and Combined for the month of January 2022, Ministry of Statistics and Programme Implementation (MoSPI), National Statistical Office (NSO), released on 14th February 2022, please <a href="/upload/files/CPI%20Press%20Release%20January%202022%281%29.pdf" title="/upload/files/CPI%20Press%20Release%20January%202022%281%29.pdf">click here</a> to access </p><p style="text-align:justify">Methodology of Data Collection Unsuited to Changing Rural Reality: A Study of Agricultural Wage Data in India -Yoshifumi Usami, Arindam Das, and Madhura Swaminathan, Review of Agrarian Studies, Vol. 10, No. 2, July-December, 2020, please <a href="http://ras.org.in/methodology_of_data_collection_unsuited_to_changing_rural_reality" title="http://ras.org.in/methodology_of_data_collection_unsuited_to_changing_rural_reality">click here</a> to access</p><p>Russia-ukraine crisis to push up fertiliser prices, govt subsidies, IANS/ Business Standard, 4 March, 2022, please <a href="https://www.business-standard.com/article/economy-policy/russia-ukraine-crisis-to-push-up-fertiliser-prices-govt-subsidies-122030400560_1.html" title="https://www.business-standard.com/article/economy-policy/russia-ukraine-crisis-to-push-up-fertiliser-prices-govt-subsidies-122030400560_1.html">click here</a> to access </p><p>Cooking oil prices spike in India due to Russia-ukraine crisis -B Krishna Mohan, TelanganaToday.com, 3 March, 2022, please <a href="https://telanganatoday.com/cooking-oil-prices-spike-in-india-due-to-russia-ukraine-crisis" title="https://telanganatoday.com/cooking-oil-prices-spike-in-india-due-to-russia-ukraine-crisis">click here</a> to access </p><p>Govt reviews cooking oil imports as ukraine crisis disrupts supplies, prices shoot up -Amiti Sen and Prabhudutta Mishra, The Hindu Business Line, 4 March, 2022, please <a href="https://www.thehindubusinessline.com/markets/commodities/govt-reviews-cooking-oil-imports-as-ukraine-crisis-disrupts-supplies-prices-shoot-up/article65190879.ece" title="https://www.thehindubusinessline.com/markets/commodities/govt-reviews-cooking-oil-imports-as-ukraine-crisis-disrupts-supplies-prices-shoot-up/article65190879.ece">click here</a> to access </p><p>India's Economy Faces A Potential Stagflation Risk From Ukraine War -Sunil Prabhu, NDTV.com, 1 March, 2022, please <a href="https://www.ndtv.com/business/indias-economy-faces-a-potential-stagflation-risk-from-ukraine-war-2796624" title="https://www.ndtv.com/business/indias-economy-faces-a-potential-stagflation-risk-from-ukraine-war-2796624">click here</a> to access</p><p>India to be one of Asia’s ‘biggest losers’ from the Ukraine war as Russia slammed by global sanctions -Paran Balakrishnan, The Telegraph, 1 March, 2022, please <a href="https://www.telegraphindia.com/business/russia-ukraine-crisis-india-to-be-one-of-asias-biggest-losers-from-the-ukraine-war-as-russia-slammed-by-global-sanctions/cid/1854032" title="https://www.telegraphindia.com/business/russia-ukraine-crisis-india-to-be-one-of-asias-biggest-losers-from-the-ukraine-war-as-russia-slammed-by-global-sanctions/cid/1854032">click here</a> to access</p><p>Crude Oil Prices Rise, Tracking Russia-Ukraine Conflict -Rahul Karunakar, NDTV.com <em>(with inputs from Agencies)</em>, 1 March, 2022, please <a href="https://www.ndtv.com/business/crude-oil-prices-rise-on-tuesday-tracking-russia-ukraine-conflict-2796187" title="https://www.ndtv.com/business/crude-oil-prices-rise-on-tuesday-tracking-russia-ukraine-conflict-2796187">click here</a> to access</p><p>Cooking Oil May Become Costlier Due to Russia-ukraine War. Know Why, News18.com, 27 February, 2022, please <a href="https://www.news18.com/news/business/markets/cooking-oil-may-become-costlier-due-to-russia-ukraine-war-know-why-4812740.html" title="https://www.news18.com/news/business/markets/cooking-oil-may-become-costlier-due-to-russia-ukraine-war-know-why-4812740.html">click here</a> to access </p><p style="text-align:justify"><strong>Image Courtesy: Inclusive Media for Change/ Shambhu Ghatak</strong></p> </font>
</td>
</tr>
<tr>
<td> </td>
</tr>
<tr>
<td height="50" style="border-top:1px solid #000; border-bottom:1px solid #000;padding-top:10px;">
<form><input type="button" value=" Print this page "
onclick="window.print();return false;"/></form>
</td>
</tr>
</table></body>
</html>'
}
$maxBufferLength = (int) 8192
$file = '/home/brlfuser/public_html/vendor/cakephp/cakephp/src/Error/Debugger.php'
$line = (int) 853
$message = 'Unable to emit headers. Headers sent in file=/home/brlfuser/public_html/vendor/cakephp/cakephp/src/Error/Debugger.php line=853'
Cake\Http\ResponseEmitter::emit() - CORE/src/Http/ResponseEmitter.php, line 48
Cake\Http\Server::emit() - CORE/src/Http/Server.php, line 141
[main] - ROOT/webroot/index.php, line 39
Warning (2): Cannot modify header information - headers already sent by (output started at /home/brlfuser/public_html/vendor/cakephp/cakephp/src/Error/Debugger.php:853) [CORE/src/Http/ResponseEmitter.php, line 148]
$response = object(Cake\Http\Response) {
'status' => (int) 200,
'contentType' => 'text/html',
'headers' => [
'Content-Type' => [
[maximum depth reached]
]
],
'file' => null,
'fileRange' => [],
'cookies' => object(Cake\Http\Cookie\CookieCollection) {},
'cacheDirectives' => [],
'body' => '<!DOCTYPE html PUBLIC "-//W3C//DTD XHTML 1.0 Transitional//EN"
"http://www.w3.org/TR/xhtml1/DTD/xhtml1-transitional.dtd">
<html xmlns="http://www.w3.org/1999/xhtml">
<head>
<link rel="canonical" href="https://im4change.in/<pre class="cake-error"><a href="javascript:void(0);" onclick="document.getElementById('cakeErr67edc2d06b76a-trace').style.display = (document.getElementById('cakeErr67edc2d06b76a-trace').style.display == 'none' ? '' : 'none');"><b>Notice</b> (8)</a>: Undefined variable: urlPrefix [<b>APP/Template/Layout/printlayout.ctp</b>, line <b>8</b>]<div id="cakeErr67edc2d06b76a-trace" class="cake-stack-trace" style="display: none;"><a href="javascript:void(0);" onclick="document.getElementById('cakeErr67edc2d06b76a-code').style.display = (document.getElementById('cakeErr67edc2d06b76a-code').style.display == 'none' ? '' : 'none')">Code</a> <a href="javascript:void(0);" onclick="document.getElementById('cakeErr67edc2d06b76a-context').style.display = (document.getElementById('cakeErr67edc2d06b76a-context').style.display == 'none' ? '' : 'none')">Context</a><pre id="cakeErr67edc2d06b76a-code" class="cake-code-dump" style="display: none;"><code><span style="color: #000000"><span style="color: #0000BB"></span><span style="color: #007700"><</span><span style="color: #0000BB">head</span><span style="color: #007700">>
</span></span></code>
<span class="code-highlight"><code><span style="color: #000000"> <link rel="canonical" href="<span style="color: #0000BB"><?php </span><span style="color: #007700">echo </span><span style="color: #0000BB">Configure</span><span style="color: #007700">::</span><span style="color: #0000BB">read</span><span style="color: #007700">(</span><span style="color: #DD0000">'SITE_URL'</span><span style="color: #007700">); </span><span style="color: #0000BB">?><?php </span><span style="color: #007700">echo </span><span style="color: #0000BB">$urlPrefix</span><span style="color: #007700">;</span><span style="color: #0000BB">?><?php </span><span style="color: #007700">echo </span><span style="color: #0000BB">$article_current</span><span style="color: #007700">-></span><span style="color: #0000BB">category</span><span style="color: #007700">-></span><span style="color: #0000BB">slug</span><span style="color: #007700">; </span><span style="color: #0000BB">?></span>/<span style="color: #0000BB"><?php </span><span style="color: #007700">echo </span><span style="color: #0000BB">$article_current</span><span style="color: #007700">-></span><span style="color: #0000BB">seo_url</span><span style="color: #007700">; </span><span style="color: #0000BB">?></span>.html"/>
</span></code></span>
<code><span style="color: #000000"><span style="color: #0000BB"> </span><span style="color: #007700"><</span><span style="color: #0000BB">meta http</span><span style="color: #007700">-</span><span style="color: #0000BB">equiv</span><span style="color: #007700">=</span><span style="color: #DD0000">"Content-Type" </span><span style="color: #0000BB">content</span><span style="color: #007700">=</span><span style="color: #DD0000">"text/html; charset=utf-8"</span><span style="color: #007700">/>
</span></span></code></pre><pre id="cakeErr67edc2d06b76a-context" class="cake-context" style="display: none;">$viewFile = '/home/brlfuser/public_html/src/Template/Layout/printlayout.ctp'
$dataForView = [
'article_current' => object(App\Model\Entity\Article) {
'id' => (int) 62349,
'title' => 'Real wage rates of the rural workers hardly increased during the last 6 years',
'subheading' => null,
'description' => '<p style="text-align:justify">In the absence of income or expenditure-based headcount ratio, the growth in the real wages <em>(i.e., nominal wages adjusted against retail inflation)</em> of the manual workers is considered to be a good proxy to assess the trends in poverty. This is because the manual, unskilled/ semi-skilled labourers exist at the bottom of the pyramid or economic hierarchy, and most of them belong to the social categories Scheduled Castes (SCs) and Scheduled Tribes (STs). A positive growth in their real wages <em>(or real wage rates) </em>is anticipated to improve their purchasing power <em>(i.e., income or consumption expenditure)</em> and lift them out of the poverty trap. &nbsp;</p>
<p style="text-align:justify">Clearly, there exists inter-state differences in nominal wage rates, growth in nominal wage rates and growth in real wage rates, which we will see in this news alert.&nbsp;</p>
<p style="text-align:justify">Against the backdrop of the <a href="https://www.thehindubusinessline.com/markets/commodities/govt-reviews-cooking-oil-imports-as-ukraine-crisis-disrupts-supplies-prices-shoot-up/article65190879.ece">Russia-Ukraine conflict</a>, which is anticipated to cause both <a href="https://www.ndtv.com/business/indias-economy-faces-a-potential-stagflation-risk-from-ukraine-war-2796624">food and fuel retail inflation</a> in India in the coming times, it is even more important to look at the past trends in wage rate growth of the rural workers. It should be noted that the <a href="https://public.flourish.studio/visualisation/8706137">year-on-year inflation</a> in <a href="https://public.flourish.studio/visualisation/8706137">Consumer</a> <a href="https://public.flourish.studio/visualisation/8706137">Price Index Rural</a> exceeded the <a href="https://public.flourish.studio/visualisation/8706137">year-on-year inflation</a> in <a href="https://public.flourish.studio/visualisation/8706137">CPI Urban</a> during January 2022 at the national level. Even before the beginning of Russia-Ukraine conflict <em>(i.e., during January 2022)</em>, in rural areas, <a href="https://im4change.org/upload/files/CPI%20Press%20Release%20January%202022%281%29.pdf">retail inflation rate of 20.6 percent</a> was noticed for &#39;oils and fats&#39;, aside from&nbsp;<a href="https://im4change.org/upload/files/CPI%20Press%20Release%20January%202022%281%29.pdf">8.44 percent retail inflation for &#39;fuel and light&#39;</a>, <a href="https://im4change.org/upload/files/CPI%20Press%20Release%20January%202022%281%29.pdf">8.27 percent</a> for &#39;transport and communication&#39;, and <a href="https://im4change.org/upload/files/CPI%20Press%20Release%20January%202022%281%29.pdf">9.65 percent for &#39;clothing and footwear&#39;</a>.&nbsp; &nbsp;&nbsp;</p>
<p style="text-align:justify">At the national level, the average daily nominal wage rate&nbsp;for male construction workers in rural areas during the period from 2014-15 to 2020-21 was Rs. 316.9, which was greater than that of the male non-farm workers in rural areas. The average daily nominal wage rate&nbsp;for male non-agricultural labourers in rural areas during the period from 2014-15 to 2020-21 was Rs. 273.8, which exceeded the average daily nominal wage rates for male farm labourers in rural areas <em>(i.e., Rs. 265.1)</em>. However, in Andhra Pradesh, Haryana, Himachal Pradesh, Jammu and Kashmir,&nbsp;Karnataka, Kerala, Meghalaya, Punjab, and Tripura, the average daily nominal wage rates for male agricultural labourers in rural areas during the period from 2014-15 to 2020-21 exceeded the average daily nominal wage rates for male non-farm labourers in rural areas. Please see chart-1.</p>
<p style="text-align:justify"><img alt="" src="/upload/images/Chart%201.png" style="height:670px; width:1000px" /></p>
<p style="text-align:justify"><em><strong>Notes:</strong> The average (i.e., arithmetic mean) daily nominal wage rates for various categories of workers in rural India in the period from 2014-15 to 2020-21 has been calculated by the Inclusive Media for Change staff</em></p>
<p style="text-align:justify"><em>Please <a href="https://docs.google.com/spreadsheets/d/1avu0-WtaKV2RHXtz2eiP7iS8znGVBdKC/edit?usp=sharing&amp;ouid=112233925171588304692&amp;rtpof=true&amp;sd=true">click here</a> to access the data in spreadsheet format</em></p>
<p style="text-align:justify"><em><strong>Source:&nbsp;</strong>Handbook of Statistics on Indian States 2020-21, released in November 2021, please <a href="https://m.rbi.org.in/scripts/AnnualPublications.aspx?head=Handbook%20of%20Statistics%20on%20Indian%20States">click here</a> to access</em></p>
<p style="text-align:justify"><em>State-wise Average Daily Wage Rates in Rural India (Men - General Agricultural Labourers), RBI Handbook of Statistics on Indian States 2020-21, released in November 2021, please <a href="/upload/files/State-wise%20Average%20Daily%20Wage%20Rates%20in%20Rural%20India%20Men%20-%20General%20Agricultural%20Labourers.PDF">click here</a> to access&nbsp;</em></p>
<p style="text-align:justify"><em>State-wise Average Daily Wage Rates in Rural India (Men - Non-Agricultural Labourers), RBI Handbook of Statistics on Indian States 2020-21, released in November 2021, please <a href="/upload/files/State-wise%20Average%20Daily%20Wage%20Rates%20in%20Rural%20India%20Men%20-%20Non%20Agricultural%20Labourers.PDF">click here</a> to access&nbsp;</em></p>
<p style="text-align:justify"><em>State-wise Average Daily Wage Rates in Rural India (Men - Construction Workers), RBI Handbook of Statistics on Indian States 2020-21, released in November 2021, please <a href="/upload/files/State-wise%20Average%20Daily%20Wage%20Rates%20in%20Rural%20India%20Men%20-%20Construction%20Workers.PDF">click here</a> to access&nbsp;</em></p>
<p style="text-align:justify"><em>State-wise Average Inflation (CPI) - Inflation, RBI Handbook of Statistics on Indian States 2020-21, released in November 2021, please <a href="/upload/files/State-wise%20Average%20Inflation%20CPI%20-%20Inflation.PDF">click here</a> to access&nbsp;</em></p>
<p style="text-align:justify"><strong>---</strong></p>
<p style="text-align:justify">At the national level, the agricultural nominal wage rate&nbsp;grew faster than the non-farm wage&nbsp;rate&nbsp;on average for male labourers in rural areas during the period from 2015-16 to 2020-21. However, in states like Assam, Bihar, Haryana, Madhya Pradesh, Odisha, Punjab, and West Bengal, the non-farm nominal wage rates grew faster than the farm wage rates on average for male workers in rural areas during the period from 2015-16 to 2020-21. Please see chart-2.&nbsp;</p>
<p style="text-align:justify"><img alt="" src="/upload/images/Chart%202.png" style="height:653px; width:1000px" /></p>
<p style="text-align:justify"><em><strong>Notes: </strong>The average growth in daily nominal wage rates for various categories of workers in rural India in the period from 2015-16 to 2020-21 has been calculated by the Inclusive Media for Change staff</em></p>
<p style="text-align:justify"><em>Please <a href="https://docs.google.com/spreadsheets/d/1avu0-WtaKV2RHXtz2eiP7iS8znGVBdKC/edit?usp=sharing&amp;ouid=112233925171588304692&amp;rtpof=true&amp;sd=true">click here</a> to access the data in spreadsheet format</em></p>
<p style="text-align:justify"><em><strong>Source: </strong>Same as above</em><br />
<strong>---</strong></p>
<p style="text-align:justify">At the national level, the construction sector nominal wage rate&nbsp;grew slower than the non-agricultural wage&nbsp;rate&nbsp;on average for male labourers in rural areas during the period from 2015-16 to 2020-21. However, in states like Andhra Pradesh, Bihar, Himachal Pradesh, Maharashtra, Meghalaya, Punjab,&nbsp;Tamil Nadu, and Uttar Pradesh, the construction sector nominal wage rates grew faster than the non-farm wage rates on average for male workers in rural areas during the period from 2015-16 to 2020-21. Please take a look at chart-2. &nbsp;</p>
<p style="text-align:justify">At the national level, the agricultural wage rate&nbsp;in real terms grew faster than the non-farm wage rate&nbsp;on average for male labourers in rural areas during the period from 2015-16 to 2020-21. However, in states like Assam, Bihar, Haryana, Madhya Pradesh, Odisha, Punjab, and West Bengal, the non-farm wage rates in real terms grew faster than the farm wage rates on average for male workers in rural areas during the period from 2015-16 to 2020-21. Please see table-1.</p>
<p style="text-align:justify"><strong>Table 1: State-wise Growth in Average Daily Wage Rates in Real terms for Male Agricultural Labourers, Male Non-Agricultural Labourers, and Male Construction Workers in Rural India, in %</strong><br />
<img alt="" src="/upload/images/Table%201%20State-wise%20Growth%20in%20Average%20Daily%20Wage%20Rates%20in%20Real%20terms%20for%20Male%20Agricultural%20Labourers%20Male%20Non-Agricultural%20Labourers%20and%20Male%20Construction%20Workers%20in%20Rural%20India%20in%20percent.png" style="height:539px; width:750px" /></p>
<p style="text-align:justify"><em><strong>Notes: </strong>The average growth in daily wage rates in real terms for various categories of workers in rural India in the period from 2015-16 to 2020-21 has been calculated by the Inclusive Media for Change staff</em></p>
<p style="text-align:justify"><em>Please <a href="https://docs.google.com/spreadsheets/d/1avu0-WtaKV2RHXtz2eiP7iS8znGVBdKC/edit?usp=sharing&amp;ouid=112233925171588304692&amp;rtpof=true&amp;sd=true">click here</a> to access the data in spreadsheet format</em></p>
<p style="text-align:justify"><em><strong>Source: </strong>Same as above</em><br />
<strong>---</strong></p>
<p style="text-align:justify">At the national level, the construction sector wage rate&nbsp;in real terms grew slower than the non-agricultural wage rate&nbsp;on average for male labourers in rural areas during the period from 2015-16 to 2020-21. However, in states like Andhra Pradesh, Bihar, Himachal Pradesh, Maharashtra, Meghalaya, Punjab, Tamil Nadu, and Uttar Pradesh, the construction sector wage rates in real terms grew faster than the non-farm wage rates on average for male workers in rural areas during the period from 2015-16 to 2020-21. Please take a look at table-1. &nbsp;</p>
<p style="text-align:justify">In the following paragraphs, we have discussed the trends in agricultural wage rates, non-farm wage rates, and construction sector wage rates <em>(in rural areas)</em> in detail.&nbsp;</p>
<p style="text-align:justify"><strong>Agricultural wages in rural areas</strong></p>
<p style="text-align:justify">The highest <a href="https://im4change.org/upload/files/State%20wise%20average%20daily%20nominal%20wage%20rates%20in%20rural%20india%20men%20farm%20labourers.JPG">average daily nominal wage rate</a> <a href="https://im4change.org/upload/files/State%20wise%20average%20daily%20nominal%20wage%20rates%20in%20rural%20india%20men%20farm%20labourers.JPG">for male agricultural labourers</a> in rural India during the period from 2014-15 to 2020-21 was found in Kerala <em>(Rs. 653.93)</em>, followed by Jammu and Kashmir <em>(Rs. 429.19)</em>, Tamil Nadu <em>(Rs. 385.6)</em>, Haryana <em>(Rs. 368.53)</em>, Himachal Pradesh <em>(Rs. 366.23)</em>, and Punjab <em>(Rs. 325.31)</em>. Please have a look at chart-1.</p>
<p style="text-align:justify">The lowest <a href="https://im4change.org/upload/files/State%20wise%20average%20daily%20nominal%20wage%20rates%20in%20rural%20india%20men%20farm%20labourers.JPG">average daily nominal wage rate</a> <a href="https://im4change.org/upload/files/State%20wise%20average%20daily%20nominal%20wage%20rates%20in%20rural%20india%20men%20farm%20labourers.JPG">for male agricultural labourers</a> in rural India during the period from 2014-15 to 2020-21 was observed in Madhya Pradesh <em>(Rs. 183.97)</em>, followed by Gujarat <em>(Rs. 190.07)</em>, Maharashtra <em>(Rs. 215.71)</em>, Odisha <em>(Rs. 216.87)</em>, Meghalaya <em>(Rs. 219.93)</em>, Bihar <em>(Rs. 230.43)</em>, Uttar Pradesh <em>(Rs. 230.5)</em>, and Assam <em>(Rs. 237.3)</em>. The related national level figure was Rs. 265.09 during the period from 2014-15 to 2020-21. Please consult chart-1.&nbsp;</p>
<p style="text-align:justify">The highest <a href="https://im4change.org/upload/files/State%20wise%20growth%20in%20average%20daily%20nominal%20wage%20rates%20in%20rural%20india%20men%20farm%20labourers.JPG">average annual growth rate in</a> <a href="https://im4change.org/upload/files/State%20wise%20growth%20in%20average%20daily%20nominal%20wage%20rates%20in%20rural%20india%20men%20farm%20labourers.JPG">nominal wage rates</a> during the period from 2015-16 to 2020-21 was found in Karnataka <em>(7.3 percent)</em>, followed by Andhra Pradesh <em>(6.8 percent)</em>, Madhya Pradesh <em>(6.4 percent)</em>, Uttar Pradesh <em>(6.2 percent)</em>, Odisha <em>(6.1 percent)</em>, and Meghalaya <em>(6.0 percent)</em>. Please see chart-2.</p>
<p style="text-align:justify">The lowest <a href="https://im4change.org/upload/files/State%20wise%20growth%20in%20average%20daily%20nominal%20wage%20rates%20in%20rural%20india%20men%20farm%20labourers.JPG">average annual growth rate</a> <a href="https://im4change.org/upload/files/State%20wise%20growth%20in%20average%20daily%20nominal%20wage%20rates%20in%20rural%20india%20men%20farm%20labourers.JPG">in nominal wage rates</a> during the same period was noticed in Haryana <em>(2.1 percent)</em>, followed by Rajasthan <em>(3.3 percent)</em>, Kerala <em>(3.5 percent)</em>, Punjab <em>(3.9 percent)</em>, and Tamil Nadu <em>(4.5 percent)</em>. Please consult chart-2.</p>
<p style="text-align:justify">The average annual <a href="https://im4change.org/upload/files/State%20wise%20growth%20in%20average%20daily%20wage%20rates%20in%20real%20terms%20for%20male%20farm%20labourers%20in%20rural%20India.JPG">growth of agricultural labourers&rsquo;</a> <a href="https://im4change.org/upload/files/State%20wise%20growth%20in%20average%20daily%20wage%20rates%20in%20real%20terms%20for%20male%20farm%20labourers%20in%20rural%20India.JPG">wage rates in real terms</a> during the period from 2015-16 to 2020-21 were negative in Haryana <em>(-2.1 percent)</em>, Jammu and Kashmir <em>(-0.3 percent)</em>, Kerala <em>(-1.7 percent)</em>, Punjab <em>(-0.4 percent)</em>, Rajasthan <em>(-1.1 percent)</em>, Tamil Nadu <em>(-0.8 percent)</em>, Tripura <em>(-0.5 percent)</em>, and West Bengal <em>(-0.1 percent)</em>. It should be noted that the <a href="https://im4change.org/upload/files/State-wise%20Average%20Inflation%20CPI%20-%20Inflation.PDF">rate of inflation</a> in <a href="https://im4change.org/upload/files/State-wise%20Average%20Inflation%20CPI%20-%20Inflation.PDF">Consumer Price Index-General</a> has been used to get the average annual growth of agricultural labourers&rsquo; wage rates in real terms. Kindly consult table-1. &nbsp;</p>
<p style="text-align:justify">Some states witnessed negative <a href="https://im4change.org/upload/files/State%20wise%20growth%20in%20average%20daily%20wage%20rates%20in%20real%20terms%20for%20male%20farm%20labourers%20in%20rural%20India.JPG">growth in agricultural labourers&rsquo;</a> <a href="https://im4change.org/upload/files/State%20wise%20growth%20in%20average%20daily%20wage%20rates%20in%20real%20terms%20for%20male%20farm%20labourers%20in%20rural%20India.JPG">wage rates in real terms</a> for more than two years between 2015-16 and 2020-21. For example, <a href="https://im4change.org/upload/files/State%20wise%20growth%20in%20average%20daily%20wage%20rates%20in%20real%20terms%20for%20male%20farm%20labourers%20in%20rural%20India.JPG">Haryana</a> experienced negative growth in 2015-16, 2016-17, 2017-18, 2019-20, and 2020-21. Likewise, <a href="https://im4change.org/upload/files/State%20wise%20growth%20in%20average%20daily%20wage%20rates%20in%20real%20terms%20for%20male%20farm%20labourers%20in%20rural%20India.JPG">Kerala</a> faced negative growth in 2017-18, 2018-19, 2019-20, and 2020-21. &nbsp;</p>
<p style="text-align:justify">At the national level, the <a href="https://im4change.org/upload/files/State%20wise%20growth%20in%20average%20daily%20wage%20rates%20in%20real%20terms%20for%20male%20farm%20labourers%20in%20rural%20India.JPG">agricultural labourers&rsquo;</a> <a href="https://im4change.org/upload/files/State%20wise%20growth%20in%20average%20daily%20wage%20rates%20in%20real%20terms%20for%20male%20farm%20labourers%20in%20rural%20India.JPG">wage rates in real terms</a> on average grew by 1.0 percent annually during the period from 2015-16 to 2020-21.</p>
<p style="text-align:justify">Please <a href="https://docs.google.com/spreadsheets/d/1avu0-WtaKV2RHXtz2eiP7iS8znGVBdKC/edit?usp=sharing&amp;ouid=112233925171588304692&amp;rtpof=true&amp;sd=true">click here</a> to access the spreadsheet in order to look at the trends in <a href="/upload/files/State%20wise%20average%20daily%20nominal%20wage%20rates%20in%20rural%20india%20men%20farm%20labourers.JPG">nominal wage rates</a>, <a href="/upload/files/State%20wise%20growth%20in%20average%20daily%20nominal%20wage%20rates%20in%20rural%20india%20men%20farm%20labourers.JPG">annual growth in nominal wage rates</a> and <a href="/upload/files/State%20wise%20growth%20in%20average%20daily%20wage%20rates%20in%20real%20terms%20for%20male%20farm%20labourers%20in%20rural%20India.JPG">annual growth in real wage rates</a> for farm labourers in rural areas.&nbsp;</p>
<p style="text-align:justify"><strong>Non-agricultural wages in rural areas</strong></p>
<p style="text-align:justify">The rural economy is not just about farming any longer. That is why we have looked at the wage growth in the non-farm sector too.&nbsp;The highest <a href="https://im4change.org/upload/files/State%20wise%20average%20daily%20nominal%20wage%20rates%20in%20rural%20india%20men%20non%20farm%20labourers.JPG">average daily nominal wage rate for male</a> <a href="https://im4change.org/upload/files/State%20wise%20average%20daily%20nominal%20wage%20rates%20in%20rural%20india%20men%20non%20farm%20labourers.JPG">non-agricultural labourers</a> in rural India during the period from 2014-15 to 2020-21 was detected in Kerala <em>(Rs. 639.01)</em>, followed by Jammu and Kashmir <em>(Rs. 426.37)</em>, Tamil Nadu <em>(Rs. 405.77)</em>, Haryana <em>(Rs. 359.24)</em>, Himachal Pradesh <em>(Rs. 311.10)</em>, and Punjab <em>(Rs. 309.09)</em>. Please see chart-1.</p>
<p style="text-align:justify">The lowest average <a href="https://im4change.org/upload/files/State%20wise%20average%20daily%20nominal%20wage%20rates%20in%20rural%20india%20men%20non%20farm%20labourers.JPG">daily nominal wage rate for male</a> <a href="https://im4change.org/upload/files/State%20wise%20average%20daily%20nominal%20wage%20rates%20in%20rural%20india%20men%20non%20farm%20labourers.JPG">non-agricultural labourers in rural India</a> during the period from 2014-15 to 2020-21 was found in Madhya Pradesh <em>(Rs. 191.47)</em>, followed by Meghalaya <em>(Rs. 210.26)</em>, Gujarat <em>(Rs. 213.51)</em>, Odisha <em>(Rs. 218.06)</em>, Maharashtra <em>(Rs. 226.70)</em>, Tripura <em>(Rs. 230.36)</em>, Bihar <em>(Rs. 243.51)</em>, and Uttar Pradesh <em>(Rs. 243.97)</em>. The related national level figure was Rs. 273.79 during the period from 2014-15 to 2020-21. Please see chart-1.</p>
<p style="text-align:justify">The highest <a href="https://im4change.org/upload/files/State%20wise%20growth%20in%20average%20daily%20nominal%20wage%20rates%20in%20rural%20india%20men%20non%20farm%20labourers.JPG">average annual growth rate in</a> <a href="https://im4change.org/upload/files/State%20wise%20growth%20in%20average%20daily%20nominal%20wage%20rates%20in%20rural%20india%20men%20non%20farm%20labourers.JPG">nominal wage rates</a> during the period from 2015-16 to 2020-21 was noticed in Odisha <em>(8.0 percent)</em>, followed by Madhya Pradesh <em>(7.6 percent)</em>, Assam <em>(6.6 percent)</em>, West Bengal <em>(5.9 percent)</em>, Uttar Pradesh and Andhra Pradesh <em>(5.6 percent each)</em>, and Bihar <em>(5.5 percent)</em>. Kindly consult chart-2.</p>
<p style="text-align:justify">The lowest <a href="https://im4change.org/upload/files/State%20wise%20growth%20in%20average%20daily%20nominal%20wage%20rates%20in%20rural%20india%20men%20non%20farm%20labourers.JPG">average annual growth rate</a> <a href="https://im4change.org/upload/files/State%20wise%20growth%20in%20average%20daily%20nominal%20wage%20rates%20in%20rural%20india%20men%20non%20farm%20labourers.JPG">in nominal wage rates</a> during the same period was observed in Kerala <em>(1.8 percent)</em>, followed by Haryana <em>(2.4 percent)</em>, Meghalaya <em>(2.8 percent)</em>, Tamil Nadu and Rajasthan <em>(3.2 percent each)</em>, Tripura and Jammu and Kashmir <em>(4.0 percent each),</em> and Maharashtra and Punjab <em>(4.2 percent each)</em>. Kindly consult chart-2.&nbsp;</p>
<p style="text-align:justify">The average annual <a href="https://im4change.org/upload/files/State%20wise%20growth%20in%20average%20daily%20wage%20rates%20in%20real%20terms%20for%20male%20non%20farm%20labourers%20in%20rural%20India.JPG">growth of non-agricultural labourers&rsquo;</a> <a href="https://im4change.org/upload/files/State%20wise%20growth%20in%20average%20daily%20wage%20rates%20in%20real%20terms%20for%20male%20non%20farm%20labourers%20in%20rural%20India.JPG">wage rates in real terms</a> during the period from 2015-16 to 2020-21 were negative in Haryana <em>(-1.9 percent)</em>, Jammu and Kashmir <em>(-1.7 percent)</em>, Kerala <em>(-3.5 percent)</em>, Maharashtra <em>(-0.3 percent)</em>, Meghalaya <em>(-1.2 percent)</em>, Punjab <em>(-0.1 percent)</em>, Rajasthan <em>(-1.2 percent)</em>, Tamil Nadu <em>(-2.1 percent)</em>, and Tripura <em>(-1.1 percent)</em>. It should be noted that the <a href="https://im4change.org/upload/files/State-wise%20Average%20Inflation%20CPI%20-%20Inflation.PDF">rate of inflation</a> in <a href="https://im4change.org/upload/files/State-wise%20Average%20Inflation%20CPI%20-%20Inflation.PDF">CPI-General</a> has been used to get the average annual growth of non-agricultural labourers&rsquo; wage rates in real terms. Kindly have a look at table-1. &nbsp;&nbsp;</p>
<p style="text-align:justify">Some states experienced negative growth in <a href="https://im4change.org/upload/files/State%20wise%20growth%20in%20average%20daily%20wage%20rates%20in%20real%20terms%20for%20male%20non%20farm%20labourers%20in%20rural%20India.JPG">non-agricultural labourers&rsquo; wage</a> <a href="https://im4change.org/upload/files/State%20wise%20growth%20in%20average%20daily%20wage%20rates%20in%20real%20terms%20for%20male%20non%20farm%20labourers%20in%20rural%20India.JPG">rates in real terms</a> for more than two years between 2015-16 and 2020-21. For example, <a href="https://im4change.org/upload/files/State%20wise%20growth%20in%20average%20daily%20wage%20rates%20in%20real%20terms%20for%20male%20non%20farm%20labourers%20in%20rural%20India.JPG">Haryana</a> experienced negative <a href="https://im4change.org/upload/files/State%20wise%20growth%20in%20average%20daily%20wage%20rates%20in%20real%20terms%20for%20male%20non%20farm%20labourers%20in%20rural%20India.JPG">growth in wage rates</a> <a href="https://im4change.org/upload/files/State%20wise%20growth%20in%20average%20daily%20wage%20rates%20in%20real%20terms%20for%20male%20non%20farm%20labourers%20in%20rural%20India.JPG"><em>(in real terms)</em></a> during 2016-17, 2017-18, 2018-19, 2019-20, and 2020-21. Likewise, <a href="https://im4change.org/upload/files/State%20wise%20growth%20in%20average%20daily%20wage%20rates%20in%20real%20terms%20for%20male%20non%20farm%20labourers%20in%20rural%20India.JPG">Kerala</a> faced negative growth rates in 2015-16, 2016-17, 2017-18, 2019-20, and 2020-21. &nbsp;</p>
<p style="text-align:justify">At the national level, the&nbsp;<a href="https://im4change.org/upload/files/State%20wise%20growth%20in%20average%20daily%20wage%20rates%20in%20real%20terms%20for%20male%20non%20farm%20labourers%20in%20rural%20India.JPG">non-agricultural labourers&rsquo;</a> <a href="https://im4change.org/upload/files/State%20wise%20growth%20in%20average%20daily%20wage%20rates%20in%20real%20terms%20for%20male%20non%20farm%20labourers%20in%20rural%20India.JPG">wage rates in real terms</a> on average grew by just 0.3 percent annually during the period from 2015-16 to 2020-21.&nbsp;</p>
<p style="text-align:justify">Please <a href="https://docs.google.com/spreadsheets/d/1avu0-WtaKV2RHXtz2eiP7iS8znGVBdKC/edit?usp=sharing&amp;ouid=112233925171588304692&amp;rtpof=true&amp;sd=true">click here</a> to access the spreadsheet in order to look at the <a href="/upload/files/State%20wise%20average%20daily%20nominal%20wage%20rates%20in%20rural%20india%20men%20non%20farm%20labourers.JPG">trends in nominal wage rates</a>, <a href="/upload/files/State%20wise%20growth%20in%20average%20daily%20nominal%20wage%20rates%20in%20rural%20india%20men%20non%20farm%20labourers.JPG">annual growth in nominal wage rates</a>, and <a href="/upload/files/State%20wise%20growth%20in%20average%20daily%20wage%20rates%20in%20real%20terms%20for%20male%20non%20farm%20labourers%20in%20rural%20India.JPG">annual growth in real wage rates</a> for non-farm labourers in rural areas.&nbsp;</p>
<p style="text-align:justify"><strong>Construction sector wages in rural areas</strong></p>
<p style="text-align:justify">The <a href="https://im4change.org/upload/files/State%20wise%20average%20daily%20nominal%20wage%20rates%20in%20rural%20india%20men%20construction%20workers.JPG">highest average daily nominal wage rates</a> <a href="https://im4change.org/upload/files/State%20wise%20average%20daily%20nominal%20wage%20rates%20in%20rural%20india%20men%20construction%20workers.JPG">for male construction workers in rural India</a> during the period from 2014-15 to 2020-21 was detected in Kerala <em>(Rs. 810.3)</em>, followed by Jammu and Kashmir <em>(Rs. 445.1)</em>, Tamil Nadu <em>(Rs. 424.1)</em>, Haryana <em>(Rs. 379.9)</em>, Himachal Pradesh <em>(Rs. 368.7)</em>, Rajasthan <em>(Rs. 347.7)</em>, and Punjab <em>(Rs. 339.1)</em>. Kindly see chart-1.&nbsp;</p>
<p style="text-align:justify">The <a href="https://im4change.org/upload/files/State%20wise%20average%20daily%20nominal%20wage%20rates%20in%20rural%20india%20men%20construction%20workers.JPG">lowest average daily nominal wage rates</a> <a href="https://im4change.org/upload/files/State%20wise%20average%20daily%20nominal%20wage%20rates%20in%20rural%20india%20men%20construction%20workers.JPG">for male construction workers in rural areas</a> during the period from 2014-15 to 2020-21 was found in Madhya Pradesh <em>(Rs. 212.4)</em>, followed by Tripura <em>(Rs. 230.4)</em>, Meghalaya <em>(Rs. 231.7)</em>, Odisha <em>(Rs. 247.1)</em>, Gujarat <em>(Rs. 251.8)</em>, Uttar Pradesh <em>(Rs. 267.4)</em>, Bihar <em>(Rs. 270.8)</em>, and West Bengal <em>(Rs. 274.0)</em>. The related national level figure was Rs. 316.9 during the period from 2014-15 to 2020-21. Kindly consult chart-1.</p>
<p style="text-align:justify">The <a href="https://im4change.org/upload/files/State%20wise%20growth%20in%20average%20daily%20nominal%20wage%20rates%20in%20rural%20india%20men%20construction%20workers.JPG">highest average annual growth rates in</a> <a href="https://im4change.org/upload/files/State%20wise%20growth%20in%20average%20daily%20nominal%20wage%20rates%20in%20rural%20india%20men%20construction%20workers.JPG">nominal wage rates</a> during the period from 2015-16 to 2020-21 was noticed in Meghalaya <em>(20.9 percent)</em>, followed by Madhya Pradesh <em>(7.4 percent)</em>, Odisha and Andhra Pradesh <em>(6.8 percent each)</em>, Uttar Pradesh <em>(6.4 percent)</em>, and Bihar <em>(6.2 percent)</em>. Please see chart-2.&nbsp;</p>
<p style="text-align:justify">The <a href="https://im4change.org/upload/files/State%20wise%20growth%20in%20average%20daily%20nominal%20wage%20rates%20in%20rural%20india%20men%20construction%20workers.JPG">lowest average annual growth rates in</a> <a href="https://im4change.org/upload/files/State%20wise%20growth%20in%20average%20daily%20nominal%20wage%20rates%20in%20rural%20india%20men%20construction%20workers.JPG">nominal wage rates</a> during the same period was observed in Kerala <em>(0.9 percent)</em>, followed by Manipur <em>(2.0 percent)</em>, Haryana <em>(2.1 percent)</em>, Jammu and Kashmir <em>(3.0 percent)</em>, Rajasthan <em>(3.2 percent)</em>, and Gujarat <em>(3.6 percent)</em>. Please see chart-2.</p>
<p style="text-align:justify">The <a href="https://im4change.org/upload/files/State%20wise%20growth%20in%20average%20daily%20wage%20rates%20in%20real%20terms%20for%20male%20construction%20workers%20in%20rural%20India%281%29.JPG">average annual growth of construction workers&rsquo;</a> <a href="https://im4change.org/upload/files/State%20wise%20growth%20in%20average%20daily%20wage%20rates%20in%20real%20terms%20for%20male%20construction%20workers%20in%20rural%20India%281%29.JPG">wage rates in real terms</a> during the period from 2015-16 to 2020-21 was negative in Assam <em>(-1.2 percent)</em>, Haryana <em>(-2.1 percent)</em>, Jammu and Kashmir <em>(-2.7 percent)</em>, Karnataka <em>(-0.6 percent)</em>, Kerala <em>(-4.4 percent)</em>, Manipur <em>(-6.3 percent)</em>, Rajasthan <em>(-1.2 percent)</em>, Tamil Nadu <em>(-0.9 percent)</em>, and Tripura <em>(-1.1 percent)</em>. Please note that the <a href="https://im4change.org/upload/files/State-wise%20Average%20Inflation%20CPI%20-%20Inflation.PDF">rate of inflation</a> in <a href="https://im4change.org/upload/files/State-wise%20Average%20Inflation%20CPI%20-%20Inflation.PDF">CPI-General</a> has been used to get the average annual growth of construction workers&rsquo; wage rates in real terms. Kindly have a look at table-1. &nbsp;&nbsp;</p>
<p style="text-align:justify">In the case of Meghalaya, the <a href="https://im4change.org/upload/files/State%20wise%20average%20daily%20nominal%20wage%20rates%20in%20rural%20india%20men%20construction%20workers.JPG">nominal daily wage rate of male construction</a> <a href="https://im4change.org/upload/files/State%20wise%20average%20daily%20nominal%20wage%20rates%20in%20rural%20india%20men%20construction%20workers.JPG">workers</a> fell from Rs. 186.0 in 2016-17 to Rs. 100.0 in 2017-18 i.e., a decline&nbsp;by -46.2 percent over previous year. However, the same bounced back to Rs. 273.2 in 2018-19 i.e., an increase by 173.2 percent over previous year. In <a href="https://im4change.org/upload/files/State%20wise%20growth%20in%20average%20daily%20wage%20rates%20in%20real%20terms%20for%20male%20construction%20workers%20in%20rural%20India%281%29.JPG">real terms, the construction sector</a> <a href="https://im4change.org/upload/files/State%20wise%20growth%20in%20average%20daily%20wage%20rates%20in%20real%20terms%20for%20male%20construction%20workers%20in%20rural%20India%281%29.JPG">wage rate in Meghalaya</a> grew by -47.7 percent in 2017-18 <em>(over previous year)</em> and 171.0 percent in 2018-19 <em>(over previous year)</em>.</p>
<p style="text-align:justify">Some states experienced negative <a href="https://im4change.org/upload/files/State%20wise%20growth%20in%20average%20daily%20wage%20rates%20in%20real%20terms%20for%20male%20construction%20workers%20in%20rural%20India%281%29.JPG">growth in construction workers&rsquo;</a> <a href="https://im4change.org/upload/files/State%20wise%20growth%20in%20average%20daily%20wage%20rates%20in%20real%20terms%20for%20male%20construction%20workers%20in%20rural%20India%281%29.JPG">wage rates in real terms</a> for more than two years between 2015-16 and 2020-21. For example, <a href="https://im4change.org/upload/files/State%20wise%20growth%20in%20average%20daily%20wage%20rates%20in%20real%20terms%20for%20male%20construction%20workers%20in%20rural%20India%281%29.JPG">Assam</a> experienced negative growth in wage rates <em>(in real terms)</em> during 2017-18, 2018-19, 2019-20, and 2020-21. &nbsp;</p>
<p style="text-align:justify">At the national level, the&nbsp;<a href="https://im4change.org/upload/files/State%20wise%20growth%20in%20average%20daily%20wage%20rates%20in%20real%20terms%20for%20male%20construction%20workers%20in%20rural%20India%281%29.JPG">construction workers&rsquo; wage rates in real terms</a> on average grew by just 0.1 percent annually during the period from 2015-16 to 2020-21.</p>
<p style="text-align:justify">Kindly <a href="https://docs.google.com/spreadsheets/d/1avu0-WtaKV2RHXtz2eiP7iS8znGVBdKC/edit?usp=sharing&amp;ouid=112233925171588304692&amp;rtpof=true&amp;sd=true">click here</a> to access the spreadsheet in order to look at the <a href="/upload/files/State%20wise%20average%20daily%20nominal%20wage%20rates%20in%20rural%20india%20men%20construction%20workers.JPG">trends in nominal wage rates</a>, <a href="/upload/files/State%20wise%20growth%20in%20average%20daily%20nominal%20wage%20rates%20in%20rural%20india%20men%20construction%20workers.JPG">annual growth in nominal wage rates</a>, and <a href="/upload/files/State%20wise%20growth%20in%20average%20daily%20wage%20rates%20in%20real%20terms%20for%20male%20construction%20workers%20in%20rural%20India%281%29.JPG">annual growth in real wage rates</a> for construction workers in rural areas.&nbsp;</p>
<p style="text-align:justify"><strong>Data collection methodology</strong></p>
<p style="text-align:justify">As a part of Rural Labour Enquiry, the&nbsp;<a href="https://im4change.org/upload/files/ilj_feb_2013.pdf">daily wage rates</a> in respect of eighteen agricultural and non-agricultural occupations are being collected along with rural retail price data by the Field Operations Division of the National Sample Survey Organisation since 1986-87, according to a February 2013 <a href="https://im4change.org/upload/files/ilj_feb_2013.pdf">edition of the Indian Labour Journal</a>.&nbsp;On the recommendations of the Governing Council of the National Sample Survey Organisation in its 61st meeting,&nbsp;the <a href="https://im4change.org/upload/files/ilj_feb_2013.pdf">Labour Bureau</a> started the compilation and analysis of wage rate data with effect from April, 1998.&nbsp;</p>
<p style="text-align:justify">The Field Operations Division of the National Sample Survey Organisation has been entrusted with the work of <a href="https://im4change.org/upload/files/METHOLOGY%20FOR%20COMPILATION%20OF%20THE%20WAGE%20RATE%20DATA.pdf">data collection</a>. The <a href="https://im4change.org/upload/files/METHOLOGY%20FOR%20COMPILATION%20OF%20THE%20WAGE%20RATE%20DATA.pdf">wage rate data</a> are being collected along with rural retail prices from 600 sample villages spread over 66 NSS regions of 20 States by canvassing Block-5 <em>(Annexure-I)</em> of Schedule 3.01(R). The data collection from these sample villages is staggered over the four weeks of a month with one-fourth of them being covered every week. The days of canvassing of Schedule 3.01(R) are fixed. The village functionaries like the Panchayat Secretary, Progress Assistant, Patwari and other Village or Block Officials are the primary informants for collection of data on wage rates. The data on normal working hours and the prevailing wage rates in cash and kind for the reported working hours are collected sex-wise for each of the 18 selected occupations in 20 states, indicates an old&nbsp;<a href="https://im4change.org/upload/files/METHOLOGY%20FOR%20COMPILATION%20OF%20THE%20WAGE%20RATE%20DATA.pdf">document</a> of the Labour Bureau. &nbsp;&nbsp;</p>
<p style="text-align:justify">The wage rates are sometimes reported for a duration that is less/more than the normal working hours. In such cases, they are <a href="https://im4change.org/upload/files/METHOLOGY%20FOR%20COMPILATION%20OF%20THE%20WAGE%20RATE%20DATA.pdf">first normalised for eight hours</a> working day. As regards the mode of payment of wages, it is made in both ways i.e., in cash and/or in kind. The payments made in kind are very common in rural areas, which include foodgrains, cooked food, tea, fuel, cigarette, beedi, fodder, etc.&nbsp;The wages reported in kind are evaluated at local retail prices. Thereafter, the data is thoroughly scrutinised and discrepant points are referred back to the field for clarification. In the next stage, the simple arithmetic average of these normalised daily wage rates is worked out occupation-wise and sex-wise for each state.</p>
<p style="text-align:justify"><a href="http://ras.org.in/methodology_of_data_collection_unsuited_to_changing_rural_reality">Up to June 2000</a>, the average wage rates at the national level were derived by taking the simple average of state figures; since July 2000, the averages have been obtained by dividing the sum total of wages of all 20 states by the number of centres or villages from which data were collected. The state-wise averages are restricted only to those occupations where the number of centres is five or more to avoid abnormal fluctuations and inconsistency in wages paid to different categories of workers on account of varying numbers of centres. However, in order to calculate the all-India averages, all neglected centres are taken into account to arrive at the total number of centres at the national level.</p>
<p style="text-align:justify">The <a href="/upload/files/RBI%20note%20Average%20Daily%20Wage%20rate%20Methodology.pdf">Reserve Bank of India</a>&nbsp;<em>(whose data we have used in writing this news alert)</em> has collated and is releasing monthly time series data on rural wage rates based on the data published by the Labour Bureau, Government of India. Starting from November 2013 the Labour Bureau is collecting the rural wage data in respect of 12 agricultural and 13 non-agricultural occupations across 20 major states, namely, Andhra Pradesh, Assam, Bihar, Gujarat, Haryana, Himachal Pradesh, Jammu &amp; Kashmir, Karnataka, Kerala, Madhya Pradesh, Maharashtra, Manipur, Meghalaya, Orissa, Punjab, Rajasthan, Tamil Nadu, Tripura, Uttar Pradesh and West Bengal. The occupations for which the daily wage rates are collected every month are: <u>(A) Agricultural occupations</u> &ndash; (1) &nbsp;Ploughing/ Tilling workers, (2) Sowing <em>(including planting/ Transplanting/ Weeding)</em> workers, (3) Harvesting/ Winnowing/ Threshing workers, (4) Picking workers <em>(including Tea, Cotton, Tobacco and other commercial crops)</em>, (5) Horticulture workers <em>(including nursery growers)</em>, (6) Fishermen-inland, (7) Fishermen coastal/deep-sea, (8) Loggers and wood cutters, (9) Animal husbandry workers <em>(including poultry workers, dairy workers and herdsman)</em>, (10) Packaging labourers, agriculture, (11) General agricultural labourers <em>(including watering/ irrigation workers, etc.)</em>, (12) Plant protection workers <em>(applying pesticides, treating seeds, etc.)</em>; and <u>(B) Non-agricultural occupations</u> &ndash; (13) Carpenter, (14) Blacksmith, (15) Mason, (16) Weavers, (17) Beedi makers, (18) Bamboo, cane basket weavers, (19) Handicraft workers, (20) Plumbers, (21) Electrician, (22) Construction workers <em>(for roads, dams, industrial &amp; project construction work and Well diggers)</em>, (23) LMV &amp; Tractor drivers, (24) Non-agricultural labourers <em>(including porters, loaders)</em>, and (25) Sweeping/cleaning workers.&nbsp;</p>
<p style="text-align:justify"><strong><em>References&nbsp;</em></strong></p>
<p style="text-align:justify">Handbook of Statistics on Indian States 2020-21, released in November 2021, please <a href="https://m.rbi.org.in/scripts/AnnualPublications.aspx?head=Handbook%20of%20Statistics%20on%20Indian%20States">click here</a> to access</p>
<p style="text-align:justify">State-wise Average Daily Wage Rates in Rural India (Men - General Agricultural Labourers), RBI Handbook of Statistics on Indian States 2020-21, released in November 2021, please <a href="/upload/files/State-wise%20Average%20Daily%20Wage%20Rates%20in%20Rural%20India%20Men%20-%20General%20Agricultural%20Labourers.PDF">click here</a> to access&nbsp;</p>
<p style="text-align:justify">State-wise Average Daily Wage Rates in Rural India (Men - Non-Agricultural Labourers), RBI Handbook of Statistics on Indian States 2020-21, released in November 2021, please <a href="/upload/files/State-wise%20Average%20Daily%20Wage%20Rates%20in%20Rural%20India%20Men%20-%20Non%20Agricultural%20Labourers.PDF">click here</a> to access&nbsp;</p>
<p style="text-align:justify">State-wise Average Daily Wage Rates in Rural India (Men - Construction Workers), RBI Handbook of Statistics on Indian States 2020-21, released in November 2021, please <a href="/upload/files/State-wise%20Average%20Daily%20Wage%20Rates%20in%20Rural%20India%20Men%20-%20Construction%20Workers.PDF">click here</a> to access&nbsp;</p>
<p style="text-align:justify">State-wise Average Inflation (CPI) - Inflation, RBI Handbook of Statistics on Indian States 2020-21, released in November 2021, please <a href="/upload/files/State-wise%20Average%20Inflation%20CPI%20-%20Inflation.PDF">click here</a> to access&nbsp;</p>
<p style="text-align:justify">Indian Labour Journal, February 2013, please <a href="/upload/files/ilj_feb_2013.pdf">click here</a> to access &nbsp;</p>
<p style="text-align:justify">Wage Rates in Rural India 2003-04: Methodology for Compilation of the Wage Rate Data, Labour Bureau, please <a href="/upload/files/METHOLOGY%20FOR%20COMPILATION%20OF%20THE%20WAGE%20RATE%20DATA.pdf">click here</a> to access&nbsp; &nbsp;&nbsp;</p>
<p style="text-align:justify">Average Daily Wage Rates in Rural India: Methodology and coverage (From November 2013), Reserve Bank of India, please <a href="https://dbie.rbi.org.in">click here</a>&nbsp;and <a href="/upload/files/RBI%20note%20Average%20Daily%20Wage%20rate%20Methodology%281%29.pdf">here</a> to access&nbsp;</p>
<p style="text-align:justify">Consumer Price Index Numbers on Base 2012=100 for Rural, Urban and Combined for the month of January 2022, Ministry of Statistics and Programme Implementation (MoSPI), National Statistical Office (NSO), released on 14th February 2022, please <a href="/upload/files/CPI%20Press%20Release%20January%202022%281%29.pdf">click here</a> to access&nbsp;</p>
<p style="text-align:justify">Methodology of Data Collection Unsuited to Changing Rural Reality: A Study of Agricultural Wage Data in India -Yoshifumi Usami, Arindam Das, and Madhura Swaminathan, Review of Agrarian Studies, Vol. 10, No. 2, July-December, 2020, please <a href="http://ras.org.in/methodology_of_data_collection_unsuited_to_changing_rural_reality">click here</a> to access</p>
<p>Russia-ukraine crisis to push up fertiliser prices, govt subsidies, IANS/ Business Standard, 4 March, 2022, please <a href="https://www.business-standard.com/article/economy-policy/russia-ukraine-crisis-to-push-up-fertiliser-prices-govt-subsidies-122030400560_1.html">click here</a> to access &nbsp;</p>
<p>Cooking oil prices spike in India due to Russia-ukraine crisis -B Krishna Mohan, TelanganaToday.com, 3 March, 2022, please <a href="https://telanganatoday.com/cooking-oil-prices-spike-in-india-due-to-russia-ukraine-crisis">click here</a> to access &nbsp;</p>
<p>Govt reviews cooking oil imports as ukraine crisis disrupts supplies, prices shoot up -Amiti Sen and Prabhudutta Mishra, The Hindu Business Line, 4 March, 2022, please <a href="https://www.thehindubusinessline.com/markets/commodities/govt-reviews-cooking-oil-imports-as-ukraine-crisis-disrupts-supplies-prices-shoot-up/article65190879.ece">click here</a> to access &nbsp;</p>
<p>India&#39;s Economy Faces A Potential Stagflation Risk From Ukraine War -Sunil Prabhu, NDTV.com, 1 March, 2022, please <a href="https://www.ndtv.com/business/indias-economy-faces-a-potential-stagflation-risk-from-ukraine-war-2796624">click here</a> to access</p>
<p>India to be one of Asia&rsquo;s &lsquo;biggest losers&rsquo; from the Ukraine war as Russia slammed by global sanctions -Paran Balakrishnan, The Telegraph, 1 March, 2022, please <a href="https://www.telegraphindia.com/business/russia-ukraine-crisis-india-to-be-one-of-asias-biggest-losers-from-the-ukraine-war-as-russia-slammed-by-global-sanctions/cid/1854032">click here</a> to access</p>
<p>Crude Oil Prices Rise, Tracking Russia-Ukraine Conflict -Rahul Karunakar, NDTV.com <em>(with inputs from Agencies)</em>, 1 March, 2022, please <a href="https://www.ndtv.com/business/crude-oil-prices-rise-on-tuesday-tracking-russia-ukraine-conflict-2796187">click here</a> to access</p>
<p>Cooking Oil May Become Costlier Due to Russia-ukraine War. Know Why, News18.com, 27 February, 2022, please <a href="https://www.news18.com/news/business/markets/cooking-oil-may-become-costlier-due-to-russia-ukraine-war-know-why-4812740.html">click here</a> to access &nbsp;</p>
<p style="text-align:justify"><strong>Image Courtesy: Inclusive Media for Change/ Shambhu Ghatak</strong></p>
',
'credit_writer' => '',
'article_img' => 'Image construction worker 11 Mar 2022.jpg',
'article_img_thumb' => 'Image construction worker 11 Mar 2022.jpg',
'status' => (int) 1,
'show_on_home' => (int) 1,
'lang' => 'EN',
'category_id' => (int) 4,
'tag_keyword' => '',
'seo_url' => 'real-wage-rates-of-the-rural-workers-hardly-increased-during-the-past-6-years',
'meta_title' => '',
'meta_keywords' => '',
'meta_description' => '',
'noindex' => (int) 1,
'publish_date' => object(Cake\I18n\FrozenDate) {},
'most_visit_section_id' => null,
'article_big_img' => null,
'liveid' => null,
'created' => object(Cake\I18n\FrozenTime) {},
'modified' => object(Cake\I18n\FrozenTime) {},
'edate' => '',
'tags' => [
[maximum depth reached]
],
'category' => object(App\Model\Entity\Category) {},
'[new]' => false,
'[accessible]' => [
[maximum depth reached]
],
'[dirty]' => [[maximum depth reached]],
'[original]' => [[maximum depth reached]],
'[virtual]' => [[maximum depth reached]],
'[hasErrors]' => false,
'[errors]' => [[maximum depth reached]],
'[invalid]' => [[maximum depth reached]],
'[repository]' => 'Articles'
},
'articleid' => (int) 62349,
'metaTitle' => 'NEWS ALERTS | Real wage rates of the rural workers hardly increased during the last 6 years',
'metaKeywords' => 'Construction Workers,Consumer Price Index,CPI Rural,CPI Urban,Farm Labourers,Farm Workers,Food Inflation,Food Prices,Fuel Inflation,Fuel Prices,Nominal Wage Rate,Non-Farm Labourers,Non-Farm Workers,Real Wage Growth,Real Wages,Retail Inflation,Rural Workers',
'metaDesc' => 'In the absence of income or expenditure-based headcount ratio, the growth in the real wages (i.e., nominal wages adjusted against retail inflation) of the manual workers is considered to be a good proxy to assess the trends in poverty. This...',
'disp' => '<p style="text-align:justify">In the absence of income or expenditure-based headcount ratio, the growth in the real wages <em>(i.e., nominal wages adjusted against retail inflation)</em> of the manual workers is considered to be a good proxy to assess the trends in poverty. This is because the manual, unskilled/ semi-skilled labourers exist at the bottom of the pyramid or economic hierarchy, and most of them belong to the social categories Scheduled Castes (SCs) and Scheduled Tribes (STs). A positive growth in their real wages <em>(or real wage rates) </em>is anticipated to improve their purchasing power <em>(i.e., income or consumption expenditure)</em> and lift them out of the poverty trap. &nbsp;</p><p style="text-align:justify">Clearly, there exists inter-state differences in nominal wage rates, growth in nominal wage rates and growth in real wage rates, which we will see in this news alert.&nbsp;</p><p style="text-align:justify">Against the backdrop of the <a href="https://www.thehindubusinessline.com/markets/commodities/govt-reviews-cooking-oil-imports-as-ukraine-crisis-disrupts-supplies-prices-shoot-up/article65190879.ece" title="https://www.thehindubusinessline.com/markets/commodities/govt-reviews-cooking-oil-imports-as-ukraine-crisis-disrupts-supplies-prices-shoot-up/article65190879.ece">Russia-Ukraine conflict</a>, which is anticipated to cause both <a href="https://www.ndtv.com/business/indias-economy-faces-a-potential-stagflation-risk-from-ukraine-war-2796624" title="https://www.ndtv.com/business/indias-economy-faces-a-potential-stagflation-risk-from-ukraine-war-2796624">food and fuel retail inflation</a> in India in the coming times, it is even more important to look at the past trends in wage rate growth of the rural workers. It should be noted that the <a href="https://public.flourish.studio/visualisation/8706137" title="https://public.flourish.studio/visualisation/8706137">year-on-year inflation</a> in <a href="https://public.flourish.studio/visualisation/8706137" title="https://public.flourish.studio/visualisation/8706137">Consumer</a> <a href="https://public.flourish.studio/visualisation/8706137" title="https://public.flourish.studio/visualisation/8706137">Price Index Rural</a> exceeded the <a href="https://public.flourish.studio/visualisation/8706137" title="https://public.flourish.studio/visualisation/8706137">year-on-year inflation</a> in <a href="https://public.flourish.studio/visualisation/8706137" title="https://public.flourish.studio/visualisation/8706137">CPI Urban</a> during January 2022 at the national level. Even before the beginning of Russia-Ukraine conflict <em>(i.e., during January 2022)</em>, in rural areas, <a href="https://im4change.org/upload/files/CPI%20Press%20Release%20January%202022%281%29.pdf" title="https://im4change.org/upload/files/CPI%20Press%20Release%20January%202022%281%29.pdf">retail inflation rate of 20.6 percent</a> was noticed for &#39;oils and fats&#39;, aside from&nbsp;<a href="https://im4change.org/upload/files/CPI%20Press%20Release%20January%202022%281%29.pdf" title="https://im4change.org/upload/files/CPI%20Press%20Release%20January%202022%281%29.pdf">8.44 percent retail inflation for &#39;fuel and light&#39;</a>, <a href="https://im4change.org/upload/files/CPI%20Press%20Release%20January%202022%281%29.pdf" title="https://im4change.org/upload/files/CPI%20Press%20Release%20January%202022%281%29.pdf">8.27 percent</a> for &#39;transport and communication&#39;, and <a href="https://im4change.org/upload/files/CPI%20Press%20Release%20January%202022%281%29.pdf" title="https://im4change.org/upload/files/CPI%20Press%20Release%20January%202022%281%29.pdf">9.65 percent for &#39;clothing and footwear&#39;</a>.&nbsp; &nbsp;&nbsp;</p><p style="text-align:justify">At the national level, the average daily nominal wage rate&nbsp;for male construction workers in rural areas during the period from 2014-15 to 2020-21 was Rs. 316.9, which was greater than that of the male non-farm workers in rural areas. The average daily nominal wage rate&nbsp;for male non-agricultural labourers in rural areas during the period from 2014-15 to 2020-21 was Rs. 273.8, which exceeded the average daily nominal wage rates for male farm labourers in rural areas <em>(i.e., Rs. 265.1)</em>. However, in Andhra Pradesh, Haryana, Himachal Pradesh, Jammu and Kashmir,&nbsp;Karnataka, Kerala, Meghalaya, Punjab, and Tripura, the average daily nominal wage rates for male agricultural labourers in rural areas during the period from 2014-15 to 2020-21 exceeded the average daily nominal wage rates for male non-farm labourers in rural areas. Please see chart-1.</p><p style="text-align:justify"><img alt="" src="/upload/images/Chart%201.png" style="height:670px; width:1000px" /></p><p style="text-align:justify"><em><strong>Notes:</strong> The average (i.e., arithmetic mean) daily nominal wage rates for various categories of workers in rural India in the period from 2014-15 to 2020-21 has been calculated by the Inclusive Media for Change staff</em></p><p style="text-align:justify"><em>Please <a href="https://docs.google.com/spreadsheets/d/1avu0-WtaKV2RHXtz2eiP7iS8znGVBdKC/edit?usp=sharing&amp;ouid=112233925171588304692&amp;rtpof=true&amp;sd=true" title="https://docs.google.com/spreadsheets/d/1avu0-WtaKV2RHXtz2eiP7iS8znGVBdKC/edit?usp=sharing&amp;ouid=112233925171588304692&amp;rtpof=true&amp;sd=true">click here</a> to access the data in spreadsheet format</em></p><p style="text-align:justify"><em><strong>Source:&nbsp;</strong>Handbook of Statistics on Indian States 2020-21, released in November 2021, please <a href="https://m.rbi.org.in/scripts/AnnualPublications.aspx?head=Handbook%20of%20Statistics%20on%20Indian%20States" title="https://m.rbi.org.in/scripts/AnnualPublications.aspx?head=Handbook%20of%20Statistics%20on%20Indian%20States">click here</a> to access</em></p><p style="text-align:justify"><em>State-wise Average Daily Wage Rates in Rural India (Men - General Agricultural Labourers), RBI Handbook of Statistics on Indian States 2020-21, released in November 2021, please <a href="/upload/files/State-wise%20Average%20Daily%20Wage%20Rates%20in%20Rural%20India%20Men%20-%20General%20Agricultural%20Labourers.PDF" title="/upload/files/State-wise%20Average%20Daily%20Wage%20Rates%20in%20Rural%20India%20Men%20-%20General%20Agricultural%20Labourers.PDF">click here</a> to access&nbsp;</em></p><p style="text-align:justify"><em>State-wise Average Daily Wage Rates in Rural India (Men - Non-Agricultural Labourers), RBI Handbook of Statistics on Indian States 2020-21, released in November 2021, please <a href="/upload/files/State-wise%20Average%20Daily%20Wage%20Rates%20in%20Rural%20India%20Men%20-%20Non%20Agricultural%20Labourers.PDF" title="/upload/files/State-wise%20Average%20Daily%20Wage%20Rates%20in%20Rural%20India%20Men%20-%20Non%20Agricultural%20Labourers.PDF">click here</a> to access&nbsp;</em></p><p style="text-align:justify"><em>State-wise Average Daily Wage Rates in Rural India (Men - Construction Workers), RBI Handbook of Statistics on Indian States 2020-21, released in November 2021, please <a href="/upload/files/State-wise%20Average%20Daily%20Wage%20Rates%20in%20Rural%20India%20Men%20-%20Construction%20Workers.PDF" title="/upload/files/State-wise%20Average%20Daily%20Wage%20Rates%20in%20Rural%20India%20Men%20-%20Construction%20Workers.PDF">click here</a> to access&nbsp;</em></p><p style="text-align:justify"><em>State-wise Average Inflation (CPI) - Inflation, RBI Handbook of Statistics on Indian States 2020-21, released in November 2021, please <a href="/upload/files/State-wise%20Average%20Inflation%20CPI%20-%20Inflation.PDF" title="/upload/files/State-wise%20Average%20Inflation%20CPI%20-%20Inflation.PDF">click here</a> to access&nbsp;</em></p><p style="text-align:justify"><strong>---</strong></p><p style="text-align:justify">At the national level, the agricultural nominal wage rate&nbsp;grew faster than the non-farm wage&nbsp;rate&nbsp;on average for male labourers in rural areas during the period from 2015-16 to 2020-21. However, in states like Assam, Bihar, Haryana, Madhya Pradesh, Odisha, Punjab, and West Bengal, the non-farm nominal wage rates grew faster than the farm wage rates on average for male workers in rural areas during the period from 2015-16 to 2020-21. Please see chart-2.&nbsp;</p><p style="text-align:justify"><img alt="" src="/upload/images/Chart%202.png" style="height:653px; width:1000px" /></p><p style="text-align:justify"><em><strong>Notes: </strong>The average growth in daily nominal wage rates for various categories of workers in rural India in the period from 2015-16 to 2020-21 has been calculated by the Inclusive Media for Change staff</em></p><p style="text-align:justify"><em>Please <a href="https://docs.google.com/spreadsheets/d/1avu0-WtaKV2RHXtz2eiP7iS8znGVBdKC/edit?usp=sharing&amp;ouid=112233925171588304692&amp;rtpof=true&amp;sd=true" title="https://docs.google.com/spreadsheets/d/1avu0-WtaKV2RHXtz2eiP7iS8znGVBdKC/edit?usp=sharing&amp;ouid=112233925171588304692&amp;rtpof=true&amp;sd=true">click here</a> to access the data in spreadsheet format</em></p><p style="text-align:justify"><em><strong>Source: </strong>Same as above</em><br /><strong>---</strong></p><p style="text-align:justify">At the national level, the construction sector nominal wage rate&nbsp;grew slower than the non-agricultural wage&nbsp;rate&nbsp;on average for male labourers in rural areas during the period from 2015-16 to 2020-21. However, in states like Andhra Pradesh, Bihar, Himachal Pradesh, Maharashtra, Meghalaya, Punjab,&nbsp;Tamil Nadu, and Uttar Pradesh, the construction sector nominal wage rates grew faster than the non-farm wage rates on average for male workers in rural areas during the period from 2015-16 to 2020-21. Please take a look at chart-2. &nbsp;</p><p style="text-align:justify">At the national level, the agricultural wage rate&nbsp;in real terms grew faster than the non-farm wage rate&nbsp;on average for male labourers in rural areas during the period from 2015-16 to 2020-21. However, in states like Assam, Bihar, Haryana, Madhya Pradesh, Odisha, Punjab, and West Bengal, the non-farm wage rates in real terms grew faster than the farm wage rates on average for male workers in rural areas during the period from 2015-16 to 2020-21. Please see table-1.</p><p style="text-align:justify"><strong>Table 1: State-wise Growth in Average Daily Wage Rates in Real terms for Male Agricultural Labourers, Male Non-Agricultural Labourers, and Male Construction Workers in Rural India, in %</strong><br /><img alt="" src="/upload/images/Table%201%20State-wise%20Growth%20in%20Average%20Daily%20Wage%20Rates%20in%20Real%20terms%20for%20Male%20Agricultural%20Labourers%20Male%20Non-Agricultural%20Labourers%20and%20Male%20Construction%20Workers%20in%20Rural%20India%20in%20percent.png" style="height:539px; width:750px" /></p><p style="text-align:justify"><em><strong>Notes: </strong>The average growth in daily wage rates in real terms for various categories of workers in rural India in the period from 2015-16 to 2020-21 has been calculated by the Inclusive Media for Change staff</em></p><p style="text-align:justify"><em>Please <a href="https://docs.google.com/spreadsheets/d/1avu0-WtaKV2RHXtz2eiP7iS8znGVBdKC/edit?usp=sharing&amp;ouid=112233925171588304692&amp;rtpof=true&amp;sd=true" title="https://docs.google.com/spreadsheets/d/1avu0-WtaKV2RHXtz2eiP7iS8znGVBdKC/edit?usp=sharing&amp;ouid=112233925171588304692&amp;rtpof=true&amp;sd=true">click here</a> to access the data in spreadsheet format</em></p><p style="text-align:justify"><em><strong>Source: </strong>Same as above</em><br /><strong>---</strong></p><p style="text-align:justify">At the national level, the construction sector wage rate&nbsp;in real terms grew slower than the non-agricultural wage rate&nbsp;on average for male labourers in rural areas during the period from 2015-16 to 2020-21. However, in states like Andhra Pradesh, Bihar, Himachal Pradesh, Maharashtra, Meghalaya, Punjab, Tamil Nadu, and Uttar Pradesh, the construction sector wage rates in real terms grew faster than the non-farm wage rates on average for male workers in rural areas during the period from 2015-16 to 2020-21. Please take a look at table-1. &nbsp;</p><p style="text-align:justify">In the following paragraphs, we have discussed the trends in agricultural wage rates, non-farm wage rates, and construction sector wage rates <em>(in rural areas)</em> in detail.&nbsp;</p><p style="text-align:justify"><strong>Agricultural wages in rural areas</strong></p><p style="text-align:justify">The highest <a href="https://im4change.org/upload/files/State%20wise%20average%20daily%20nominal%20wage%20rates%20in%20rural%20india%20men%20farm%20labourers.JPG" title="https://im4change.org/upload/files/State%20wise%20average%20daily%20nominal%20wage%20rates%20in%20rural%20india%20men%20farm%20labourers.JPG">average daily nominal wage rate</a> <a href="https://im4change.org/upload/files/State%20wise%20average%20daily%20nominal%20wage%20rates%20in%20rural%20india%20men%20farm%20labourers.JPG" title="https://im4change.org/upload/files/State%20wise%20average%20daily%20nominal%20wage%20rates%20in%20rural%20india%20men%20farm%20labourers.JPG">for male agricultural labourers</a> in rural India during the period from 2014-15 to 2020-21 was found in Kerala <em>(Rs. 653.93)</em>, followed by Jammu and Kashmir <em>(Rs. 429.19)</em>, Tamil Nadu <em>(Rs. 385.6)</em>, Haryana <em>(Rs. 368.53)</em>, Himachal Pradesh <em>(Rs. 366.23)</em>, and Punjab <em>(Rs. 325.31)</em>. Please have a look at chart-1.</p><p style="text-align:justify">The lowest <a href="https://im4change.org/upload/files/State%20wise%20average%20daily%20nominal%20wage%20rates%20in%20rural%20india%20men%20farm%20labourers.JPG" title="https://im4change.org/upload/files/State%20wise%20average%20daily%20nominal%20wage%20rates%20in%20rural%20india%20men%20farm%20labourers.JPG">average daily nominal wage rate</a> <a href="https://im4change.org/upload/files/State%20wise%20average%20daily%20nominal%20wage%20rates%20in%20rural%20india%20men%20farm%20labourers.JPG" title="https://im4change.org/upload/files/State%20wise%20average%20daily%20nominal%20wage%20rates%20in%20rural%20india%20men%20farm%20labourers.JPG">for male agricultural labourers</a> in rural India during the period from 2014-15 to 2020-21 was observed in Madhya Pradesh <em>(Rs. 183.97)</em>, followed by Gujarat <em>(Rs. 190.07)</em>, Maharashtra <em>(Rs. 215.71)</em>, Odisha <em>(Rs. 216.87)</em>, Meghalaya <em>(Rs. 219.93)</em>, Bihar <em>(Rs. 230.43)</em>, Uttar Pradesh <em>(Rs. 230.5)</em>, and Assam <em>(Rs. 237.3)</em>. The related national level figure was Rs. 265.09 during the period from 2014-15 to 2020-21. Please consult chart-1.&nbsp;</p><p style="text-align:justify">The highest <a href="https://im4change.org/upload/files/State%20wise%20growth%20in%20average%20daily%20nominal%20wage%20rates%20in%20rural%20india%20men%20farm%20labourers.JPG" title="https://im4change.org/upload/files/State%20wise%20growth%20in%20average%20daily%20nominal%20wage%20rates%20in%20rural%20india%20men%20farm%20labourers.JPG">average annual growth rate in</a> <a href="https://im4change.org/upload/files/State%20wise%20growth%20in%20average%20daily%20nominal%20wage%20rates%20in%20rural%20india%20men%20farm%20labourers.JPG" title="https://im4change.org/upload/files/State%20wise%20growth%20in%20average%20daily%20nominal%20wage%20rates%20in%20rural%20india%20men%20farm%20labourers.JPG">nominal wage rates</a> during the period from 2015-16 to 2020-21 was found in Karnataka <em>(7.3 percent)</em>, followed by Andhra Pradesh <em>(6.8 percent)</em>, Madhya Pradesh <em>(6.4 percent)</em>, Uttar Pradesh <em>(6.2 percent)</em>, Odisha <em>(6.1 percent)</em>, and Meghalaya <em>(6.0 percent)</em>. Please see chart-2.</p><p style="text-align:justify">The lowest <a href="https://im4change.org/upload/files/State%20wise%20growth%20in%20average%20daily%20nominal%20wage%20rates%20in%20rural%20india%20men%20farm%20labourers.JPG" title="https://im4change.org/upload/files/State%20wise%20growth%20in%20average%20daily%20nominal%20wage%20rates%20in%20rural%20india%20men%20farm%20labourers.JPG">average annual growth rate</a> <a href="https://im4change.org/upload/files/State%20wise%20growth%20in%20average%20daily%20nominal%20wage%20rates%20in%20rural%20india%20men%20farm%20labourers.JPG" title="https://im4change.org/upload/files/State%20wise%20growth%20in%20average%20daily%20nominal%20wage%20rates%20in%20rural%20india%20men%20farm%20labourers.JPG">in nominal wage rates</a> during the same period was noticed in Haryana <em>(2.1 percent)</em>, followed by Rajasthan <em>(3.3 percent)</em>, Kerala <em>(3.5 percent)</em>, Punjab <em>(3.9 percent)</em>, and Tamil Nadu <em>(4.5 percent)</em>. Please consult chart-2.</p><p style="text-align:justify">The average annual <a href="https://im4change.org/upload/files/State%20wise%20growth%20in%20average%20daily%20wage%20rates%20in%20real%20terms%20for%20male%20farm%20labourers%20in%20rural%20India.JPG" title="https://im4change.org/upload/files/State%20wise%20growth%20in%20average%20daily%20wage%20rates%20in%20real%20terms%20for%20male%20farm%20labourers%20in%20rural%20India.JPG">growth of agricultural labourers&rsquo;</a> <a href="https://im4change.org/upload/files/State%20wise%20growth%20in%20average%20daily%20wage%20rates%20in%20real%20terms%20for%20male%20farm%20labourers%20in%20rural%20India.JPG" title="https://im4change.org/upload/files/State%20wise%20growth%20in%20average%20daily%20wage%20rates%20in%20real%20terms%20for%20male%20farm%20labourers%20in%20rural%20India.JPG">wage rates in real terms</a> during the period from 2015-16 to 2020-21 were negative in Haryana <em>(-2.1 percent)</em>, Jammu and Kashmir <em>(-0.3 percent)</em>, Kerala <em>(-1.7 percent)</em>, Punjab <em>(-0.4 percent)</em>, Rajasthan <em>(-1.1 percent)</em>, Tamil Nadu <em>(-0.8 percent)</em>, Tripura <em>(-0.5 percent)</em>, and West Bengal <em>(-0.1 percent)</em>. It should be noted that the <a href="https://im4change.org/upload/files/State-wise%20Average%20Inflation%20CPI%20-%20Inflation.PDF" title="https://im4change.org/upload/files/State-wise%20Average%20Inflation%20CPI%20-%20Inflation.PDF">rate of inflation</a> in <a href="https://im4change.org/upload/files/State-wise%20Average%20Inflation%20CPI%20-%20Inflation.PDF" title="https://im4change.org/upload/files/State-wise%20Average%20Inflation%20CPI%20-%20Inflation.PDF">Consumer Price Index-General</a> has been used to get the average annual growth of agricultural labourers&rsquo; wage rates in real terms. Kindly consult table-1. &nbsp;</p><p style="text-align:justify">Some states witnessed negative <a href="https://im4change.org/upload/files/State%20wise%20growth%20in%20average%20daily%20wage%20rates%20in%20real%20terms%20for%20male%20farm%20labourers%20in%20rural%20India.JPG" title="https://im4change.org/upload/files/State%20wise%20growth%20in%20average%20daily%20wage%20rates%20in%20real%20terms%20for%20male%20farm%20labourers%20in%20rural%20India.JPG">growth in agricultural labourers&rsquo;</a> <a href="https://im4change.org/upload/files/State%20wise%20growth%20in%20average%20daily%20wage%20rates%20in%20real%20terms%20for%20male%20farm%20labourers%20in%20rural%20India.JPG" title="https://im4change.org/upload/files/State%20wise%20growth%20in%20average%20daily%20wage%20rates%20in%20real%20terms%20for%20male%20farm%20labourers%20in%20rural%20India.JPG">wage rates in real terms</a> for more than two years between 2015-16 and 2020-21. For example, <a href="https://im4change.org/upload/files/State%20wise%20growth%20in%20average%20daily%20wage%20rates%20in%20real%20terms%20for%20male%20farm%20labourers%20in%20rural%20India.JPG" title="https://im4change.org/upload/files/State%20wise%20growth%20in%20average%20daily%20wage%20rates%20in%20real%20terms%20for%20male%20farm%20labourers%20in%20rural%20India.JPG">Haryana</a> experienced negative growth in 2015-16, 2016-17, 2017-18, 2019-20, and 2020-21. Likewise, <a href="https://im4change.org/upload/files/State%20wise%20growth%20in%20average%20daily%20wage%20rates%20in%20real%20terms%20for%20male%20farm%20labourers%20in%20rural%20India.JPG" title="https://im4change.org/upload/files/State%20wise%20growth%20in%20average%20daily%20wage%20rates%20in%20real%20terms%20for%20male%20farm%20labourers%20in%20rural%20India.JPG">Kerala</a> faced negative growth in 2017-18, 2018-19, 2019-20, and 2020-21. &nbsp;</p><p style="text-align:justify">At the national level, the <a href="https://im4change.org/upload/files/State%20wise%20growth%20in%20average%20daily%20wage%20rates%20in%20real%20terms%20for%20male%20farm%20labourers%20in%20rural%20India.JPG" title="https://im4change.org/upload/files/State%20wise%20growth%20in%20average%20daily%20wage%20rates%20in%20real%20terms%20for%20male%20farm%20labourers%20in%20rural%20India.JPG">agricultural labourers&rsquo;</a> <a href="https://im4change.org/upload/files/State%20wise%20growth%20in%20average%20daily%20wage%20rates%20in%20real%20terms%20for%20male%20farm%20labourers%20in%20rural%20India.JPG" title="https://im4change.org/upload/files/State%20wise%20growth%20in%20average%20daily%20wage%20rates%20in%20real%20terms%20for%20male%20farm%20labourers%20in%20rural%20India.JPG">wage rates in real terms</a> on average grew by 1.0 percent annually during the period from 2015-16 to 2020-21.</p><p style="text-align:justify">Please <a href="https://docs.google.com/spreadsheets/d/1avu0-WtaKV2RHXtz2eiP7iS8znGVBdKC/edit?usp=sharing&amp;ouid=112233925171588304692&amp;rtpof=true&amp;sd=true" title="https://docs.google.com/spreadsheets/d/1avu0-WtaKV2RHXtz2eiP7iS8znGVBdKC/edit?usp=sharing&amp;ouid=112233925171588304692&amp;rtpof=true&amp;sd=true">click here</a> to access the spreadsheet in order to look at the trends in <a href="/upload/files/State%20wise%20average%20daily%20nominal%20wage%20rates%20in%20rural%20india%20men%20farm%20labourers.JPG" title="/upload/files/State%20wise%20average%20daily%20nominal%20wage%20rates%20in%20rural%20india%20men%20farm%20labourers.JPG">nominal wage rates</a>, <a href="/upload/files/State%20wise%20growth%20in%20average%20daily%20nominal%20wage%20rates%20in%20rural%20india%20men%20farm%20labourers.JPG" title="/upload/files/State%20wise%20growth%20in%20average%20daily%20nominal%20wage%20rates%20in%20rural%20india%20men%20farm%20labourers.JPG">annual growth in nominal wage rates</a> and <a href="/upload/files/State%20wise%20growth%20in%20average%20daily%20wage%20rates%20in%20real%20terms%20for%20male%20farm%20labourers%20in%20rural%20India.JPG" title="/upload/files/State%20wise%20growth%20in%20average%20daily%20wage%20rates%20in%20real%20terms%20for%20male%20farm%20labourers%20in%20rural%20India.JPG">annual growth in real wage rates</a> for farm labourers in rural areas.&nbsp;</p><p style="text-align:justify"><strong>Non-agricultural wages in rural areas</strong></p><p style="text-align:justify">The rural economy is not just about farming any longer. That is why we have looked at the wage growth in the non-farm sector too.&nbsp;The highest <a href="https://im4change.org/upload/files/State%20wise%20average%20daily%20nominal%20wage%20rates%20in%20rural%20india%20men%20non%20farm%20labourers.JPG" title="https://im4change.org/upload/files/State%20wise%20average%20daily%20nominal%20wage%20rates%20in%20rural%20india%20men%20non%20farm%20labourers.JPG">average daily nominal wage rate for male</a> <a href="https://im4change.org/upload/files/State%20wise%20average%20daily%20nominal%20wage%20rates%20in%20rural%20india%20men%20non%20farm%20labourers.JPG" title="https://im4change.org/upload/files/State%20wise%20average%20daily%20nominal%20wage%20rates%20in%20rural%20india%20men%20non%20farm%20labourers.JPG">non-agricultural labourers</a> in rural India during the period from 2014-15 to 2020-21 was detected in Kerala <em>(Rs. 639.01)</em>, followed by Jammu and Kashmir <em>(Rs. 426.37)</em>, Tamil Nadu <em>(Rs. 405.77)</em>, Haryana <em>(Rs. 359.24)</em>, Himachal Pradesh <em>(Rs. 311.10)</em>, and Punjab <em>(Rs. 309.09)</em>. Please see chart-1.</p><p style="text-align:justify">The lowest average <a href="https://im4change.org/upload/files/State%20wise%20average%20daily%20nominal%20wage%20rates%20in%20rural%20india%20men%20non%20farm%20labourers.JPG" title="https://im4change.org/upload/files/State%20wise%20average%20daily%20nominal%20wage%20rates%20in%20rural%20india%20men%20non%20farm%20labourers.JPG">daily nominal wage rate for male</a> <a href="https://im4change.org/upload/files/State%20wise%20average%20daily%20nominal%20wage%20rates%20in%20rural%20india%20men%20non%20farm%20labourers.JPG" title="https://im4change.org/upload/files/State%20wise%20average%20daily%20nominal%20wage%20rates%20in%20rural%20india%20men%20non%20farm%20labourers.JPG">non-agricultural labourers in rural India</a> during the period from 2014-15 to 2020-21 was found in Madhya Pradesh <em>(Rs. 191.47)</em>, followed by Meghalaya <em>(Rs. 210.26)</em>, Gujarat <em>(Rs. 213.51)</em>, Odisha <em>(Rs. 218.06)</em>, Maharashtra <em>(Rs. 226.70)</em>, Tripura <em>(Rs. 230.36)</em>, Bihar <em>(Rs. 243.51)</em>, and Uttar Pradesh <em>(Rs. 243.97)</em>. The related national level figure was Rs. 273.79 during the period from 2014-15 to 2020-21. Please see chart-1.</p><p style="text-align:justify">The highest <a href="https://im4change.org/upload/files/State%20wise%20growth%20in%20average%20daily%20nominal%20wage%20rates%20in%20rural%20india%20men%20non%20farm%20labourers.JPG" title="https://im4change.org/upload/files/State%20wise%20growth%20in%20average%20daily%20nominal%20wage%20rates%20in%20rural%20india%20men%20non%20farm%20labourers.JPG">average annual growth rate in</a> <a href="https://im4change.org/upload/files/State%20wise%20growth%20in%20average%20daily%20nominal%20wage%20rates%20in%20rural%20india%20men%20non%20farm%20labourers.JPG" title="https://im4change.org/upload/files/State%20wise%20growth%20in%20average%20daily%20nominal%20wage%20rates%20in%20rural%20india%20men%20non%20farm%20labourers.JPG">nominal wage rates</a> during the period from 2015-16 to 2020-21 was noticed in Odisha <em>(8.0 percent)</em>, followed by Madhya Pradesh <em>(7.6 percent)</em>, Assam <em>(6.6 percent)</em>, West Bengal <em>(5.9 percent)</em>, Uttar Pradesh and Andhra Pradesh <em>(5.6 percent each)</em>, and Bihar <em>(5.5 percent)</em>. Kindly consult chart-2.</p><p style="text-align:justify">The lowest <a href="https://im4change.org/upload/files/State%20wise%20growth%20in%20average%20daily%20nominal%20wage%20rates%20in%20rural%20india%20men%20non%20farm%20labourers.JPG" title="https://im4change.org/upload/files/State%20wise%20growth%20in%20average%20daily%20nominal%20wage%20rates%20in%20rural%20india%20men%20non%20farm%20labourers.JPG">average annual growth rate</a> <a href="https://im4change.org/upload/files/State%20wise%20growth%20in%20average%20daily%20nominal%20wage%20rates%20in%20rural%20india%20men%20non%20farm%20labourers.JPG" title="https://im4change.org/upload/files/State%20wise%20growth%20in%20average%20daily%20nominal%20wage%20rates%20in%20rural%20india%20men%20non%20farm%20labourers.JPG">in nominal wage rates</a> during the same period was observed in Kerala <em>(1.8 percent)</em>, followed by Haryana <em>(2.4 percent)</em>, Meghalaya <em>(2.8 percent)</em>, Tamil Nadu and Rajasthan <em>(3.2 percent each)</em>, Tripura and Jammu and Kashmir <em>(4.0 percent each),</em> and Maharashtra and Punjab <em>(4.2 percent each)</em>. Kindly consult chart-2.&nbsp;</p><p style="text-align:justify">The average annual <a href="https://im4change.org/upload/files/State%20wise%20growth%20in%20average%20daily%20wage%20rates%20in%20real%20terms%20for%20male%20non%20farm%20labourers%20in%20rural%20India.JPG" title="https://im4change.org/upload/files/State%20wise%20growth%20in%20average%20daily%20wage%20rates%20in%20real%20terms%20for%20male%20non%20farm%20labourers%20in%20rural%20India.JPG">growth of non-agricultural labourers&rsquo;</a> <a href="https://im4change.org/upload/files/State%20wise%20growth%20in%20average%20daily%20wage%20rates%20in%20real%20terms%20for%20male%20non%20farm%20labourers%20in%20rural%20India.JPG" title="https://im4change.org/upload/files/State%20wise%20growth%20in%20average%20daily%20wage%20rates%20in%20real%20terms%20for%20male%20non%20farm%20labourers%20in%20rural%20India.JPG">wage rates in real terms</a> during the period from 2015-16 to 2020-21 were negative in Haryana <em>(-1.9 percent)</em>, Jammu and Kashmir <em>(-1.7 percent)</em>, Kerala <em>(-3.5 percent)</em>, Maharashtra <em>(-0.3 percent)</em>, Meghalaya <em>(-1.2 percent)</em>, Punjab <em>(-0.1 percent)</em>, Rajasthan <em>(-1.2 percent)</em>, Tamil Nadu <em>(-2.1 percent)</em>, and Tripura <em>(-1.1 percent)</em>. It should be noted that the <a href="https://im4change.org/upload/files/State-wise%20Average%20Inflation%20CPI%20-%20Inflation.PDF" title="https://im4change.org/upload/files/State-wise%20Average%20Inflation%20CPI%20-%20Inflation.PDF">rate of inflation</a> in <a href="https://im4change.org/upload/files/State-wise%20Average%20Inflation%20CPI%20-%20Inflation.PDF" title="https://im4change.org/upload/files/State-wise%20Average%20Inflation%20CPI%20-%20Inflation.PDF">CPI-General</a> has been used to get the average annual growth of non-agricultural labourers&rsquo; wage rates in real terms. Kindly have a look at table-1. &nbsp;&nbsp;</p><p style="text-align:justify">Some states experienced negative growth in <a href="https://im4change.org/upload/files/State%20wise%20growth%20in%20average%20daily%20wage%20rates%20in%20real%20terms%20for%20male%20non%20farm%20labourers%20in%20rural%20India.JPG" title="https://im4change.org/upload/files/State%20wise%20growth%20in%20average%20daily%20wage%20rates%20in%20real%20terms%20for%20male%20non%20farm%20labourers%20in%20rural%20India.JPG">non-agricultural labourers&rsquo; wage</a> <a href="https://im4change.org/upload/files/State%20wise%20growth%20in%20average%20daily%20wage%20rates%20in%20real%20terms%20for%20male%20non%20farm%20labourers%20in%20rural%20India.JPG" title="https://im4change.org/upload/files/State%20wise%20growth%20in%20average%20daily%20wage%20rates%20in%20real%20terms%20for%20male%20non%20farm%20labourers%20in%20rural%20India.JPG">rates in real terms</a> for more than two years between 2015-16 and 2020-21. For example, <a href="https://im4change.org/upload/files/State%20wise%20growth%20in%20average%20daily%20wage%20rates%20in%20real%20terms%20for%20male%20non%20farm%20labourers%20in%20rural%20India.JPG" title="https://im4change.org/upload/files/State%20wise%20growth%20in%20average%20daily%20wage%20rates%20in%20real%20terms%20for%20male%20non%20farm%20labourers%20in%20rural%20India.JPG">Haryana</a> experienced negative <a href="https://im4change.org/upload/files/State%20wise%20growth%20in%20average%20daily%20wage%20rates%20in%20real%20terms%20for%20male%20non%20farm%20labourers%20in%20rural%20India.JPG" title="https://im4change.org/upload/files/State%20wise%20growth%20in%20average%20daily%20wage%20rates%20in%20real%20terms%20for%20male%20non%20farm%20labourers%20in%20rural%20India.JPG">growth in wage rates</a> <a href="https://im4change.org/upload/files/State%20wise%20growth%20in%20average%20daily%20wage%20rates%20in%20real%20terms%20for%20male%20non%20farm%20labourers%20in%20rural%20India.JPG" title="https://im4change.org/upload/files/State%20wise%20growth%20in%20average%20daily%20wage%20rates%20in%20real%20terms%20for%20male%20non%20farm%20labourers%20in%20rural%20India.JPG">(in real terms)</a> during 2016-17, 2017-18, 2018-19, 2019-20, and 2020-21. Likewise, <a href="https://im4change.org/upload/files/State%20wise%20growth%20in%20average%20daily%20wage%20rates%20in%20real%20terms%20for%20male%20non%20farm%20labourers%20in%20rural%20India.JPG" title="https://im4change.org/upload/files/State%20wise%20growth%20in%20average%20daily%20wage%20rates%20in%20real%20terms%20for%20male%20non%20farm%20labourers%20in%20rural%20India.JPG">Kerala</a> faced negative growth rates in 2015-16, 2016-17, 2017-18, 2019-20, and 2020-21. &nbsp;</p><p style="text-align:justify">At the national level, the&nbsp;<a href="https://im4change.org/upload/files/State%20wise%20growth%20in%20average%20daily%20wage%20rates%20in%20real%20terms%20for%20male%20non%20farm%20labourers%20in%20rural%20India.JPG" title="https://im4change.org/upload/files/State%20wise%20growth%20in%20average%20daily%20wage%20rates%20in%20real%20terms%20for%20male%20non%20farm%20labourers%20in%20rural%20India.JPG">non-agricultural labourers&rsquo;</a> <a href="https://im4change.org/upload/files/State%20wise%20growth%20in%20average%20daily%20wage%20rates%20in%20real%20terms%20for%20male%20non%20farm%20labourers%20in%20rural%20India.JPG" title="https://im4change.org/upload/files/State%20wise%20growth%20in%20average%20daily%20wage%20rates%20in%20real%20terms%20for%20male%20non%20farm%20labourers%20in%20rural%20India.JPG">wage rates in real terms</a> on average grew by just 0.3 percent annually during the period from 2015-16 to 2020-21.&nbsp;</p><p style="text-align:justify">Please <a href="https://docs.google.com/spreadsheets/d/1avu0-WtaKV2RHXtz2eiP7iS8znGVBdKC/edit?usp=sharing&amp;ouid=112233925171588304692&amp;rtpof=true&amp;sd=true" title="https://docs.google.com/spreadsheets/d/1avu0-WtaKV2RHXtz2eiP7iS8znGVBdKC/edit?usp=sharing&amp;ouid=112233925171588304692&amp;rtpof=true&amp;sd=true">click here</a> to access the spreadsheet in order to look at the <a href="/upload/files/State%20wise%20average%20daily%20nominal%20wage%20rates%20in%20rural%20india%20men%20non%20farm%20labourers.JPG" title="/upload/files/State%20wise%20average%20daily%20nominal%20wage%20rates%20in%20rural%20india%20men%20non%20farm%20labourers.JPG">trends in nominal wage rates</a>, <a href="/upload/files/State%20wise%20growth%20in%20average%20daily%20nominal%20wage%20rates%20in%20rural%20india%20men%20non%20farm%20labourers.JPG" title="/upload/files/State%20wise%20growth%20in%20average%20daily%20nominal%20wage%20rates%20in%20rural%20india%20men%20non%20farm%20labourers.JPG">annual growth in nominal wage rates</a>, and <a href="/upload/files/State%20wise%20growth%20in%20average%20daily%20wage%20rates%20in%20real%20terms%20for%20male%20non%20farm%20labourers%20in%20rural%20India.JPG" title="/upload/files/State%20wise%20growth%20in%20average%20daily%20wage%20rates%20in%20real%20terms%20for%20male%20non%20farm%20labourers%20in%20rural%20India.JPG">annual growth in real wage rates</a> for non-farm labourers in rural areas.&nbsp;</p><p style="text-align:justify"><strong>Construction sector wages in rural areas</strong></p><p style="text-align:justify">The <a href="https://im4change.org/upload/files/State%20wise%20average%20daily%20nominal%20wage%20rates%20in%20rural%20india%20men%20construction%20workers.JPG" title="https://im4change.org/upload/files/State%20wise%20average%20daily%20nominal%20wage%20rates%20in%20rural%20india%20men%20construction%20workers.JPG">highest average daily nominal wage rates</a> <a href="https://im4change.org/upload/files/State%20wise%20average%20daily%20nominal%20wage%20rates%20in%20rural%20india%20men%20construction%20workers.JPG" title="https://im4change.org/upload/files/State%20wise%20average%20daily%20nominal%20wage%20rates%20in%20rural%20india%20men%20construction%20workers.JPG">for male construction workers in rural India</a> during the period from 2014-15 to 2020-21 was detected in Kerala <em>(Rs. 810.3)</em>, followed by Jammu and Kashmir <em>(Rs. 445.1)</em>, Tamil Nadu <em>(Rs. 424.1)</em>, Haryana <em>(Rs. 379.9)</em>, Himachal Pradesh <em>(Rs. 368.7)</em>, Rajasthan <em>(Rs. 347.7)</em>, and Punjab <em>(Rs. 339.1)</em>. Kindly see chart-1.&nbsp;</p><p style="text-align:justify">The <a href="https://im4change.org/upload/files/State%20wise%20average%20daily%20nominal%20wage%20rates%20in%20rural%20india%20men%20construction%20workers.JPG" title="https://im4change.org/upload/files/State%20wise%20average%20daily%20nominal%20wage%20rates%20in%20rural%20india%20men%20construction%20workers.JPG">lowest average daily nominal wage rates</a> <a href="https://im4change.org/upload/files/State%20wise%20average%20daily%20nominal%20wage%20rates%20in%20rural%20india%20men%20construction%20workers.JPG" title="https://im4change.org/upload/files/State%20wise%20average%20daily%20nominal%20wage%20rates%20in%20rural%20india%20men%20construction%20workers.JPG">for male construction workers in rural areas</a> during the period from 2014-15 to 2020-21 was found in Madhya Pradesh <em>(Rs. 212.4)</em>, followed by Tripura <em>(Rs. 230.4)</em>, Meghalaya <em>(Rs. 231.7)</em>, Odisha <em>(Rs. 247.1)</em>, Gujarat <em>(Rs. 251.8)</em>, Uttar Pradesh <em>(Rs. 267.4)</em>, Bihar <em>(Rs. 270.8)</em>, and West Bengal <em>(Rs. 274.0)</em>. The related national level figure was Rs. 316.9 during the period from 2014-15 to 2020-21. Kindly consult chart-1.</p><p style="text-align:justify">The <a href="https://im4change.org/upload/files/State%20wise%20growth%20in%20average%20daily%20nominal%20wage%20rates%20in%20rural%20india%20men%20construction%20workers.JPG" title="https://im4change.org/upload/files/State%20wise%20growth%20in%20average%20daily%20nominal%20wage%20rates%20in%20rural%20india%20men%20construction%20workers.JPG">highest average annual growth rates in</a> <a href="https://im4change.org/upload/files/State%20wise%20growth%20in%20average%20daily%20nominal%20wage%20rates%20in%20rural%20india%20men%20construction%20workers.JPG" title="https://im4change.org/upload/files/State%20wise%20growth%20in%20average%20daily%20nominal%20wage%20rates%20in%20rural%20india%20men%20construction%20workers.JPG">nominal wage rates</a> during the period from 2015-16 to 2020-21 was noticed in Meghalaya <em>(20.9 percent)</em>, followed by Madhya Pradesh <em>(7.4 percent)</em>, Odisha and Andhra Pradesh <em>(6.8 percent each)</em>, Uttar Pradesh <em>(6.4 percent)</em>, and Bihar <em>(6.2 percent)</em>. Please see chart-2.&nbsp;</p><p style="text-align:justify">The <a href="https://im4change.org/upload/files/State%20wise%20growth%20in%20average%20daily%20nominal%20wage%20rates%20in%20rural%20india%20men%20construction%20workers.JPG" title="https://im4change.org/upload/files/State%20wise%20growth%20in%20average%20daily%20nominal%20wage%20rates%20in%20rural%20india%20men%20construction%20workers.JPG">lowest average annual growth rates in</a> <a href="https://im4change.org/upload/files/State%20wise%20growth%20in%20average%20daily%20nominal%20wage%20rates%20in%20rural%20india%20men%20construction%20workers.JPG" title="https://im4change.org/upload/files/State%20wise%20growth%20in%20average%20daily%20nominal%20wage%20rates%20in%20rural%20india%20men%20construction%20workers.JPG">nominal wage rates</a> during the same period was observed in Kerala <em>(0.9 percent)</em>, followed by Manipur <em>(2.0 percent)</em>, Haryana <em>(2.1 percent)</em>, Jammu and Kashmir <em>(3.0 percent)</em>, Rajasthan <em>(3.2 percent)</em>, and Gujarat <em>(3.6 percent)</em>. Please see chart-2.</p><p style="text-align:justify">The <a href="https://im4change.org/upload/files/State%20wise%20growth%20in%20average%20daily%20wage%20rates%20in%20real%20terms%20for%20male%20construction%20workers%20in%20rural%20India%281%29.JPG" title="https://im4change.org/upload/files/State%20wise%20growth%20in%20average%20daily%20wage%20rates%20in%20real%20terms%20for%20male%20construction%20workers%20in%20rural%20India%281%29.JPG">average annual growth of construction workers&rsquo;</a> <a href="https://im4change.org/upload/files/State%20wise%20growth%20in%20average%20daily%20wage%20rates%20in%20real%20terms%20for%20male%20construction%20workers%20in%20rural%20India%281%29.JPG" title="https://im4change.org/upload/files/State%20wise%20growth%20in%20average%20daily%20wage%20rates%20in%20real%20terms%20for%20male%20construction%20workers%20in%20rural%20India%281%29.JPG">wage rates in real terms</a> during the period from 2015-16 to 2020-21 was negative in Assam <em>(-1.2 percent)</em>, Haryana <em>(-2.1 percent)</em>, Jammu and Kashmir <em>(-2.7 percent)</em>, Karnataka <em>(-0.6 percent)</em>, Kerala <em>(-4.4 percent)</em>, Manipur <em>(-6.3 percent)</em>, Rajasthan <em>(-1.2 percent)</em>, Tamil Nadu <em>(-0.9 percent)</em>, and Tripura <em>(-1.1 percent)</em>. Please note that the <a href="https://im4change.org/upload/files/State-wise%20Average%20Inflation%20CPI%20-%20Inflation.PDF" title="https://im4change.org/upload/files/State-wise%20Average%20Inflation%20CPI%20-%20Inflation.PDF">rate of inflation</a> in <a href="https://im4change.org/upload/files/State-wise%20Average%20Inflation%20CPI%20-%20Inflation.PDF" title="https://im4change.org/upload/files/State-wise%20Average%20Inflation%20CPI%20-%20Inflation.PDF">CPI-General</a> has been used to get the average annual growth of construction workers&rsquo; wage rates in real terms. Kindly have a look at table-1. &nbsp;&nbsp;</p><p style="text-align:justify">In the case of Meghalaya, the <a href="https://im4change.org/upload/files/State%20wise%20average%20daily%20nominal%20wage%20rates%20in%20rural%20india%20men%20construction%20workers.JPG" title="https://im4change.org/upload/files/State%20wise%20average%20daily%20nominal%20wage%20rates%20in%20rural%20india%20men%20construction%20workers.JPG">nominal daily wage rate of male construction</a> <a href="https://im4change.org/upload/files/State%20wise%20average%20daily%20nominal%20wage%20rates%20in%20rural%20india%20men%20construction%20workers.JPG" title="https://im4change.org/upload/files/State%20wise%20average%20daily%20nominal%20wage%20rates%20in%20rural%20india%20men%20construction%20workers.JPG">workers</a> fell from Rs. 186.0 in 2016-17 to Rs. 100.0 in 2017-18 i.e., a decline&nbsp;by -46.2 percent over previous year. However, the same bounced back to Rs. 273.2 in 2018-19 i.e., an increase by 173.2 percent over previous year. In <a href="https://im4change.org/upload/files/State%20wise%20growth%20in%20average%20daily%20wage%20rates%20in%20real%20terms%20for%20male%20construction%20workers%20in%20rural%20India%281%29.JPG" title="https://im4change.org/upload/files/State%20wise%20growth%20in%20average%20daily%20wage%20rates%20in%20real%20terms%20for%20male%20construction%20workers%20in%20rural%20India%281%29.JPG">real terms, the construction sector</a> <a href="https://im4change.org/upload/files/State%20wise%20growth%20in%20average%20daily%20wage%20rates%20in%20real%20terms%20for%20male%20construction%20workers%20in%20rural%20India%281%29.JPG" title="https://im4change.org/upload/files/State%20wise%20growth%20in%20average%20daily%20wage%20rates%20in%20real%20terms%20for%20male%20construction%20workers%20in%20rural%20India%281%29.JPG">wage rate in Meghalaya</a> grew by -47.7 percent in 2017-18 <em>(over previous year)</em> and 171.0 percent in 2018-19 <em>(over previous year)</em>.</p><p style="text-align:justify">Some states experienced negative <a href="https://im4change.org/upload/files/State%20wise%20growth%20in%20average%20daily%20wage%20rates%20in%20real%20terms%20for%20male%20construction%20workers%20in%20rural%20India%281%29.JPG" title="https://im4change.org/upload/files/State%20wise%20growth%20in%20average%20daily%20wage%20rates%20in%20real%20terms%20for%20male%20construction%20workers%20in%20rural%20India%281%29.JPG">growth in construction workers&rsquo;</a> <a href="https://im4change.org/upload/files/State%20wise%20growth%20in%20average%20daily%20wage%20rates%20in%20real%20terms%20for%20male%20construction%20workers%20in%20rural%20India%281%29.JPG" title="https://im4change.org/upload/files/State%20wise%20growth%20in%20average%20daily%20wage%20rates%20in%20real%20terms%20for%20male%20construction%20workers%20in%20rural%20India%281%29.JPG">wage rates in real terms</a> for more than two years between 2015-16 and 2020-21. For example, <a href="https://im4change.org/upload/files/State%20wise%20growth%20in%20average%20daily%20wage%20rates%20in%20real%20terms%20for%20male%20construction%20workers%20in%20rural%20India%281%29.JPG" title="https://im4change.org/upload/files/State%20wise%20growth%20in%20average%20daily%20wage%20rates%20in%20real%20terms%20for%20male%20construction%20workers%20in%20rural%20India%281%29.JPG">Assam</a> experienced negative growth in wage rates <em>(in real terms)</em> during 2017-18, 2018-19, 2019-20, and 2020-21. &nbsp;</p><p style="text-align:justify">At the national level, the&nbsp;<a href="https://im4change.org/upload/files/State%20wise%20growth%20in%20average%20daily%20wage%20rates%20in%20real%20terms%20for%20male%20construction%20workers%20in%20rural%20India%281%29.JPG" title="https://im4change.org/upload/files/State%20wise%20growth%20in%20average%20daily%20wage%20rates%20in%20real%20terms%20for%20male%20construction%20workers%20in%20rural%20India%281%29.JPG">construction workers&rsquo; wage rates in real terms</a> on average grew by just 0.1 percent annually during the period from 2015-16 to 2020-21.</p><p style="text-align:justify">Kindly <a href="https://docs.google.com/spreadsheets/d/1avu0-WtaKV2RHXtz2eiP7iS8znGVBdKC/edit?usp=sharing&amp;ouid=112233925171588304692&amp;rtpof=true&amp;sd=true" title="https://docs.google.com/spreadsheets/d/1avu0-WtaKV2RHXtz2eiP7iS8znGVBdKC/edit?usp=sharing&amp;ouid=112233925171588304692&amp;rtpof=true&amp;sd=true">click here</a> to access the spreadsheet in order to look at the <a href="/upload/files/State%20wise%20average%20daily%20nominal%20wage%20rates%20in%20rural%20india%20men%20construction%20workers.JPG" title="/upload/files/State%20wise%20average%20daily%20nominal%20wage%20rates%20in%20rural%20india%20men%20construction%20workers.JPG">trends in nominal wage rates</a>, <a href="/upload/files/State%20wise%20growth%20in%20average%20daily%20nominal%20wage%20rates%20in%20rural%20india%20men%20construction%20workers.JPG" title="/upload/files/State%20wise%20growth%20in%20average%20daily%20nominal%20wage%20rates%20in%20rural%20india%20men%20construction%20workers.JPG">annual growth in nominal wage rates</a>, and <a href="/upload/files/State%20wise%20growth%20in%20average%20daily%20wage%20rates%20in%20real%20terms%20for%20male%20construction%20workers%20in%20rural%20India%281%29.JPG" title="/upload/files/State%20wise%20growth%20in%20average%20daily%20wage%20rates%20in%20real%20terms%20for%20male%20construction%20workers%20in%20rural%20India%281%29.JPG">annual growth in real wage rates</a> for construction workers in rural areas.&nbsp;</p><p style="text-align:justify"><strong>Data collection methodology</strong></p><p style="text-align:justify">As a part of Rural Labour Enquiry, the&nbsp;<a href="https://im4change.org/upload/files/ilj_feb_2013.pdf" title="https://im4change.org/upload/files/ilj_feb_2013.pdf">daily wage rates</a> in respect of eighteen agricultural and non-agricultural occupations are being collected along with rural retail price data by the Field Operations Division of the National Sample Survey Organisation since 1986-87, according to a February 2013 <a href="https://im4change.org/upload/files/ilj_feb_2013.pdf" title="https://im4change.org/upload/files/ilj_feb_2013.pdf">edition of the Indian Labour Journal</a>.&nbsp;On the recommendations of the Governing Council of the National Sample Survey Organisation in its 61st meeting,&nbsp;the <a href="https://im4change.org/upload/files/ilj_feb_2013.pdf" title="https://im4change.org/upload/files/ilj_feb_2013.pdf">Labour Bureau</a> started the compilation and analysis of wage rate data with effect from April, 1998.&nbsp;</p><p style="text-align:justify">The Field Operations Division of the National Sample Survey Organisation has been entrusted with the work of <a href="https://im4change.org/upload/files/METHOLOGY%20FOR%20COMPILATION%20OF%20THE%20WAGE%20RATE%20DATA.pdf" title="https://im4change.org/upload/files/METHOLOGY%20FOR%20COMPILATION%20OF%20THE%20WAGE%20RATE%20DATA.pdf">data collection</a>. The <a href="https://im4change.org/upload/files/METHOLOGY%20FOR%20COMPILATION%20OF%20THE%20WAGE%20RATE%20DATA.pdf" title="https://im4change.org/upload/files/METHOLOGY%20FOR%20COMPILATION%20OF%20THE%20WAGE%20RATE%20DATA.pdf">wage rate data</a> are being collected along with rural retail prices from 600 sample villages spread over 66 NSS regions of 20 States by canvassing Block-5 <em>(Annexure-I)</em> of Schedule 3.01(R). The data collection from these sample villages is staggered over the four weeks of a month with one-fourth of them being covered every week. The days of canvassing of Schedule 3.01(R) are fixed. The village functionaries like the Panchayat Secretary, Progress Assistant, Patwari and other Village or Block Officials are the primary informants for collection of data on wage rates. The data on normal working hours and the prevailing wage rates in cash and kind for the reported working hours are collected sex-wise for each of the 18 selected occupations in 20 states, indicates an old&nbsp;<a href="https://im4change.org/upload/files/METHOLOGY%20FOR%20COMPILATION%20OF%20THE%20WAGE%20RATE%20DATA.pdf" title="https://im4change.org/upload/files/METHOLOGY%20FOR%20COMPILATION%20OF%20THE%20WAGE%20RATE%20DATA.pdf">document</a> of the Labour Bureau. &nbsp;&nbsp;</p><p style="text-align:justify">The wage rates are sometimes reported for a duration that is less/more than the normal working hours. In such cases, they are <a href="https://im4change.org/upload/files/METHOLOGY%20FOR%20COMPILATION%20OF%20THE%20WAGE%20RATE%20DATA.pdf" title="https://im4change.org/upload/files/METHOLOGY%20FOR%20COMPILATION%20OF%20THE%20WAGE%20RATE%20DATA.pdf">first normalised for eight hours</a> working day. As regards the mode of payment of wages, it is made in both ways i.e., in cash and/or in kind. The payments made in kind are very common in rural areas, which include foodgrains, cooked food, tea, fuel, cigarette, beedi, fodder, etc.&nbsp;The wages reported in kind are evaluated at local retail prices. Thereafter, the data is thoroughly scrutinised and discrepant points are referred back to the field for clarification. In the next stage, the simple arithmetic average of these normalised daily wage rates is worked out occupation-wise and sex-wise for each state.</p><p style="text-align:justify"><a href="http://ras.org.in/methodology_of_data_collection_unsuited_to_changing_rural_reality" title="http://ras.org.in/methodology_of_data_collection_unsuited_to_changing_rural_reality">Up to June 2000</a>, the average wage rates at the national level were derived by taking the simple average of state figures; since July 2000, the averages have been obtained by dividing the sum total of wages of all 20 states by the number of centres or villages from which data were collected. The state-wise averages are restricted only to those occupations where the number of centres is five or more to avoid abnormal fluctuations and inconsistency in wages paid to different categories of workers on account of varying numbers of centres. However, in order to calculate the all-India averages, all neglected centres are taken into account to arrive at the total number of centres at the national level.</p><p style="text-align:justify">The <a href="/upload/files/RBI%20note%20Average%20Daily%20Wage%20rate%20Methodology.pdf" title="/upload/files/RBI%20note%20Average%20Daily%20Wage%20rate%20Methodology.pdf">Reserve Bank of India</a>&nbsp;<em>(whose data we have used in writing this news alert)</em> has collated and is releasing monthly time series data on rural wage rates based on the data published by the Labour Bureau, Government of India. Starting from November 2013 the Labour Bureau is collecting the rural wage data in respect of 12 agricultural and 13 non-agricultural occupations across 20 major states, namely, Andhra Pradesh, Assam, Bihar, Gujarat, Haryana, Himachal Pradesh, Jammu &amp; Kashmir, Karnataka, Kerala, Madhya Pradesh, Maharashtra, Manipur, Meghalaya, Orissa, Punjab, Rajasthan, Tamil Nadu, Tripura, Uttar Pradesh and West Bengal. The occupations for which the daily wage rates are collected every month are: <u>(A) Agricultural occupations</u> &ndash; (1) &nbsp;Ploughing/ Tilling workers, (2) Sowing <em>(including planting/ Transplanting/ Weeding)</em> workers, (3) Harvesting/ Winnowing/ Threshing workers, (4) Picking workers <em>(including Tea, Cotton, Tobacco and other commercial crops)</em>, (5) Horticulture workers <em>(including nursery growers)</em>, (6) Fishermen-inland, (7) Fishermen coastal/deep-sea, (8) Loggers and wood cutters, (9) Animal husbandry workers <em>(including poultry workers, dairy workers and herdsman)</em>, (10) Packaging labourers, agriculture, (11) General agricultural labourers <em>(including watering/ irrigation workers, etc.)</em>, (12) Plant protection workers <em>(applying pesticides, treating seeds, etc.)</em>; and <u>(B) Non-agricultural occupations</u> &ndash; (13) Carpenter, (14) Blacksmith, (15) Mason, (16) Weavers, (17) Beedi makers, (18) Bamboo, cane basket weavers, (19) Handicraft workers, (20) Plumbers, (21) Electrician, (22) Construction workers <em>(for roads, dams, industrial &amp; project construction work and Well diggers)</em>, (23) LMV &amp; Tractor drivers, (24) Non-agricultural labourers <em>(including porters, loaders)</em>, and (25) Sweeping/cleaning workers.&nbsp;</p><p style="text-align:justify"><strong><em>References&nbsp;</em></strong></p><p style="text-align:justify">Handbook of Statistics on Indian States 2020-21, released in November 2021, please <a href="https://m.rbi.org.in/scripts/AnnualPublications.aspx?head=Handbook%20of%20Statistics%20on%20Indian%20States" title="https://m.rbi.org.in/scripts/AnnualPublications.aspx?head=Handbook%20of%20Statistics%20on%20Indian%20States">click here</a> to access</p><p style="text-align:justify">State-wise Average Daily Wage Rates in Rural India (Men - General Agricultural Labourers), RBI Handbook of Statistics on Indian States 2020-21, released in November 2021, please <a href="/upload/files/State-wise%20Average%20Daily%20Wage%20Rates%20in%20Rural%20India%20Men%20-%20General%20Agricultural%20Labourers.PDF" title="/upload/files/State-wise%20Average%20Daily%20Wage%20Rates%20in%20Rural%20India%20Men%20-%20General%20Agricultural%20Labourers.PDF">click here</a> to access&nbsp;</p><p style="text-align:justify">State-wise Average Daily Wage Rates in Rural India (Men - Non-Agricultural Labourers), RBI Handbook of Statistics on Indian States 2020-21, released in November 2021, please <a href="/upload/files/State-wise%20Average%20Daily%20Wage%20Rates%20in%20Rural%20India%20Men%20-%20Non%20Agricultural%20Labourers.PDF" title="/upload/files/State-wise%20Average%20Daily%20Wage%20Rates%20in%20Rural%20India%20Men%20-%20Non%20Agricultural%20Labourers.PDF">click here</a> to access&nbsp;</p><p style="text-align:justify">State-wise Average Daily Wage Rates in Rural India (Men - Construction Workers), RBI Handbook of Statistics on Indian States 2020-21, released in November 2021, please <a href="/upload/files/State-wise%20Average%20Daily%20Wage%20Rates%20in%20Rural%20India%20Men%20-%20Construction%20Workers.PDF" title="/upload/files/State-wise%20Average%20Daily%20Wage%20Rates%20in%20Rural%20India%20Men%20-%20Construction%20Workers.PDF">click here</a> to access&nbsp;</p><p style="text-align:justify">State-wise Average Inflation (CPI) - Inflation, RBI Handbook of Statistics on Indian States 2020-21, released in November 2021, please <a href="/upload/files/State-wise%20Average%20Inflation%20CPI%20-%20Inflation.PDF" title="/upload/files/State-wise%20Average%20Inflation%20CPI%20-%20Inflation.PDF">click here</a> to access&nbsp;</p><p style="text-align:justify">Indian Labour Journal, February 2013, please <a href="/upload/files/ilj_feb_2013.pdf" title="/upload/files/ilj_feb_2013.pdf">click here</a> to access &nbsp;</p><p style="text-align:justify">Wage Rates in Rural India 2003-04: Methodology for Compilation of the Wage Rate Data, Labour Bureau, please <a href="/upload/files/METHOLOGY%20FOR%20COMPILATION%20OF%20THE%20WAGE%20RATE%20DATA.pdf" title="/upload/files/METHOLOGY%20FOR%20COMPILATION%20OF%20THE%20WAGE%20RATE%20DATA.pdf">click here</a> to access&nbsp; &nbsp;&nbsp;</p><p style="text-align:justify">Average Daily Wage Rates in Rural India: Methodology and coverage (From November 2013), Reserve Bank of India, please <a href="https://dbie.rbi.org.in" title="https://dbie.rbi.org.in">click here</a>&nbsp;and <a href="/upload/files/RBI%20note%20Average%20Daily%20Wage%20rate%20Methodology%281%29.pdf" title="/upload/files/RBI%20note%20Average%20Daily%20Wage%20rate%20Methodology%281%29.pdf">here</a> to access&nbsp;</p><p style="text-align:justify">Consumer Price Index Numbers on Base 2012=100 for Rural, Urban and Combined for the month of January 2022, Ministry of Statistics and Programme Implementation (MoSPI), National Statistical Office (NSO), released on 14th February 2022, please <a href="/upload/files/CPI%20Press%20Release%20January%202022%281%29.pdf" title="/upload/files/CPI%20Press%20Release%20January%202022%281%29.pdf">click here</a> to access&nbsp;</p><p style="text-align:justify">Methodology of Data Collection Unsuited to Changing Rural Reality: A Study of Agricultural Wage Data in India -Yoshifumi Usami, Arindam Das, and Madhura Swaminathan, Review of Agrarian Studies, Vol. 10, No. 2, July-December, 2020, please <a href="http://ras.org.in/methodology_of_data_collection_unsuited_to_changing_rural_reality" title="http://ras.org.in/methodology_of_data_collection_unsuited_to_changing_rural_reality">click here</a> to access</p><p>Russia-ukraine crisis to push up fertiliser prices, govt subsidies, IANS/ Business Standard, 4 March, 2022, please <a href="https://www.business-standard.com/article/economy-policy/russia-ukraine-crisis-to-push-up-fertiliser-prices-govt-subsidies-122030400560_1.html" title="https://www.business-standard.com/article/economy-policy/russia-ukraine-crisis-to-push-up-fertiliser-prices-govt-subsidies-122030400560_1.html">click here</a> to access &nbsp;</p><p>Cooking oil prices spike in India due to Russia-ukraine crisis -B Krishna Mohan, TelanganaToday.com, 3 March, 2022, please <a href="https://telanganatoday.com/cooking-oil-prices-spike-in-india-due-to-russia-ukraine-crisis" title="https://telanganatoday.com/cooking-oil-prices-spike-in-india-due-to-russia-ukraine-crisis">click here</a> to access &nbsp;</p><p>Govt reviews cooking oil imports as ukraine crisis disrupts supplies, prices shoot up -Amiti Sen and Prabhudutta Mishra, The Hindu Business Line, 4 March, 2022, please <a href="https://www.thehindubusinessline.com/markets/commodities/govt-reviews-cooking-oil-imports-as-ukraine-crisis-disrupts-supplies-prices-shoot-up/article65190879.ece" title="https://www.thehindubusinessline.com/markets/commodities/govt-reviews-cooking-oil-imports-as-ukraine-crisis-disrupts-supplies-prices-shoot-up/article65190879.ece">click here</a> to access &nbsp;</p><p>India&#39;s Economy Faces A Potential Stagflation Risk From Ukraine War -Sunil Prabhu, NDTV.com, 1 March, 2022, please <a href="https://www.ndtv.com/business/indias-economy-faces-a-potential-stagflation-risk-from-ukraine-war-2796624" title="https://www.ndtv.com/business/indias-economy-faces-a-potential-stagflation-risk-from-ukraine-war-2796624">click here</a> to access</p><p>India to be one of Asia&rsquo;s &lsquo;biggest losers&rsquo; from the Ukraine war as Russia slammed by global sanctions -Paran Balakrishnan, The Telegraph, 1 March, 2022, please <a href="https://www.telegraphindia.com/business/russia-ukraine-crisis-india-to-be-one-of-asias-biggest-losers-from-the-ukraine-war-as-russia-slammed-by-global-sanctions/cid/1854032" title="https://www.telegraphindia.com/business/russia-ukraine-crisis-india-to-be-one-of-asias-biggest-losers-from-the-ukraine-war-as-russia-slammed-by-global-sanctions/cid/1854032">click here</a> to access</p><p>Crude Oil Prices Rise, Tracking Russia-Ukraine Conflict -Rahul Karunakar, NDTV.com <em>(with inputs from Agencies)</em>, 1 March, 2022, please <a href="https://www.ndtv.com/business/crude-oil-prices-rise-on-tuesday-tracking-russia-ukraine-conflict-2796187" title="https://www.ndtv.com/business/crude-oil-prices-rise-on-tuesday-tracking-russia-ukraine-conflict-2796187">click here</a> to access</p><p>Cooking Oil May Become Costlier Due to Russia-ukraine War. Know Why, News18.com, 27 February, 2022, please <a href="https://www.news18.com/news/business/markets/cooking-oil-may-become-costlier-due-to-russia-ukraine-war-know-why-4812740.html" title="https://www.news18.com/news/business/markets/cooking-oil-may-become-costlier-due-to-russia-ukraine-war-know-why-4812740.html">click here</a> to access &nbsp;</p><p style="text-align:justify"><strong>Image Courtesy: Inclusive Media for Change/ Shambhu Ghatak</strong></p>',
'lang' => 'English',
'SITE_URL' => 'https://im4change.in/',
'site_title' => 'im4change',
'adminprix' => 'admin'
]
$article_current = object(App\Model\Entity\Article) {
'id' => (int) 62349,
'title' => 'Real wage rates of the rural workers hardly increased during the last 6 years',
'subheading' => null,
'description' => '<p style="text-align:justify">In the absence of income or expenditure-based headcount ratio, the growth in the real wages <em>(i.e., nominal wages adjusted against retail inflation)</em> of the manual workers is considered to be a good proxy to assess the trends in poverty. This is because the manual, unskilled/ semi-skilled labourers exist at the bottom of the pyramid or economic hierarchy, and most of them belong to the social categories Scheduled Castes (SCs) and Scheduled Tribes (STs). A positive growth in their real wages <em>(or real wage rates) </em>is anticipated to improve their purchasing power <em>(i.e., income or consumption expenditure)</em> and lift them out of the poverty trap. &nbsp;</p>
<p style="text-align:justify">Clearly, there exists inter-state differences in nominal wage rates, growth in nominal wage rates and growth in real wage rates, which we will see in this news alert.&nbsp;</p>
<p style="text-align:justify">Against the backdrop of the <a href="https://www.thehindubusinessline.com/markets/commodities/govt-reviews-cooking-oil-imports-as-ukraine-crisis-disrupts-supplies-prices-shoot-up/article65190879.ece">Russia-Ukraine conflict</a>, which is anticipated to cause both <a href="https://www.ndtv.com/business/indias-economy-faces-a-potential-stagflation-risk-from-ukraine-war-2796624">food and fuel retail inflation</a> in India in the coming times, it is even more important to look at the past trends in wage rate growth of the rural workers. It should be noted that the <a href="https://public.flourish.studio/visualisation/8706137">year-on-year inflation</a> in <a href="https://public.flourish.studio/visualisation/8706137">Consumer</a> <a href="https://public.flourish.studio/visualisation/8706137">Price Index Rural</a> exceeded the <a href="https://public.flourish.studio/visualisation/8706137">year-on-year inflation</a> in <a href="https://public.flourish.studio/visualisation/8706137">CPI Urban</a> during January 2022 at the national level. Even before the beginning of Russia-Ukraine conflict <em>(i.e., during January 2022)</em>, in rural areas, <a href="https://im4change.org/upload/files/CPI%20Press%20Release%20January%202022%281%29.pdf">retail inflation rate of 20.6 percent</a> was noticed for &#39;oils and fats&#39;, aside from&nbsp;<a href="https://im4change.org/upload/files/CPI%20Press%20Release%20January%202022%281%29.pdf">8.44 percent retail inflation for &#39;fuel and light&#39;</a>, <a href="https://im4change.org/upload/files/CPI%20Press%20Release%20January%202022%281%29.pdf">8.27 percent</a> for &#39;transport and communication&#39;, and <a href="https://im4change.org/upload/files/CPI%20Press%20Release%20January%202022%281%29.pdf">9.65 percent for &#39;clothing and footwear&#39;</a>.&nbsp; &nbsp;&nbsp;</p>
<p style="text-align:justify">At the national level, the average daily nominal wage rate&nbsp;for male construction workers in rural areas during the period from 2014-15 to 2020-21 was Rs. 316.9, which was greater than that of the male non-farm workers in rural areas. The average daily nominal wage rate&nbsp;for male non-agricultural labourers in rural areas during the period from 2014-15 to 2020-21 was Rs. 273.8, which exceeded the average daily nominal wage rates for male farm labourers in rural areas <em>(i.e., Rs. 265.1)</em>. However, in Andhra Pradesh, Haryana, Himachal Pradesh, Jammu and Kashmir,&nbsp;Karnataka, Kerala, Meghalaya, Punjab, and Tripura, the average daily nominal wage rates for male agricultural labourers in rural areas during the period from 2014-15 to 2020-21 exceeded the average daily nominal wage rates for male non-farm labourers in rural areas. Please see chart-1.</p>
<p style="text-align:justify"><img alt="" src="/upload/images/Chart%201.png" style="height:670px; width:1000px" /></p>
<p style="text-align:justify"><em><strong>Notes:</strong> The average (i.e., arithmetic mean) daily nominal wage rates for various categories of workers in rural India in the period from 2014-15 to 2020-21 has been calculated by the Inclusive Media for Change staff</em></p>
<p style="text-align:justify"><em>Please <a href="https://docs.google.com/spreadsheets/d/1avu0-WtaKV2RHXtz2eiP7iS8znGVBdKC/edit?usp=sharing&amp;ouid=112233925171588304692&amp;rtpof=true&amp;sd=true">click here</a> to access the data in spreadsheet format</em></p>
<p style="text-align:justify"><em><strong>Source:&nbsp;</strong>Handbook of Statistics on Indian States 2020-21, released in November 2021, please <a href="https://m.rbi.org.in/scripts/AnnualPublications.aspx?head=Handbook%20of%20Statistics%20on%20Indian%20States">click here</a> to access</em></p>
<p style="text-align:justify"><em>State-wise Average Daily Wage Rates in Rural India (Men - General Agricultural Labourers), RBI Handbook of Statistics on Indian States 2020-21, released in November 2021, please <a href="/upload/files/State-wise%20Average%20Daily%20Wage%20Rates%20in%20Rural%20India%20Men%20-%20General%20Agricultural%20Labourers.PDF">click here</a> to access&nbsp;</em></p>
<p style="text-align:justify"><em>State-wise Average Daily Wage Rates in Rural India (Men - Non-Agricultural Labourers), RBI Handbook of Statistics on Indian States 2020-21, released in November 2021, please <a href="/upload/files/State-wise%20Average%20Daily%20Wage%20Rates%20in%20Rural%20India%20Men%20-%20Non%20Agricultural%20Labourers.PDF">click here</a> to access&nbsp;</em></p>
<p style="text-align:justify"><em>State-wise Average Daily Wage Rates in Rural India (Men - Construction Workers), RBI Handbook of Statistics on Indian States 2020-21, released in November 2021, please <a href="/upload/files/State-wise%20Average%20Daily%20Wage%20Rates%20in%20Rural%20India%20Men%20-%20Construction%20Workers.PDF">click here</a> to access&nbsp;</em></p>
<p style="text-align:justify"><em>State-wise Average Inflation (CPI) - Inflation, RBI Handbook of Statistics on Indian States 2020-21, released in November 2021, please <a href="/upload/files/State-wise%20Average%20Inflation%20CPI%20-%20Inflation.PDF">click here</a> to access&nbsp;</em></p>
<p style="text-align:justify"><strong>---</strong></p>
<p style="text-align:justify">At the national level, the agricultural nominal wage rate&nbsp;grew faster than the non-farm wage&nbsp;rate&nbsp;on average for male labourers in rural areas during the period from 2015-16 to 2020-21. However, in states like Assam, Bihar, Haryana, Madhya Pradesh, Odisha, Punjab, and West Bengal, the non-farm nominal wage rates grew faster than the farm wage rates on average for male workers in rural areas during the period from 2015-16 to 2020-21. Please see chart-2.&nbsp;</p>
<p style="text-align:justify"><img alt="" src="/upload/images/Chart%202.png" style="height:653px; width:1000px" /></p>
<p style="text-align:justify"><em><strong>Notes: </strong>The average growth in daily nominal wage rates for various categories of workers in rural India in the period from 2015-16 to 2020-21 has been calculated by the Inclusive Media for Change staff</em></p>
<p style="text-align:justify"><em>Please <a href="https://docs.google.com/spreadsheets/d/1avu0-WtaKV2RHXtz2eiP7iS8znGVBdKC/edit?usp=sharing&amp;ouid=112233925171588304692&amp;rtpof=true&amp;sd=true">click here</a> to access the data in spreadsheet format</em></p>
<p style="text-align:justify"><em><strong>Source: </strong>Same as above</em><br />
<strong>---</strong></p>
<p style="text-align:justify">At the national level, the construction sector nominal wage rate&nbsp;grew slower than the non-agricultural wage&nbsp;rate&nbsp;on average for male labourers in rural areas during the period from 2015-16 to 2020-21. However, in states like Andhra Pradesh, Bihar, Himachal Pradesh, Maharashtra, Meghalaya, Punjab,&nbsp;Tamil Nadu, and Uttar Pradesh, the construction sector nominal wage rates grew faster than the non-farm wage rates on average for male workers in rural areas during the period from 2015-16 to 2020-21. Please take a look at chart-2. &nbsp;</p>
<p style="text-align:justify">At the national level, the agricultural wage rate&nbsp;in real terms grew faster than the non-farm wage rate&nbsp;on average for male labourers in rural areas during the period from 2015-16 to 2020-21. However, in states like Assam, Bihar, Haryana, Madhya Pradesh, Odisha, Punjab, and West Bengal, the non-farm wage rates in real terms grew faster than the farm wage rates on average for male workers in rural areas during the period from 2015-16 to 2020-21. Please see table-1.</p>
<p style="text-align:justify"><strong>Table 1: State-wise Growth in Average Daily Wage Rates in Real terms for Male Agricultural Labourers, Male Non-Agricultural Labourers, and Male Construction Workers in Rural India, in %</strong><br />
<img alt="" src="/upload/images/Table%201%20State-wise%20Growth%20in%20Average%20Daily%20Wage%20Rates%20in%20Real%20terms%20for%20Male%20Agricultural%20Labourers%20Male%20Non-Agricultural%20Labourers%20and%20Male%20Construction%20Workers%20in%20Rural%20India%20in%20percent.png" style="height:539px; width:750px" /></p>
<p style="text-align:justify"><em><strong>Notes: </strong>The average growth in daily wage rates in real terms for various categories of workers in rural India in the period from 2015-16 to 2020-21 has been calculated by the Inclusive Media for Change staff</em></p>
<p style="text-align:justify"><em>Please <a href="https://docs.google.com/spreadsheets/d/1avu0-WtaKV2RHXtz2eiP7iS8znGVBdKC/edit?usp=sharing&amp;ouid=112233925171588304692&amp;rtpof=true&amp;sd=true">click here</a> to access the data in spreadsheet format</em></p>
<p style="text-align:justify"><em><strong>Source: </strong>Same as above</em><br />
<strong>---</strong></p>
<p style="text-align:justify">At the national level, the construction sector wage rate&nbsp;in real terms grew slower than the non-agricultural wage rate&nbsp;on average for male labourers in rural areas during the period from 2015-16 to 2020-21. However, in states like Andhra Pradesh, Bihar, Himachal Pradesh, Maharashtra, Meghalaya, Punjab, Tamil Nadu, and Uttar Pradesh, the construction sector wage rates in real terms grew faster than the non-farm wage rates on average for male workers in rural areas during the period from 2015-16 to 2020-21. Please take a look at table-1. &nbsp;</p>
<p style="text-align:justify">In the following paragraphs, we have discussed the trends in agricultural wage rates, non-farm wage rates, and construction sector wage rates <em>(in rural areas)</em> in detail.&nbsp;</p>
<p style="text-align:justify"><strong>Agricultural wages in rural areas</strong></p>
<p style="text-align:justify">The highest <a href="https://im4change.org/upload/files/State%20wise%20average%20daily%20nominal%20wage%20rates%20in%20rural%20india%20men%20farm%20labourers.JPG">average daily nominal wage rate</a> <a href="https://im4change.org/upload/files/State%20wise%20average%20daily%20nominal%20wage%20rates%20in%20rural%20india%20men%20farm%20labourers.JPG">for male agricultural labourers</a> in rural India during the period from 2014-15 to 2020-21 was found in Kerala <em>(Rs. 653.93)</em>, followed by Jammu and Kashmir <em>(Rs. 429.19)</em>, Tamil Nadu <em>(Rs. 385.6)</em>, Haryana <em>(Rs. 368.53)</em>, Himachal Pradesh <em>(Rs. 366.23)</em>, and Punjab <em>(Rs. 325.31)</em>. Please have a look at chart-1.</p>
<p style="text-align:justify">The lowest <a href="https://im4change.org/upload/files/State%20wise%20average%20daily%20nominal%20wage%20rates%20in%20rural%20india%20men%20farm%20labourers.JPG">average daily nominal wage rate</a> <a href="https://im4change.org/upload/files/State%20wise%20average%20daily%20nominal%20wage%20rates%20in%20rural%20india%20men%20farm%20labourers.JPG">for male agricultural labourers</a> in rural India during the period from 2014-15 to 2020-21 was observed in Madhya Pradesh <em>(Rs. 183.97)</em>, followed by Gujarat <em>(Rs. 190.07)</em>, Maharashtra <em>(Rs. 215.71)</em>, Odisha <em>(Rs. 216.87)</em>, Meghalaya <em>(Rs. 219.93)</em>, Bihar <em>(Rs. 230.43)</em>, Uttar Pradesh <em>(Rs. 230.5)</em>, and Assam <em>(Rs. 237.3)</em>. The related national level figure was Rs. 265.09 during the period from 2014-15 to 2020-21. Please consult chart-1.&nbsp;</p>
<p style="text-align:justify">The highest <a href="https://im4change.org/upload/files/State%20wise%20growth%20in%20average%20daily%20nominal%20wage%20rates%20in%20rural%20india%20men%20farm%20labourers.JPG">average annual growth rate in</a> <a href="https://im4change.org/upload/files/State%20wise%20growth%20in%20average%20daily%20nominal%20wage%20rates%20in%20rural%20india%20men%20farm%20labourers.JPG">nominal wage rates</a> during the period from 2015-16 to 2020-21 was found in Karnataka <em>(7.3 percent)</em>, followed by Andhra Pradesh <em>(6.8 percent)</em>, Madhya Pradesh <em>(6.4 percent)</em>, Uttar Pradesh <em>(6.2 percent)</em>, Odisha <em>(6.1 percent)</em>, and Meghalaya <em>(6.0 percent)</em>. Please see chart-2.</p>
<p style="text-align:justify">The lowest <a href="https://im4change.org/upload/files/State%20wise%20growth%20in%20average%20daily%20nominal%20wage%20rates%20in%20rural%20india%20men%20farm%20labourers.JPG">average annual growth rate</a> <a href="https://im4change.org/upload/files/State%20wise%20growth%20in%20average%20daily%20nominal%20wage%20rates%20in%20rural%20india%20men%20farm%20labourers.JPG">in nominal wage rates</a> during the same period was noticed in Haryana <em>(2.1 percent)</em>, followed by Rajasthan <em>(3.3 percent)</em>, Kerala <em>(3.5 percent)</em>, Punjab <em>(3.9 percent)</em>, and Tamil Nadu <em>(4.5 percent)</em>. Please consult chart-2.</p>
<p style="text-align:justify">The average annual <a href="https://im4change.org/upload/files/State%20wise%20growth%20in%20average%20daily%20wage%20rates%20in%20real%20terms%20for%20male%20farm%20labourers%20in%20rural%20India.JPG">growth of agricultural labourers&rsquo;</a> <a href="https://im4change.org/upload/files/State%20wise%20growth%20in%20average%20daily%20wage%20rates%20in%20real%20terms%20for%20male%20farm%20labourers%20in%20rural%20India.JPG">wage rates in real terms</a> during the period from 2015-16 to 2020-21 were negative in Haryana <em>(-2.1 percent)</em>, Jammu and Kashmir <em>(-0.3 percent)</em>, Kerala <em>(-1.7 percent)</em>, Punjab <em>(-0.4 percent)</em>, Rajasthan <em>(-1.1 percent)</em>, Tamil Nadu <em>(-0.8 percent)</em>, Tripura <em>(-0.5 percent)</em>, and West Bengal <em>(-0.1 percent)</em>. It should be noted that the <a href="https://im4change.org/upload/files/State-wise%20Average%20Inflation%20CPI%20-%20Inflation.PDF">rate of inflation</a> in <a href="https://im4change.org/upload/files/State-wise%20Average%20Inflation%20CPI%20-%20Inflation.PDF">Consumer Price Index-General</a> has been used to get the average annual growth of agricultural labourers&rsquo; wage rates in real terms. Kindly consult table-1. &nbsp;</p>
<p style="text-align:justify">Some states witnessed negative <a href="https://im4change.org/upload/files/State%20wise%20growth%20in%20average%20daily%20wage%20rates%20in%20real%20terms%20for%20male%20farm%20labourers%20in%20rural%20India.JPG">growth in agricultural labourers&rsquo;</a> <a href="https://im4change.org/upload/files/State%20wise%20growth%20in%20average%20daily%20wage%20rates%20in%20real%20terms%20for%20male%20farm%20labourers%20in%20rural%20India.JPG">wage rates in real terms</a> for more than two years between 2015-16 and 2020-21. For example, <a href="https://im4change.org/upload/files/State%20wise%20growth%20in%20average%20daily%20wage%20rates%20in%20real%20terms%20for%20male%20farm%20labourers%20in%20rural%20India.JPG">Haryana</a> experienced negative growth in 2015-16, 2016-17, 2017-18, 2019-20, and 2020-21. Likewise, <a href="https://im4change.org/upload/files/State%20wise%20growth%20in%20average%20daily%20wage%20rates%20in%20real%20terms%20for%20male%20farm%20labourers%20in%20rural%20India.JPG">Kerala</a> faced negative growth in 2017-18, 2018-19, 2019-20, and 2020-21. &nbsp;</p>
<p style="text-align:justify">At the national level, the <a href="https://im4change.org/upload/files/State%20wise%20growth%20in%20average%20daily%20wage%20rates%20in%20real%20terms%20for%20male%20farm%20labourers%20in%20rural%20India.JPG">agricultural labourers&rsquo;</a> <a href="https://im4change.org/upload/files/State%20wise%20growth%20in%20average%20daily%20wage%20rates%20in%20real%20terms%20for%20male%20farm%20labourers%20in%20rural%20India.JPG">wage rates in real terms</a> on average grew by 1.0 percent annually during the period from 2015-16 to 2020-21.</p>
<p style="text-align:justify">Please <a href="https://docs.google.com/spreadsheets/d/1avu0-WtaKV2RHXtz2eiP7iS8znGVBdKC/edit?usp=sharing&amp;ouid=112233925171588304692&amp;rtpof=true&amp;sd=true">click here</a> to access the spreadsheet in order to look at the trends in <a href="/upload/files/State%20wise%20average%20daily%20nominal%20wage%20rates%20in%20rural%20india%20men%20farm%20labourers.JPG">nominal wage rates</a>, <a href="/upload/files/State%20wise%20growth%20in%20average%20daily%20nominal%20wage%20rates%20in%20rural%20india%20men%20farm%20labourers.JPG">annual growth in nominal wage rates</a> and <a href="/upload/files/State%20wise%20growth%20in%20average%20daily%20wage%20rates%20in%20real%20terms%20for%20male%20farm%20labourers%20in%20rural%20India.JPG">annual growth in real wage rates</a> for farm labourers in rural areas.&nbsp;</p>
<p style="text-align:justify"><strong>Non-agricultural wages in rural areas</strong></p>
<p style="text-align:justify">The rural economy is not just about farming any longer. That is why we have looked at the wage growth in the non-farm sector too.&nbsp;The highest <a href="https://im4change.org/upload/files/State%20wise%20average%20daily%20nominal%20wage%20rates%20in%20rural%20india%20men%20non%20farm%20labourers.JPG">average daily nominal wage rate for male</a> <a href="https://im4change.org/upload/files/State%20wise%20average%20daily%20nominal%20wage%20rates%20in%20rural%20india%20men%20non%20farm%20labourers.JPG">non-agricultural labourers</a> in rural India during the period from 2014-15 to 2020-21 was detected in Kerala <em>(Rs. 639.01)</em>, followed by Jammu and Kashmir <em>(Rs. 426.37)</em>, Tamil Nadu <em>(Rs. 405.77)</em>, Haryana <em>(Rs. 359.24)</em>, Himachal Pradesh <em>(Rs. 311.10)</em>, and Punjab <em>(Rs. 309.09)</em>. Please see chart-1.</p>
<p style="text-align:justify">The lowest average <a href="https://im4change.org/upload/files/State%20wise%20average%20daily%20nominal%20wage%20rates%20in%20rural%20india%20men%20non%20farm%20labourers.JPG">daily nominal wage rate for male</a> <a href="https://im4change.org/upload/files/State%20wise%20average%20daily%20nominal%20wage%20rates%20in%20rural%20india%20men%20non%20farm%20labourers.JPG">non-agricultural labourers in rural India</a> during the period from 2014-15 to 2020-21 was found in Madhya Pradesh <em>(Rs. 191.47)</em>, followed by Meghalaya <em>(Rs. 210.26)</em>, Gujarat <em>(Rs. 213.51)</em>, Odisha <em>(Rs. 218.06)</em>, Maharashtra <em>(Rs. 226.70)</em>, Tripura <em>(Rs. 230.36)</em>, Bihar <em>(Rs. 243.51)</em>, and Uttar Pradesh <em>(Rs. 243.97)</em>. The related national level figure was Rs. 273.79 during the period from 2014-15 to 2020-21. Please see chart-1.</p>
<p style="text-align:justify">The highest <a href="https://im4change.org/upload/files/State%20wise%20growth%20in%20average%20daily%20nominal%20wage%20rates%20in%20rural%20india%20men%20non%20farm%20labourers.JPG">average annual growth rate in</a> <a href="https://im4change.org/upload/files/State%20wise%20growth%20in%20average%20daily%20nominal%20wage%20rates%20in%20rural%20india%20men%20non%20farm%20labourers.JPG">nominal wage rates</a> during the period from 2015-16 to 2020-21 was noticed in Odisha <em>(8.0 percent)</em>, followed by Madhya Pradesh <em>(7.6 percent)</em>, Assam <em>(6.6 percent)</em>, West Bengal <em>(5.9 percent)</em>, Uttar Pradesh and Andhra Pradesh <em>(5.6 percent each)</em>, and Bihar <em>(5.5 percent)</em>. Kindly consult chart-2.</p>
<p style="text-align:justify">The lowest <a href="https://im4change.org/upload/files/State%20wise%20growth%20in%20average%20daily%20nominal%20wage%20rates%20in%20rural%20india%20men%20non%20farm%20labourers.JPG">average annual growth rate</a> <a href="https://im4change.org/upload/files/State%20wise%20growth%20in%20average%20daily%20nominal%20wage%20rates%20in%20rural%20india%20men%20non%20farm%20labourers.JPG">in nominal wage rates</a> during the same period was observed in Kerala <em>(1.8 percent)</em>, followed by Haryana <em>(2.4 percent)</em>, Meghalaya <em>(2.8 percent)</em>, Tamil Nadu and Rajasthan <em>(3.2 percent each)</em>, Tripura and Jammu and Kashmir <em>(4.0 percent each),</em> and Maharashtra and Punjab <em>(4.2 percent each)</em>. Kindly consult chart-2.&nbsp;</p>
<p style="text-align:justify">The average annual <a href="https://im4change.org/upload/files/State%20wise%20growth%20in%20average%20daily%20wage%20rates%20in%20real%20terms%20for%20male%20non%20farm%20labourers%20in%20rural%20India.JPG">growth of non-agricultural labourers&rsquo;</a> <a href="https://im4change.org/upload/files/State%20wise%20growth%20in%20average%20daily%20wage%20rates%20in%20real%20terms%20for%20male%20non%20farm%20labourers%20in%20rural%20India.JPG">wage rates in real terms</a> during the period from 2015-16 to 2020-21 were negative in Haryana <em>(-1.9 percent)</em>, Jammu and Kashmir <em>(-1.7 percent)</em>, Kerala <em>(-3.5 percent)</em>, Maharashtra <em>(-0.3 percent)</em>, Meghalaya <em>(-1.2 percent)</em>, Punjab <em>(-0.1 percent)</em>, Rajasthan <em>(-1.2 percent)</em>, Tamil Nadu <em>(-2.1 percent)</em>, and Tripura <em>(-1.1 percent)</em>. It should be noted that the <a href="https://im4change.org/upload/files/State-wise%20Average%20Inflation%20CPI%20-%20Inflation.PDF">rate of inflation</a> in <a href="https://im4change.org/upload/files/State-wise%20Average%20Inflation%20CPI%20-%20Inflation.PDF">CPI-General</a> has been used to get the average annual growth of non-agricultural labourers&rsquo; wage rates in real terms. Kindly have a look at table-1. &nbsp;&nbsp;</p>
<p style="text-align:justify">Some states experienced negative growth in <a href="https://im4change.org/upload/files/State%20wise%20growth%20in%20average%20daily%20wage%20rates%20in%20real%20terms%20for%20male%20non%20farm%20labourers%20in%20rural%20India.JPG">non-agricultural labourers&rsquo; wage</a> <a href="https://im4change.org/upload/files/State%20wise%20growth%20in%20average%20daily%20wage%20rates%20in%20real%20terms%20for%20male%20non%20farm%20labourers%20in%20rural%20India.JPG">rates in real terms</a> for more than two years between 2015-16 and 2020-21. For example, <a href="https://im4change.org/upload/files/State%20wise%20growth%20in%20average%20daily%20wage%20rates%20in%20real%20terms%20for%20male%20non%20farm%20labourers%20in%20rural%20India.JPG">Haryana</a> experienced negative <a href="https://im4change.org/upload/files/State%20wise%20growth%20in%20average%20daily%20wage%20rates%20in%20real%20terms%20for%20male%20non%20farm%20labourers%20in%20rural%20India.JPG">growth in wage rates</a> <a href="https://im4change.org/upload/files/State%20wise%20growth%20in%20average%20daily%20wage%20rates%20in%20real%20terms%20for%20male%20non%20farm%20labourers%20in%20rural%20India.JPG"><em>(in real terms)</em></a> during 2016-17, 2017-18, 2018-19, 2019-20, and 2020-21. Likewise, <a href="https://im4change.org/upload/files/State%20wise%20growth%20in%20average%20daily%20wage%20rates%20in%20real%20terms%20for%20male%20non%20farm%20labourers%20in%20rural%20India.JPG">Kerala</a> faced negative growth rates in 2015-16, 2016-17, 2017-18, 2019-20, and 2020-21. &nbsp;</p>
<p style="text-align:justify">At the national level, the&nbsp;<a href="https://im4change.org/upload/files/State%20wise%20growth%20in%20average%20daily%20wage%20rates%20in%20real%20terms%20for%20male%20non%20farm%20labourers%20in%20rural%20India.JPG">non-agricultural labourers&rsquo;</a> <a href="https://im4change.org/upload/files/State%20wise%20growth%20in%20average%20daily%20wage%20rates%20in%20real%20terms%20for%20male%20non%20farm%20labourers%20in%20rural%20India.JPG">wage rates in real terms</a> on average grew by just 0.3 percent annually during the period from 2015-16 to 2020-21.&nbsp;</p>
<p style="text-align:justify">Please <a href="https://docs.google.com/spreadsheets/d/1avu0-WtaKV2RHXtz2eiP7iS8znGVBdKC/edit?usp=sharing&amp;ouid=112233925171588304692&amp;rtpof=true&amp;sd=true">click here</a> to access the spreadsheet in order to look at the <a href="/upload/files/State%20wise%20average%20daily%20nominal%20wage%20rates%20in%20rural%20india%20men%20non%20farm%20labourers.JPG">trends in nominal wage rates</a>, <a href="/upload/files/State%20wise%20growth%20in%20average%20daily%20nominal%20wage%20rates%20in%20rural%20india%20men%20non%20farm%20labourers.JPG">annual growth in nominal wage rates</a>, and <a href="/upload/files/State%20wise%20growth%20in%20average%20daily%20wage%20rates%20in%20real%20terms%20for%20male%20non%20farm%20labourers%20in%20rural%20India.JPG">annual growth in real wage rates</a> for non-farm labourers in rural areas.&nbsp;</p>
<p style="text-align:justify"><strong>Construction sector wages in rural areas</strong></p>
<p style="text-align:justify">The <a href="https://im4change.org/upload/files/State%20wise%20average%20daily%20nominal%20wage%20rates%20in%20rural%20india%20men%20construction%20workers.JPG">highest average daily nominal wage rates</a> <a href="https://im4change.org/upload/files/State%20wise%20average%20daily%20nominal%20wage%20rates%20in%20rural%20india%20men%20construction%20workers.JPG">for male construction workers in rural India</a> during the period from 2014-15 to 2020-21 was detected in Kerala <em>(Rs. 810.3)</em>, followed by Jammu and Kashmir <em>(Rs. 445.1)</em>, Tamil Nadu <em>(Rs. 424.1)</em>, Haryana <em>(Rs. 379.9)</em>, Himachal Pradesh <em>(Rs. 368.7)</em>, Rajasthan <em>(Rs. 347.7)</em>, and Punjab <em>(Rs. 339.1)</em>. Kindly see chart-1.&nbsp;</p>
<p style="text-align:justify">The <a href="https://im4change.org/upload/files/State%20wise%20average%20daily%20nominal%20wage%20rates%20in%20rural%20india%20men%20construction%20workers.JPG">lowest average daily nominal wage rates</a> <a href="https://im4change.org/upload/files/State%20wise%20average%20daily%20nominal%20wage%20rates%20in%20rural%20india%20men%20construction%20workers.JPG">for male construction workers in rural areas</a> during the period from 2014-15 to 2020-21 was found in Madhya Pradesh <em>(Rs. 212.4)</em>, followed by Tripura <em>(Rs. 230.4)</em>, Meghalaya <em>(Rs. 231.7)</em>, Odisha <em>(Rs. 247.1)</em>, Gujarat <em>(Rs. 251.8)</em>, Uttar Pradesh <em>(Rs. 267.4)</em>, Bihar <em>(Rs. 270.8)</em>, and West Bengal <em>(Rs. 274.0)</em>. The related national level figure was Rs. 316.9 during the period from 2014-15 to 2020-21. Kindly consult chart-1.</p>
<p style="text-align:justify">The <a href="https://im4change.org/upload/files/State%20wise%20growth%20in%20average%20daily%20nominal%20wage%20rates%20in%20rural%20india%20men%20construction%20workers.JPG">highest average annual growth rates in</a> <a href="https://im4change.org/upload/files/State%20wise%20growth%20in%20average%20daily%20nominal%20wage%20rates%20in%20rural%20india%20men%20construction%20workers.JPG">nominal wage rates</a> during the period from 2015-16 to 2020-21 was noticed in Meghalaya <em>(20.9 percent)</em>, followed by Madhya Pradesh <em>(7.4 percent)</em>, Odisha and Andhra Pradesh <em>(6.8 percent each)</em>, Uttar Pradesh <em>(6.4 percent)</em>, and Bihar <em>(6.2 percent)</em>. Please see chart-2.&nbsp;</p>
<p style="text-align:justify">The <a href="https://im4change.org/upload/files/State%20wise%20growth%20in%20average%20daily%20nominal%20wage%20rates%20in%20rural%20india%20men%20construction%20workers.JPG">lowest average annual growth rates in</a> <a href="https://im4change.org/upload/files/State%20wise%20growth%20in%20average%20daily%20nominal%20wage%20rates%20in%20rural%20india%20men%20construction%20workers.JPG">nominal wage rates</a> during the same period was observed in Kerala <em>(0.9 percent)</em>, followed by Manipur <em>(2.0 percent)</em>, Haryana <em>(2.1 percent)</em>, Jammu and Kashmir <em>(3.0 percent)</em>, Rajasthan <em>(3.2 percent)</em>, and Gujarat <em>(3.6 percent)</em>. Please see chart-2.</p>
<p style="text-align:justify">The <a href="https://im4change.org/upload/files/State%20wise%20growth%20in%20average%20daily%20wage%20rates%20in%20real%20terms%20for%20male%20construction%20workers%20in%20rural%20India%281%29.JPG">average annual growth of construction workers&rsquo;</a> <a href="https://im4change.org/upload/files/State%20wise%20growth%20in%20average%20daily%20wage%20rates%20in%20real%20terms%20for%20male%20construction%20workers%20in%20rural%20India%281%29.JPG">wage rates in real terms</a> during the period from 2015-16 to 2020-21 was negative in Assam <em>(-1.2 percent)</em>, Haryana <em>(-2.1 percent)</em>, Jammu and Kashmir <em>(-2.7 percent)</em>, Karnataka <em>(-0.6 percent)</em>, Kerala <em>(-4.4 percent)</em>, Manipur <em>(-6.3 percent)</em>, Rajasthan <em>(-1.2 percent)</em>, Tamil Nadu <em>(-0.9 percent)</em>, and Tripura <em>(-1.1 percent)</em>. Please note that the <a href="https://im4change.org/upload/files/State-wise%20Average%20Inflation%20CPI%20-%20Inflation.PDF">rate of inflation</a> in <a href="https://im4change.org/upload/files/State-wise%20Average%20Inflation%20CPI%20-%20Inflation.PDF">CPI-General</a> has been used to get the average annual growth of construction workers&rsquo; wage rates in real terms. Kindly have a look at table-1. &nbsp;&nbsp;</p>
<p style="text-align:justify">In the case of Meghalaya, the <a href="https://im4change.org/upload/files/State%20wise%20average%20daily%20nominal%20wage%20rates%20in%20rural%20india%20men%20construction%20workers.JPG">nominal daily wage rate of male construction</a> <a href="https://im4change.org/upload/files/State%20wise%20average%20daily%20nominal%20wage%20rates%20in%20rural%20india%20men%20construction%20workers.JPG">workers</a> fell from Rs. 186.0 in 2016-17 to Rs. 100.0 in 2017-18 i.e., a decline&nbsp;by -46.2 percent over previous year. However, the same bounced back to Rs. 273.2 in 2018-19 i.e., an increase by 173.2 percent over previous year. In <a href="https://im4change.org/upload/files/State%20wise%20growth%20in%20average%20daily%20wage%20rates%20in%20real%20terms%20for%20male%20construction%20workers%20in%20rural%20India%281%29.JPG">real terms, the construction sector</a> <a href="https://im4change.org/upload/files/State%20wise%20growth%20in%20average%20daily%20wage%20rates%20in%20real%20terms%20for%20male%20construction%20workers%20in%20rural%20India%281%29.JPG">wage rate in Meghalaya</a> grew by -47.7 percent in 2017-18 <em>(over previous year)</em> and 171.0 percent in 2018-19 <em>(over previous year)</em>.</p>
<p style="text-align:justify">Some states experienced negative <a href="https://im4change.org/upload/files/State%20wise%20growth%20in%20average%20daily%20wage%20rates%20in%20real%20terms%20for%20male%20construction%20workers%20in%20rural%20India%281%29.JPG">growth in construction workers&rsquo;</a> <a href="https://im4change.org/upload/files/State%20wise%20growth%20in%20average%20daily%20wage%20rates%20in%20real%20terms%20for%20male%20construction%20workers%20in%20rural%20India%281%29.JPG">wage rates in real terms</a> for more than two years between 2015-16 and 2020-21. For example, <a href="https://im4change.org/upload/files/State%20wise%20growth%20in%20average%20daily%20wage%20rates%20in%20real%20terms%20for%20male%20construction%20workers%20in%20rural%20India%281%29.JPG">Assam</a> experienced negative growth in wage rates <em>(in real terms)</em> during 2017-18, 2018-19, 2019-20, and 2020-21. &nbsp;</p>
<p style="text-align:justify">At the national level, the&nbsp;<a href="https://im4change.org/upload/files/State%20wise%20growth%20in%20average%20daily%20wage%20rates%20in%20real%20terms%20for%20male%20construction%20workers%20in%20rural%20India%281%29.JPG">construction workers&rsquo; wage rates in real terms</a> on average grew by just 0.1 percent annually during the period from 2015-16 to 2020-21.</p>
<p style="text-align:justify">Kindly <a href="https://docs.google.com/spreadsheets/d/1avu0-WtaKV2RHXtz2eiP7iS8znGVBdKC/edit?usp=sharing&amp;ouid=112233925171588304692&amp;rtpof=true&amp;sd=true">click here</a> to access the spreadsheet in order to look at the <a href="/upload/files/State%20wise%20average%20daily%20nominal%20wage%20rates%20in%20rural%20india%20men%20construction%20workers.JPG">trends in nominal wage rates</a>, <a href="/upload/files/State%20wise%20growth%20in%20average%20daily%20nominal%20wage%20rates%20in%20rural%20india%20men%20construction%20workers.JPG">annual growth in nominal wage rates</a>, and <a href="/upload/files/State%20wise%20growth%20in%20average%20daily%20wage%20rates%20in%20real%20terms%20for%20male%20construction%20workers%20in%20rural%20India%281%29.JPG">annual growth in real wage rates</a> for construction workers in rural areas.&nbsp;</p>
<p style="text-align:justify"><strong>Data collection methodology</strong></p>
<p style="text-align:justify">As a part of Rural Labour Enquiry, the&nbsp;<a href="https://im4change.org/upload/files/ilj_feb_2013.pdf">daily wage rates</a> in respect of eighteen agricultural and non-agricultural occupations are being collected along with rural retail price data by the Field Operations Division of the National Sample Survey Organisation since 1986-87, according to a February 2013 <a href="https://im4change.org/upload/files/ilj_feb_2013.pdf">edition of the Indian Labour Journal</a>.&nbsp;On the recommendations of the Governing Council of the National Sample Survey Organisation in its 61st meeting,&nbsp;the <a href="https://im4change.org/upload/files/ilj_feb_2013.pdf">Labour Bureau</a> started the compilation and analysis of wage rate data with effect from April, 1998.&nbsp;</p>
<p style="text-align:justify">The Field Operations Division of the National Sample Survey Organisation has been entrusted with the work of <a href="https://im4change.org/upload/files/METHOLOGY%20FOR%20COMPILATION%20OF%20THE%20WAGE%20RATE%20DATA.pdf">data collection</a>. The <a href="https://im4change.org/upload/files/METHOLOGY%20FOR%20COMPILATION%20OF%20THE%20WAGE%20RATE%20DATA.pdf">wage rate data</a> are being collected along with rural retail prices from 600 sample villages spread over 66 NSS regions of 20 States by canvassing Block-5 <em>(Annexure-I)</em> of Schedule 3.01(R). The data collection from these sample villages is staggered over the four weeks of a month with one-fourth of them being covered every week. The days of canvassing of Schedule 3.01(R) are fixed. The village functionaries like the Panchayat Secretary, Progress Assistant, Patwari and other Village or Block Officials are the primary informants for collection of data on wage rates. The data on normal working hours and the prevailing wage rates in cash and kind for the reported working hours are collected sex-wise for each of the 18 selected occupations in 20 states, indicates an old&nbsp;<a href="https://im4change.org/upload/files/METHOLOGY%20FOR%20COMPILATION%20OF%20THE%20WAGE%20RATE%20DATA.pdf">document</a> of the Labour Bureau. &nbsp;&nbsp;</p>
<p style="text-align:justify">The wage rates are sometimes reported for a duration that is less/more than the normal working hours. In such cases, they are <a href="https://im4change.org/upload/files/METHOLOGY%20FOR%20COMPILATION%20OF%20THE%20WAGE%20RATE%20DATA.pdf">first normalised for eight hours</a> working day. As regards the mode of payment of wages, it is made in both ways i.e., in cash and/or in kind. The payments made in kind are very common in rural areas, which include foodgrains, cooked food, tea, fuel, cigarette, beedi, fodder, etc.&nbsp;The wages reported in kind are evaluated at local retail prices. Thereafter, the data is thoroughly scrutinised and discrepant points are referred back to the field for clarification. In the next stage, the simple arithmetic average of these normalised daily wage rates is worked out occupation-wise and sex-wise for each state.</p>
<p style="text-align:justify"><a href="http://ras.org.in/methodology_of_data_collection_unsuited_to_changing_rural_reality">Up to June 2000</a>, the average wage rates at the national level were derived by taking the simple average of state figures; since July 2000, the averages have been obtained by dividing the sum total of wages of all 20 states by the number of centres or villages from which data were collected. The state-wise averages are restricted only to those occupations where the number of centres is five or more to avoid abnormal fluctuations and inconsistency in wages paid to different categories of workers on account of varying numbers of centres. However, in order to calculate the all-India averages, all neglected centres are taken into account to arrive at the total number of centres at the national level.</p>
<p style="text-align:justify">The <a href="/upload/files/RBI%20note%20Average%20Daily%20Wage%20rate%20Methodology.pdf">Reserve Bank of India</a>&nbsp;<em>(whose data we have used in writing this news alert)</em> has collated and is releasing monthly time series data on rural wage rates based on the data published by the Labour Bureau, Government of India. Starting from November 2013 the Labour Bureau is collecting the rural wage data in respect of 12 agricultural and 13 non-agricultural occupations across 20 major states, namely, Andhra Pradesh, Assam, Bihar, Gujarat, Haryana, Himachal Pradesh, Jammu &amp; Kashmir, Karnataka, Kerala, Madhya Pradesh, Maharashtra, Manipur, Meghalaya, Orissa, Punjab, Rajasthan, Tamil Nadu, Tripura, Uttar Pradesh and West Bengal. The occupations for which the daily wage rates are collected every month are: <u>(A) Agricultural occupations</u> &ndash; (1) &nbsp;Ploughing/ Tilling workers, (2) Sowing <em>(including planting/ Transplanting/ Weeding)</em> workers, (3) Harvesting/ Winnowing/ Threshing workers, (4) Picking workers <em>(including Tea, Cotton, Tobacco and other commercial crops)</em>, (5) Horticulture workers <em>(including nursery growers)</em>, (6) Fishermen-inland, (7) Fishermen coastal/deep-sea, (8) Loggers and wood cutters, (9) Animal husbandry workers <em>(including poultry workers, dairy workers and herdsman)</em>, (10) Packaging labourers, agriculture, (11) General agricultural labourers <em>(including watering/ irrigation workers, etc.)</em>, (12) Plant protection workers <em>(applying pesticides, treating seeds, etc.)</em>; and <u>(B) Non-agricultural occupations</u> &ndash; (13) Carpenter, (14) Blacksmith, (15) Mason, (16) Weavers, (17) Beedi makers, (18) Bamboo, cane basket weavers, (19) Handicraft workers, (20) Plumbers, (21) Electrician, (22) Construction workers <em>(for roads, dams, industrial &amp; project construction work and Well diggers)</em>, (23) LMV &amp; Tractor drivers, (24) Non-agricultural labourers <em>(including porters, loaders)</em>, and (25) Sweeping/cleaning workers.&nbsp;</p>
<p style="text-align:justify"><strong><em>References&nbsp;</em></strong></p>
<p style="text-align:justify">Handbook of Statistics on Indian States 2020-21, released in November 2021, please <a href="https://m.rbi.org.in/scripts/AnnualPublications.aspx?head=Handbook%20of%20Statistics%20on%20Indian%20States">click here</a> to access</p>
<p style="text-align:justify">State-wise Average Daily Wage Rates in Rural India (Men - General Agricultural Labourers), RBI Handbook of Statistics on Indian States 2020-21, released in November 2021, please <a href="/upload/files/State-wise%20Average%20Daily%20Wage%20Rates%20in%20Rural%20India%20Men%20-%20General%20Agricultural%20Labourers.PDF">click here</a> to access&nbsp;</p>
<p style="text-align:justify">State-wise Average Daily Wage Rates in Rural India (Men - Non-Agricultural Labourers), RBI Handbook of Statistics on Indian States 2020-21, released in November 2021, please <a href="/upload/files/State-wise%20Average%20Daily%20Wage%20Rates%20in%20Rural%20India%20Men%20-%20Non%20Agricultural%20Labourers.PDF">click here</a> to access&nbsp;</p>
<p style="text-align:justify">State-wise Average Daily Wage Rates in Rural India (Men - Construction Workers), RBI Handbook of Statistics on Indian States 2020-21, released in November 2021, please <a href="/upload/files/State-wise%20Average%20Daily%20Wage%20Rates%20in%20Rural%20India%20Men%20-%20Construction%20Workers.PDF">click here</a> to access&nbsp;</p>
<p style="text-align:justify">State-wise Average Inflation (CPI) - Inflation, RBI Handbook of Statistics on Indian States 2020-21, released in November 2021, please <a href="/upload/files/State-wise%20Average%20Inflation%20CPI%20-%20Inflation.PDF">click here</a> to access&nbsp;</p>
<p style="text-align:justify">Indian Labour Journal, February 2013, please <a href="/upload/files/ilj_feb_2013.pdf">click here</a> to access &nbsp;</p>
<p style="text-align:justify">Wage Rates in Rural India 2003-04: Methodology for Compilation of the Wage Rate Data, Labour Bureau, please <a href="/upload/files/METHOLOGY%20FOR%20COMPILATION%20OF%20THE%20WAGE%20RATE%20DATA.pdf">click here</a> to access&nbsp; &nbsp;&nbsp;</p>
<p style="text-align:justify">Average Daily Wage Rates in Rural India: Methodology and coverage (From November 2013), Reserve Bank of India, please <a href="https://dbie.rbi.org.in">click here</a>&nbsp;and <a href="/upload/files/RBI%20note%20Average%20Daily%20Wage%20rate%20Methodology%281%29.pdf">here</a> to access&nbsp;</p>
<p style="text-align:justify">Consumer Price Index Numbers on Base 2012=100 for Rural, Urban and Combined for the month of January 2022, Ministry of Statistics and Programme Implementation (MoSPI), National Statistical Office (NSO), released on 14th February 2022, please <a href="/upload/files/CPI%20Press%20Release%20January%202022%281%29.pdf">click here</a> to access&nbsp;</p>
<p style="text-align:justify">Methodology of Data Collection Unsuited to Changing Rural Reality: A Study of Agricultural Wage Data in India -Yoshifumi Usami, Arindam Das, and Madhura Swaminathan, Review of Agrarian Studies, Vol. 10, No. 2, July-December, 2020, please <a href="http://ras.org.in/methodology_of_data_collection_unsuited_to_changing_rural_reality">click here</a> to access</p>
<p>Russia-ukraine crisis to push up fertiliser prices, govt subsidies, IANS/ Business Standard, 4 March, 2022, please <a href="https://www.business-standard.com/article/economy-policy/russia-ukraine-crisis-to-push-up-fertiliser-prices-govt-subsidies-122030400560_1.html">click here</a> to access &nbsp;</p>
<p>Cooking oil prices spike in India due to Russia-ukraine crisis -B Krishna Mohan, TelanganaToday.com, 3 March, 2022, please <a href="https://telanganatoday.com/cooking-oil-prices-spike-in-india-due-to-russia-ukraine-crisis">click here</a> to access &nbsp;</p>
<p>Govt reviews cooking oil imports as ukraine crisis disrupts supplies, prices shoot up -Amiti Sen and Prabhudutta Mishra, The Hindu Business Line, 4 March, 2022, please <a href="https://www.thehindubusinessline.com/markets/commodities/govt-reviews-cooking-oil-imports-as-ukraine-crisis-disrupts-supplies-prices-shoot-up/article65190879.ece">click here</a> to access &nbsp;</p>
<p>India&#39;s Economy Faces A Potential Stagflation Risk From Ukraine War -Sunil Prabhu, NDTV.com, 1 March, 2022, please <a href="https://www.ndtv.com/business/indias-economy-faces-a-potential-stagflation-risk-from-ukraine-war-2796624">click here</a> to access</p>
<p>India to be one of Asia&rsquo;s &lsquo;biggest losers&rsquo; from the Ukraine war as Russia slammed by global sanctions -Paran Balakrishnan, The Telegraph, 1 March, 2022, please <a href="https://www.telegraphindia.com/business/russia-ukraine-crisis-india-to-be-one-of-asias-biggest-losers-from-the-ukraine-war-as-russia-slammed-by-global-sanctions/cid/1854032">click here</a> to access</p>
<p>Crude Oil Prices Rise, Tracking Russia-Ukraine Conflict -Rahul Karunakar, NDTV.com <em>(with inputs from Agencies)</em>, 1 March, 2022, please <a href="https://www.ndtv.com/business/crude-oil-prices-rise-on-tuesday-tracking-russia-ukraine-conflict-2796187">click here</a> to access</p>
<p>Cooking Oil May Become Costlier Due to Russia-ukraine War. Know Why, News18.com, 27 February, 2022, please <a href="https://www.news18.com/news/business/markets/cooking-oil-may-become-costlier-due-to-russia-ukraine-war-know-why-4812740.html">click here</a> to access &nbsp;</p>
<p style="text-align:justify"><strong>Image Courtesy: Inclusive Media for Change/ Shambhu Ghatak</strong></p>
',
'credit_writer' => '',
'article_img' => 'Image construction worker 11 Mar 2022.jpg',
'article_img_thumb' => 'Image construction worker 11 Mar 2022.jpg',
'status' => (int) 1,
'show_on_home' => (int) 1,
'lang' => 'EN',
'category_id' => (int) 4,
'tag_keyword' => '',
'seo_url' => 'real-wage-rates-of-the-rural-workers-hardly-increased-during-the-past-6-years',
'meta_title' => '',
'meta_keywords' => '',
'meta_description' => '',
'noindex' => (int) 1,
'publish_date' => object(Cake\I18n\FrozenDate) {},
'most_visit_section_id' => null,
'article_big_img' => null,
'liveid' => null,
'created' => object(Cake\I18n\FrozenTime) {},
'modified' => object(Cake\I18n\FrozenTime) {},
'edate' => '',
'tags' => [
(int) 0 => object(Cake\ORM\Entity) {},
(int) 1 => object(Cake\ORM\Entity) {},
(int) 2 => object(Cake\ORM\Entity) {},
(int) 3 => object(Cake\ORM\Entity) {},
(int) 4 => object(Cake\ORM\Entity) {},
(int) 5 => object(Cake\ORM\Entity) {},
(int) 6 => object(Cake\ORM\Entity) {},
(int) 7 => object(Cake\ORM\Entity) {},
(int) 8 => object(Cake\ORM\Entity) {},
(int) 9 => object(Cake\ORM\Entity) {},
(int) 10 => object(Cake\ORM\Entity) {},
(int) 11 => object(Cake\ORM\Entity) {},
(int) 12 => object(Cake\ORM\Entity) {},
(int) 13 => object(Cake\ORM\Entity) {},
(int) 14 => object(Cake\ORM\Entity) {},
(int) 15 => object(Cake\ORM\Entity) {},
(int) 16 => object(Cake\ORM\Entity) {}
],
'category' => object(App\Model\Entity\Category) {},
'[new]' => false,
'[accessible]' => [
'*' => true,
'id' => false
],
'[dirty]' => [],
'[original]' => [],
'[virtual]' => [],
'[hasErrors]' => false,
'[errors]' => [],
'[invalid]' => [],
'[repository]' => 'Articles'
}
$articleid = (int) 62349
$metaTitle = 'NEWS ALERTS | Real wage rates of the rural workers hardly increased during the last 6 years'
$metaKeywords = 'Construction Workers,Consumer Price Index,CPI Rural,CPI Urban,Farm Labourers,Farm Workers,Food Inflation,Food Prices,Fuel Inflation,Fuel Prices,Nominal Wage Rate,Non-Farm Labourers,Non-Farm Workers,Real Wage Growth,Real Wages,Retail Inflation,Rural Workers'
$metaDesc = 'In the absence of income or expenditure-based headcount ratio, the growth in the real wages (i.e., nominal wages adjusted against retail inflation) of the manual workers is considered to be a good proxy to assess the trends in poverty. This...'
$disp = '<p style="text-align:justify">In the absence of income or expenditure-based headcount ratio, the growth in the real wages <em>(i.e., nominal wages adjusted against retail inflation)</em> of the manual workers is considered to be a good proxy to assess the trends in poverty. This is because the manual, unskilled/ semi-skilled labourers exist at the bottom of the pyramid or economic hierarchy, and most of them belong to the social categories Scheduled Castes (SCs) and Scheduled Tribes (STs). A positive growth in their real wages <em>(or real wage rates) </em>is anticipated to improve their purchasing power <em>(i.e., income or consumption expenditure)</em> and lift them out of the poverty trap. &nbsp;</p><p style="text-align:justify">Clearly, there exists inter-state differences in nominal wage rates, growth in nominal wage rates and growth in real wage rates, which we will see in this news alert.&nbsp;</p><p style="text-align:justify">Against the backdrop of the <a href="https://www.thehindubusinessline.com/markets/commodities/govt-reviews-cooking-oil-imports-as-ukraine-crisis-disrupts-supplies-prices-shoot-up/article65190879.ece" title="https://www.thehindubusinessline.com/markets/commodities/govt-reviews-cooking-oil-imports-as-ukraine-crisis-disrupts-supplies-prices-shoot-up/article65190879.ece">Russia-Ukraine conflict</a>, which is anticipated to cause both <a href="https://www.ndtv.com/business/indias-economy-faces-a-potential-stagflation-risk-from-ukraine-war-2796624" title="https://www.ndtv.com/business/indias-economy-faces-a-potential-stagflation-risk-from-ukraine-war-2796624">food and fuel retail inflation</a> in India in the coming times, it is even more important to look at the past trends in wage rate growth of the rural workers. It should be noted that the <a href="https://public.flourish.studio/visualisation/8706137" title="https://public.flourish.studio/visualisation/8706137">year-on-year inflation</a> in <a href="https://public.flourish.studio/visualisation/8706137" title="https://public.flourish.studio/visualisation/8706137">Consumer</a> <a href="https://public.flourish.studio/visualisation/8706137" title="https://public.flourish.studio/visualisation/8706137">Price Index Rural</a> exceeded the <a href="https://public.flourish.studio/visualisation/8706137" title="https://public.flourish.studio/visualisation/8706137">year-on-year inflation</a> in <a href="https://public.flourish.studio/visualisation/8706137" title="https://public.flourish.studio/visualisation/8706137">CPI Urban</a> during January 2022 at the national level. Even before the beginning of Russia-Ukraine conflict <em>(i.e., during January 2022)</em>, in rural areas, <a href="https://im4change.org/upload/files/CPI%20Press%20Release%20January%202022%281%29.pdf" title="https://im4change.org/upload/files/CPI%20Press%20Release%20January%202022%281%29.pdf">retail inflation rate of 20.6 percent</a> was noticed for &#39;oils and fats&#39;, aside from&nbsp;<a href="https://im4change.org/upload/files/CPI%20Press%20Release%20January%202022%281%29.pdf" title="https://im4change.org/upload/files/CPI%20Press%20Release%20January%202022%281%29.pdf">8.44 percent retail inflation for &#39;fuel and light&#39;</a>, <a href="https://im4change.org/upload/files/CPI%20Press%20Release%20January%202022%281%29.pdf" title="https://im4change.org/upload/files/CPI%20Press%20Release%20January%202022%281%29.pdf">8.27 percent</a> for &#39;transport and communication&#39;, and <a href="https://im4change.org/upload/files/CPI%20Press%20Release%20January%202022%281%29.pdf" title="https://im4change.org/upload/files/CPI%20Press%20Release%20January%202022%281%29.pdf">9.65 percent for &#39;clothing and footwear&#39;</a>.&nbsp; &nbsp;&nbsp;</p><p style="text-align:justify">At the national level, the average daily nominal wage rate&nbsp;for male construction workers in rural areas during the period from 2014-15 to 2020-21 was Rs. 316.9, which was greater than that of the male non-farm workers in rural areas. The average daily nominal wage rate&nbsp;for male non-agricultural labourers in rural areas during the period from 2014-15 to 2020-21 was Rs. 273.8, which exceeded the average daily nominal wage rates for male farm labourers in rural areas <em>(i.e., Rs. 265.1)</em>. However, in Andhra Pradesh, Haryana, Himachal Pradesh, Jammu and Kashmir,&nbsp;Karnataka, Kerala, Meghalaya, Punjab, and Tripura, the average daily nominal wage rates for male agricultural labourers in rural areas during the period from 2014-15 to 2020-21 exceeded the average daily nominal wage rates for male non-farm labourers in rural areas. Please see chart-1.</p><p style="text-align:justify"><img alt="" src="/upload/images/Chart%201.png" style="height:670px; width:1000px" /></p><p style="text-align:justify"><em><strong>Notes:</strong> The average (i.e., arithmetic mean) daily nominal wage rates for various categories of workers in rural India in the period from 2014-15 to 2020-21 has been calculated by the Inclusive Media for Change staff</em></p><p style="text-align:justify"><em>Please <a href="https://docs.google.com/spreadsheets/d/1avu0-WtaKV2RHXtz2eiP7iS8znGVBdKC/edit?usp=sharing&amp;ouid=112233925171588304692&amp;rtpof=true&amp;sd=true" title="https://docs.google.com/spreadsheets/d/1avu0-WtaKV2RHXtz2eiP7iS8znGVBdKC/edit?usp=sharing&amp;ouid=112233925171588304692&amp;rtpof=true&amp;sd=true">click here</a> to access the data in spreadsheet format</em></p><p style="text-align:justify"><em><strong>Source:&nbsp;</strong>Handbook of Statistics on Indian States 2020-21, released in November 2021, please <a href="https://m.rbi.org.in/scripts/AnnualPublications.aspx?head=Handbook%20of%20Statistics%20on%20Indian%20States" title="https://m.rbi.org.in/scripts/AnnualPublications.aspx?head=Handbook%20of%20Statistics%20on%20Indian%20States">click here</a> to access</em></p><p style="text-align:justify"><em>State-wise Average Daily Wage Rates in Rural India (Men - General Agricultural Labourers), RBI Handbook of Statistics on Indian States 2020-21, released in November 2021, please <a href="/upload/files/State-wise%20Average%20Daily%20Wage%20Rates%20in%20Rural%20India%20Men%20-%20General%20Agricultural%20Labourers.PDF" title="/upload/files/State-wise%20Average%20Daily%20Wage%20Rates%20in%20Rural%20India%20Men%20-%20General%20Agricultural%20Labourers.PDF">click here</a> to access&nbsp;</em></p><p style="text-align:justify"><em>State-wise Average Daily Wage Rates in Rural India (Men - Non-Agricultural Labourers), RBI Handbook of Statistics on Indian States 2020-21, released in November 2021, please <a href="/upload/files/State-wise%20Average%20Daily%20Wage%20Rates%20in%20Rural%20India%20Men%20-%20Non%20Agricultural%20Labourers.PDF" title="/upload/files/State-wise%20Average%20Daily%20Wage%20Rates%20in%20Rural%20India%20Men%20-%20Non%20Agricultural%20Labourers.PDF">click here</a> to access&nbsp;</em></p><p style="text-align:justify"><em>State-wise Average Daily Wage Rates in Rural India (Men - Construction Workers), RBI Handbook of Statistics on Indian States 2020-21, released in November 2021, please <a href="/upload/files/State-wise%20Average%20Daily%20Wage%20Rates%20in%20Rural%20India%20Men%20-%20Construction%20Workers.PDF" title="/upload/files/State-wise%20Average%20Daily%20Wage%20Rates%20in%20Rural%20India%20Men%20-%20Construction%20Workers.PDF">click here</a> to access&nbsp;</em></p><p style="text-align:justify"><em>State-wise Average Inflation (CPI) - Inflation, RBI Handbook of Statistics on Indian States 2020-21, released in November 2021, please <a href="/upload/files/State-wise%20Average%20Inflation%20CPI%20-%20Inflation.PDF" title="/upload/files/State-wise%20Average%20Inflation%20CPI%20-%20Inflation.PDF">click here</a> to access&nbsp;</em></p><p style="text-align:justify"><strong>---</strong></p><p style="text-align:justify">At the national level, the agricultural nominal wage rate&nbsp;grew faster than the non-farm wage&nbsp;rate&nbsp;on average for male labourers in rural areas during the period from 2015-16 to 2020-21. However, in states like Assam, Bihar, Haryana, Madhya Pradesh, Odisha, Punjab, and West Bengal, the non-farm nominal wage rates grew faster than the farm wage rates on average for male workers in rural areas during the period from 2015-16 to 2020-21. Please see chart-2.&nbsp;</p><p style="text-align:justify"><img alt="" src="/upload/images/Chart%202.png" style="height:653px; width:1000px" /></p><p style="text-align:justify"><em><strong>Notes: </strong>The average growth in daily nominal wage rates for various categories of workers in rural India in the period from 2015-16 to 2020-21 has been calculated by the Inclusive Media for Change staff</em></p><p style="text-align:justify"><em>Please <a href="https://docs.google.com/spreadsheets/d/1avu0-WtaKV2RHXtz2eiP7iS8znGVBdKC/edit?usp=sharing&amp;ouid=112233925171588304692&amp;rtpof=true&amp;sd=true" title="https://docs.google.com/spreadsheets/d/1avu0-WtaKV2RHXtz2eiP7iS8znGVBdKC/edit?usp=sharing&amp;ouid=112233925171588304692&amp;rtpof=true&amp;sd=true">click here</a> to access the data in spreadsheet format</em></p><p style="text-align:justify"><em><strong>Source: </strong>Same as above</em><br /><strong>---</strong></p><p style="text-align:justify">At the national level, the construction sector nominal wage rate&nbsp;grew slower than the non-agricultural wage&nbsp;rate&nbsp;on average for male labourers in rural areas during the period from 2015-16 to 2020-21. However, in states like Andhra Pradesh, Bihar, Himachal Pradesh, Maharashtra, Meghalaya, Punjab,&nbsp;Tamil Nadu, and Uttar Pradesh, the construction sector nominal wage rates grew faster than the non-farm wage rates on average for male workers in rural areas during the period from 2015-16 to 2020-21. Please take a look at chart-2. &nbsp;</p><p style="text-align:justify">At the national level, the agricultural wage rate&nbsp;in real terms grew faster than the non-farm wage rate&nbsp;on average for male labourers in rural areas during the period from 2015-16 to 2020-21. However, in states like Assam, Bihar, Haryana, Madhya Pradesh, Odisha, Punjab, and West Bengal, the non-farm wage rates in real terms grew faster than the farm wage rates on average for male workers in rural areas during the period from 2015-16 to 2020-21. Please see table-1.</p><p style="text-align:justify"><strong>Table 1: State-wise Growth in Average Daily Wage Rates in Real terms for Male Agricultural Labourers, Male Non-Agricultural Labourers, and Male Construction Workers in Rural India, in %</strong><br /><img alt="" src="/upload/images/Table%201%20State-wise%20Growth%20in%20Average%20Daily%20Wage%20Rates%20in%20Real%20terms%20for%20Male%20Agricultural%20Labourers%20Male%20Non-Agricultural%20Labourers%20and%20Male%20Construction%20Workers%20in%20Rural%20India%20in%20percent.png" style="height:539px; width:750px" /></p><p style="text-align:justify"><em><strong>Notes: </strong>The average growth in daily wage rates in real terms for various categories of workers in rural India in the period from 2015-16 to 2020-21 has been calculated by the Inclusive Media for Change staff</em></p><p style="text-align:justify"><em>Please <a href="https://docs.google.com/spreadsheets/d/1avu0-WtaKV2RHXtz2eiP7iS8znGVBdKC/edit?usp=sharing&amp;ouid=112233925171588304692&amp;rtpof=true&amp;sd=true" title="https://docs.google.com/spreadsheets/d/1avu0-WtaKV2RHXtz2eiP7iS8znGVBdKC/edit?usp=sharing&amp;ouid=112233925171588304692&amp;rtpof=true&amp;sd=true">click here</a> to access the data in spreadsheet format</em></p><p style="text-align:justify"><em><strong>Source: </strong>Same as above</em><br /><strong>---</strong></p><p style="text-align:justify">At the national level, the construction sector wage rate&nbsp;in real terms grew slower than the non-agricultural wage rate&nbsp;on average for male labourers in rural areas during the period from 2015-16 to 2020-21. However, in states like Andhra Pradesh, Bihar, Himachal Pradesh, Maharashtra, Meghalaya, Punjab, Tamil Nadu, and Uttar Pradesh, the construction sector wage rates in real terms grew faster than the non-farm wage rates on average for male workers in rural areas during the period from 2015-16 to 2020-21. Please take a look at table-1. &nbsp;</p><p style="text-align:justify">In the following paragraphs, we have discussed the trends in agricultural wage rates, non-farm wage rates, and construction sector wage rates <em>(in rural areas)</em> in detail.&nbsp;</p><p style="text-align:justify"><strong>Agricultural wages in rural areas</strong></p><p style="text-align:justify">The highest <a href="https://im4change.org/upload/files/State%20wise%20average%20daily%20nominal%20wage%20rates%20in%20rural%20india%20men%20farm%20labourers.JPG" title="https://im4change.org/upload/files/State%20wise%20average%20daily%20nominal%20wage%20rates%20in%20rural%20india%20men%20farm%20labourers.JPG">average daily nominal wage rate</a> <a href="https://im4change.org/upload/files/State%20wise%20average%20daily%20nominal%20wage%20rates%20in%20rural%20india%20men%20farm%20labourers.JPG" title="https://im4change.org/upload/files/State%20wise%20average%20daily%20nominal%20wage%20rates%20in%20rural%20india%20men%20farm%20labourers.JPG">for male agricultural labourers</a> in rural India during the period from 2014-15 to 2020-21 was found in Kerala <em>(Rs. 653.93)</em>, followed by Jammu and Kashmir <em>(Rs. 429.19)</em>, Tamil Nadu <em>(Rs. 385.6)</em>, Haryana <em>(Rs. 368.53)</em>, Himachal Pradesh <em>(Rs. 366.23)</em>, and Punjab <em>(Rs. 325.31)</em>. Please have a look at chart-1.</p><p style="text-align:justify">The lowest <a href="https://im4change.org/upload/files/State%20wise%20average%20daily%20nominal%20wage%20rates%20in%20rural%20india%20men%20farm%20labourers.JPG" title="https://im4change.org/upload/files/State%20wise%20average%20daily%20nominal%20wage%20rates%20in%20rural%20india%20men%20farm%20labourers.JPG">average daily nominal wage rate</a> <a href="https://im4change.org/upload/files/State%20wise%20average%20daily%20nominal%20wage%20rates%20in%20rural%20india%20men%20farm%20labourers.JPG" title="https://im4change.org/upload/files/State%20wise%20average%20daily%20nominal%20wage%20rates%20in%20rural%20india%20men%20farm%20labourers.JPG">for male agricultural labourers</a> in rural India during the period from 2014-15 to 2020-21 was observed in Madhya Pradesh <em>(Rs. 183.97)</em>, followed by Gujarat <em>(Rs. 190.07)</em>, Maharashtra <em>(Rs. 215.71)</em>, Odisha <em>(Rs. 216.87)</em>, Meghalaya <em>(Rs. 219.93)</em>, Bihar <em>(Rs. 230.43)</em>, Uttar Pradesh <em>(Rs. 230.5)</em>, and Assam <em>(Rs. 237.3)</em>. The related national level figure was Rs. 265.09 during the period from 2014-15 to 2020-21. Please consult chart-1.&nbsp;</p><p style="text-align:justify">The highest <a href="https://im4change.org/upload/files/State%20wise%20growth%20in%20average%20daily%20nominal%20wage%20rates%20in%20rural%20india%20men%20farm%20labourers.JPG" title="https://im4change.org/upload/files/State%20wise%20growth%20in%20average%20daily%20nominal%20wage%20rates%20in%20rural%20india%20men%20farm%20labourers.JPG">average annual growth rate in</a> <a href="https://im4change.org/upload/files/State%20wise%20growth%20in%20average%20daily%20nominal%20wage%20rates%20in%20rural%20india%20men%20farm%20labourers.JPG" title="https://im4change.org/upload/files/State%20wise%20growth%20in%20average%20daily%20nominal%20wage%20rates%20in%20rural%20india%20men%20farm%20labourers.JPG">nominal wage rates</a> during the period from 2015-16 to 2020-21 was found in Karnataka <em>(7.3 percent)</em>, followed by Andhra Pradesh <em>(6.8 percent)</em>, Madhya Pradesh <em>(6.4 percent)</em>, Uttar Pradesh <em>(6.2 percent)</em>, Odisha <em>(6.1 percent)</em>, and Meghalaya <em>(6.0 percent)</em>. Please see chart-2.</p><p style="text-align:justify">The lowest <a href="https://im4change.org/upload/files/State%20wise%20growth%20in%20average%20daily%20nominal%20wage%20rates%20in%20rural%20india%20men%20farm%20labourers.JPG" title="https://im4change.org/upload/files/State%20wise%20growth%20in%20average%20daily%20nominal%20wage%20rates%20in%20rural%20india%20men%20farm%20labourers.JPG">average annual growth rate</a> <a href="https://im4change.org/upload/files/State%20wise%20growth%20in%20average%20daily%20nominal%20wage%20rates%20in%20rural%20india%20men%20farm%20labourers.JPG" title="https://im4change.org/upload/files/State%20wise%20growth%20in%20average%20daily%20nominal%20wage%20rates%20in%20rural%20india%20men%20farm%20labourers.JPG">in nominal wage rates</a> during the same period was noticed in Haryana <em>(2.1 percent)</em>, followed by Rajasthan <em>(3.3 percent)</em>, Kerala <em>(3.5 percent)</em>, Punjab <em>(3.9 percent)</em>, and Tamil Nadu <em>(4.5 percent)</em>. Please consult chart-2.</p><p style="text-align:justify">The average annual <a href="https://im4change.org/upload/files/State%20wise%20growth%20in%20average%20daily%20wage%20rates%20in%20real%20terms%20for%20male%20farm%20labourers%20in%20rural%20India.JPG" title="https://im4change.org/upload/files/State%20wise%20growth%20in%20average%20daily%20wage%20rates%20in%20real%20terms%20for%20male%20farm%20labourers%20in%20rural%20India.JPG">growth of agricultural labourers&rsquo;</a> <a href="https://im4change.org/upload/files/State%20wise%20growth%20in%20average%20daily%20wage%20rates%20in%20real%20terms%20for%20male%20farm%20labourers%20in%20rural%20India.JPG" title="https://im4change.org/upload/files/State%20wise%20growth%20in%20average%20daily%20wage%20rates%20in%20real%20terms%20for%20male%20farm%20labourers%20in%20rural%20India.JPG">wage rates in real terms</a> during the period from 2015-16 to 2020-21 were negative in Haryana <em>(-2.1 percent)</em>, Jammu and Kashmir <em>(-0.3 percent)</em>, Kerala <em>(-1.7 percent)</em>, Punjab <em>(-0.4 percent)</em>, Rajasthan <em>(-1.1 percent)</em>, Tamil Nadu <em>(-0.8 percent)</em>, Tripura <em>(-0.5 percent)</em>, and West Bengal <em>(-0.1 percent)</em>. It should be noted that the <a href="https://im4change.org/upload/files/State-wise%20Average%20Inflation%20CPI%20-%20Inflation.PDF" title="https://im4change.org/upload/files/State-wise%20Average%20Inflation%20CPI%20-%20Inflation.PDF">rate of inflation</a> in <a href="https://im4change.org/upload/files/State-wise%20Average%20Inflation%20CPI%20-%20Inflation.PDF" title="https://im4change.org/upload/files/State-wise%20Average%20Inflation%20CPI%20-%20Inflation.PDF">Consumer Price Index-General</a> has been used to get the average annual growth of agricultural labourers&rsquo; wage rates in real terms. Kindly consult table-1. &nbsp;</p><p style="text-align:justify">Some states witnessed negative <a href="https://im4change.org/upload/files/State%20wise%20growth%20in%20average%20daily%20wage%20rates%20in%20real%20terms%20for%20male%20farm%20labourers%20in%20rural%20India.JPG" title="https://im4change.org/upload/files/State%20wise%20growth%20in%20average%20daily%20wage%20rates%20in%20real%20terms%20for%20male%20farm%20labourers%20in%20rural%20India.JPG">growth in agricultural labourers&rsquo;</a> <a href="https://im4change.org/upload/files/State%20wise%20growth%20in%20average%20daily%20wage%20rates%20in%20real%20terms%20for%20male%20farm%20labourers%20in%20rural%20India.JPG" title="https://im4change.org/upload/files/State%20wise%20growth%20in%20average%20daily%20wage%20rates%20in%20real%20terms%20for%20male%20farm%20labourers%20in%20rural%20India.JPG">wage rates in real terms</a> for more than two years between 2015-16 and 2020-21. For example, <a href="https://im4change.org/upload/files/State%20wise%20growth%20in%20average%20daily%20wage%20rates%20in%20real%20terms%20for%20male%20farm%20labourers%20in%20rural%20India.JPG" title="https://im4change.org/upload/files/State%20wise%20growth%20in%20average%20daily%20wage%20rates%20in%20real%20terms%20for%20male%20farm%20labourers%20in%20rural%20India.JPG">Haryana</a> experienced negative growth in 2015-16, 2016-17, 2017-18, 2019-20, and 2020-21. Likewise, <a href="https://im4change.org/upload/files/State%20wise%20growth%20in%20average%20daily%20wage%20rates%20in%20real%20terms%20for%20male%20farm%20labourers%20in%20rural%20India.JPG" title="https://im4change.org/upload/files/State%20wise%20growth%20in%20average%20daily%20wage%20rates%20in%20real%20terms%20for%20male%20farm%20labourers%20in%20rural%20India.JPG">Kerala</a> faced negative growth in 2017-18, 2018-19, 2019-20, and 2020-21. &nbsp;</p><p style="text-align:justify">At the national level, the <a href="https://im4change.org/upload/files/State%20wise%20growth%20in%20average%20daily%20wage%20rates%20in%20real%20terms%20for%20male%20farm%20labourers%20in%20rural%20India.JPG" title="https://im4change.org/upload/files/State%20wise%20growth%20in%20average%20daily%20wage%20rates%20in%20real%20terms%20for%20male%20farm%20labourers%20in%20rural%20India.JPG">agricultural labourers&rsquo;</a> <a href="https://im4change.org/upload/files/State%20wise%20growth%20in%20average%20daily%20wage%20rates%20in%20real%20terms%20for%20male%20farm%20labourers%20in%20rural%20India.JPG" title="https://im4change.org/upload/files/State%20wise%20growth%20in%20average%20daily%20wage%20rates%20in%20real%20terms%20for%20male%20farm%20labourers%20in%20rural%20India.JPG">wage rates in real terms</a> on average grew by 1.0 percent annually during the period from 2015-16 to 2020-21.</p><p style="text-align:justify">Please <a href="https://docs.google.com/spreadsheets/d/1avu0-WtaKV2RHXtz2eiP7iS8znGVBdKC/edit?usp=sharing&amp;ouid=112233925171588304692&amp;rtpof=true&amp;sd=true" title="https://docs.google.com/spreadsheets/d/1avu0-WtaKV2RHXtz2eiP7iS8znGVBdKC/edit?usp=sharing&amp;ouid=112233925171588304692&amp;rtpof=true&amp;sd=true">click here</a> to access the spreadsheet in order to look at the trends in <a href="/upload/files/State%20wise%20average%20daily%20nominal%20wage%20rates%20in%20rural%20india%20men%20farm%20labourers.JPG" title="/upload/files/State%20wise%20average%20daily%20nominal%20wage%20rates%20in%20rural%20india%20men%20farm%20labourers.JPG">nominal wage rates</a>, <a href="/upload/files/State%20wise%20growth%20in%20average%20daily%20nominal%20wage%20rates%20in%20rural%20india%20men%20farm%20labourers.JPG" title="/upload/files/State%20wise%20growth%20in%20average%20daily%20nominal%20wage%20rates%20in%20rural%20india%20men%20farm%20labourers.JPG">annual growth in nominal wage rates</a> and <a href="/upload/files/State%20wise%20growth%20in%20average%20daily%20wage%20rates%20in%20real%20terms%20for%20male%20farm%20labourers%20in%20rural%20India.JPG" title="/upload/files/State%20wise%20growth%20in%20average%20daily%20wage%20rates%20in%20real%20terms%20for%20male%20farm%20labourers%20in%20rural%20India.JPG">annual growth in real wage rates</a> for farm labourers in rural areas.&nbsp;</p><p style="text-align:justify"><strong>Non-agricultural wages in rural areas</strong></p><p style="text-align:justify">The rural economy is not just about farming any longer. That is why we have looked at the wage growth in the non-farm sector too.&nbsp;The highest <a href="https://im4change.org/upload/files/State%20wise%20average%20daily%20nominal%20wage%20rates%20in%20rural%20india%20men%20non%20farm%20labourers.JPG" title="https://im4change.org/upload/files/State%20wise%20average%20daily%20nominal%20wage%20rates%20in%20rural%20india%20men%20non%20farm%20labourers.JPG">average daily nominal wage rate for male</a> <a href="https://im4change.org/upload/files/State%20wise%20average%20daily%20nominal%20wage%20rates%20in%20rural%20india%20men%20non%20farm%20labourers.JPG" title="https://im4change.org/upload/files/State%20wise%20average%20daily%20nominal%20wage%20rates%20in%20rural%20india%20men%20non%20farm%20labourers.JPG">non-agricultural labourers</a> in rural India during the period from 2014-15 to 2020-21 was detected in Kerala <em>(Rs. 639.01)</em>, followed by Jammu and Kashmir <em>(Rs. 426.37)</em>, Tamil Nadu <em>(Rs. 405.77)</em>, Haryana <em>(Rs. 359.24)</em>, Himachal Pradesh <em>(Rs. 311.10)</em>, and Punjab <em>(Rs. 309.09)</em>. Please see chart-1.</p><p style="text-align:justify">The lowest average <a href="https://im4change.org/upload/files/State%20wise%20average%20daily%20nominal%20wage%20rates%20in%20rural%20india%20men%20non%20farm%20labourers.JPG" title="https://im4change.org/upload/files/State%20wise%20average%20daily%20nominal%20wage%20rates%20in%20rural%20india%20men%20non%20farm%20labourers.JPG">daily nominal wage rate for male</a> <a href="https://im4change.org/upload/files/State%20wise%20average%20daily%20nominal%20wage%20rates%20in%20rural%20india%20men%20non%20farm%20labourers.JPG" title="https://im4change.org/upload/files/State%20wise%20average%20daily%20nominal%20wage%20rates%20in%20rural%20india%20men%20non%20farm%20labourers.JPG">non-agricultural labourers in rural India</a> during the period from 2014-15 to 2020-21 was found in Madhya Pradesh <em>(Rs. 191.47)</em>, followed by Meghalaya <em>(Rs. 210.26)</em>, Gujarat <em>(Rs. 213.51)</em>, Odisha <em>(Rs. 218.06)</em>, Maharashtra <em>(Rs. 226.70)</em>, Tripura <em>(Rs. 230.36)</em>, Bihar <em>(Rs. 243.51)</em>, and Uttar Pradesh <em>(Rs. 243.97)</em>. The related national level figure was Rs. 273.79 during the period from 2014-15 to 2020-21. Please see chart-1.</p><p style="text-align:justify">The highest <a href="https://im4change.org/upload/files/State%20wise%20growth%20in%20average%20daily%20nominal%20wage%20rates%20in%20rural%20india%20men%20non%20farm%20labourers.JPG" title="https://im4change.org/upload/files/State%20wise%20growth%20in%20average%20daily%20nominal%20wage%20rates%20in%20rural%20india%20men%20non%20farm%20labourers.JPG">average annual growth rate in</a> <a href="https://im4change.org/upload/files/State%20wise%20growth%20in%20average%20daily%20nominal%20wage%20rates%20in%20rural%20india%20men%20non%20farm%20labourers.JPG" title="https://im4change.org/upload/files/State%20wise%20growth%20in%20average%20daily%20nominal%20wage%20rates%20in%20rural%20india%20men%20non%20farm%20labourers.JPG">nominal wage rates</a> during the period from 2015-16 to 2020-21 was noticed in Odisha <em>(8.0 percent)</em>, followed by Madhya Pradesh <em>(7.6 percent)</em>, Assam <em>(6.6 percent)</em>, West Bengal <em>(5.9 percent)</em>, Uttar Pradesh and Andhra Pradesh <em>(5.6 percent each)</em>, and Bihar <em>(5.5 percent)</em>. Kindly consult chart-2.</p><p style="text-align:justify">The lowest <a href="https://im4change.org/upload/files/State%20wise%20growth%20in%20average%20daily%20nominal%20wage%20rates%20in%20rural%20india%20men%20non%20farm%20labourers.JPG" title="https://im4change.org/upload/files/State%20wise%20growth%20in%20average%20daily%20nominal%20wage%20rates%20in%20rural%20india%20men%20non%20farm%20labourers.JPG">average annual growth rate</a> <a href="https://im4change.org/upload/files/State%20wise%20growth%20in%20average%20daily%20nominal%20wage%20rates%20in%20rural%20india%20men%20non%20farm%20labourers.JPG" title="https://im4change.org/upload/files/State%20wise%20growth%20in%20average%20daily%20nominal%20wage%20rates%20in%20rural%20india%20men%20non%20farm%20labourers.JPG">in nominal wage rates</a> during the same period was observed in Kerala <em>(1.8 percent)</em>, followed by Haryana <em>(2.4 percent)</em>, Meghalaya <em>(2.8 percent)</em>, Tamil Nadu and Rajasthan <em>(3.2 percent each)</em>, Tripura and Jammu and Kashmir <em>(4.0 percent each),</em> and Maharashtra and Punjab <em>(4.2 percent each)</em>. Kindly consult chart-2.&nbsp;</p><p style="text-align:justify">The average annual <a href="https://im4change.org/upload/files/State%20wise%20growth%20in%20average%20daily%20wage%20rates%20in%20real%20terms%20for%20male%20non%20farm%20labourers%20in%20rural%20India.JPG" title="https://im4change.org/upload/files/State%20wise%20growth%20in%20average%20daily%20wage%20rates%20in%20real%20terms%20for%20male%20non%20farm%20labourers%20in%20rural%20India.JPG">growth of non-agricultural labourers&rsquo;</a> <a href="https://im4change.org/upload/files/State%20wise%20growth%20in%20average%20daily%20wage%20rates%20in%20real%20terms%20for%20male%20non%20farm%20labourers%20in%20rural%20India.JPG" title="https://im4change.org/upload/files/State%20wise%20growth%20in%20average%20daily%20wage%20rates%20in%20real%20terms%20for%20male%20non%20farm%20labourers%20in%20rural%20India.JPG">wage rates in real terms</a> during the period from 2015-16 to 2020-21 were negative in Haryana <em>(-1.9 percent)</em>, Jammu and Kashmir <em>(-1.7 percent)</em>, Kerala <em>(-3.5 percent)</em>, Maharashtra <em>(-0.3 percent)</em>, Meghalaya <em>(-1.2 percent)</em>, Punjab <em>(-0.1 percent)</em>, Rajasthan <em>(-1.2 percent)</em>, Tamil Nadu <em>(-2.1 percent)</em>, and Tripura <em>(-1.1 percent)</em>. It should be noted that the <a href="https://im4change.org/upload/files/State-wise%20Average%20Inflation%20CPI%20-%20Inflation.PDF" title="https://im4change.org/upload/files/State-wise%20Average%20Inflation%20CPI%20-%20Inflation.PDF">rate of inflation</a> in <a href="https://im4change.org/upload/files/State-wise%20Average%20Inflation%20CPI%20-%20Inflation.PDF" title="https://im4change.org/upload/files/State-wise%20Average%20Inflation%20CPI%20-%20Inflation.PDF">CPI-General</a> has been used to get the average annual growth of non-agricultural labourers&rsquo; wage rates in real terms. Kindly have a look at table-1. &nbsp;&nbsp;</p><p style="text-align:justify">Some states experienced negative growth in <a href="https://im4change.org/upload/files/State%20wise%20growth%20in%20average%20daily%20wage%20rates%20in%20real%20terms%20for%20male%20non%20farm%20labourers%20in%20rural%20India.JPG" title="https://im4change.org/upload/files/State%20wise%20growth%20in%20average%20daily%20wage%20rates%20in%20real%20terms%20for%20male%20non%20farm%20labourers%20in%20rural%20India.JPG">non-agricultural labourers&rsquo; wage</a> <a href="https://im4change.org/upload/files/State%20wise%20growth%20in%20average%20daily%20wage%20rates%20in%20real%20terms%20for%20male%20non%20farm%20labourers%20in%20rural%20India.JPG" title="https://im4change.org/upload/files/State%20wise%20growth%20in%20average%20daily%20wage%20rates%20in%20real%20terms%20for%20male%20non%20farm%20labourers%20in%20rural%20India.JPG">rates in real terms</a> for more than two years between 2015-16 and 2020-21. For example, <a href="https://im4change.org/upload/files/State%20wise%20growth%20in%20average%20daily%20wage%20rates%20in%20real%20terms%20for%20male%20non%20farm%20labourers%20in%20rural%20India.JPG" title="https://im4change.org/upload/files/State%20wise%20growth%20in%20average%20daily%20wage%20rates%20in%20real%20terms%20for%20male%20non%20farm%20labourers%20in%20rural%20India.JPG">Haryana</a> experienced negative <a href="https://im4change.org/upload/files/State%20wise%20growth%20in%20average%20daily%20wage%20rates%20in%20real%20terms%20for%20male%20non%20farm%20labourers%20in%20rural%20India.JPG" title="https://im4change.org/upload/files/State%20wise%20growth%20in%20average%20daily%20wage%20rates%20in%20real%20terms%20for%20male%20non%20farm%20labourers%20in%20rural%20India.JPG">growth in wage rates</a> <a href="https://im4change.org/upload/files/State%20wise%20growth%20in%20average%20daily%20wage%20rates%20in%20real%20terms%20for%20male%20non%20farm%20labourers%20in%20rural%20India.JPG" title="https://im4change.org/upload/files/State%20wise%20growth%20in%20average%20daily%20wage%20rates%20in%20real%20terms%20for%20male%20non%20farm%20labourers%20in%20rural%20India.JPG">(in real terms)</a> during 2016-17, 2017-18, 2018-19, 2019-20, and 2020-21. Likewise, <a href="https://im4change.org/upload/files/State%20wise%20growth%20in%20average%20daily%20wage%20rates%20in%20real%20terms%20for%20male%20non%20farm%20labourers%20in%20rural%20India.JPG" title="https://im4change.org/upload/files/State%20wise%20growth%20in%20average%20daily%20wage%20rates%20in%20real%20terms%20for%20male%20non%20farm%20labourers%20in%20rural%20India.JPG">Kerala</a> faced negative growth rates in 2015-16, 2016-17, 2017-18, 2019-20, and 2020-21. &nbsp;</p><p style="text-align:justify">At the national level, the&nbsp;<a href="https://im4change.org/upload/files/State%20wise%20growth%20in%20average%20daily%20wage%20rates%20in%20real%20terms%20for%20male%20non%20farm%20labourers%20in%20rural%20India.JPG" title="https://im4change.org/upload/files/State%20wise%20growth%20in%20average%20daily%20wage%20rates%20in%20real%20terms%20for%20male%20non%20farm%20labourers%20in%20rural%20India.JPG">non-agricultural labourers&rsquo;</a> <a href="https://im4change.org/upload/files/State%20wise%20growth%20in%20average%20daily%20wage%20rates%20in%20real%20terms%20for%20male%20non%20farm%20labourers%20in%20rural%20India.JPG" title="https://im4change.org/upload/files/State%20wise%20growth%20in%20average%20daily%20wage%20rates%20in%20real%20terms%20for%20male%20non%20farm%20labourers%20in%20rural%20India.JPG">wage rates in real terms</a> on average grew by just 0.3 percent annually during the period from 2015-16 to 2020-21.&nbsp;</p><p style="text-align:justify">Please <a href="https://docs.google.com/spreadsheets/d/1avu0-WtaKV2RHXtz2eiP7iS8znGVBdKC/edit?usp=sharing&amp;ouid=112233925171588304692&amp;rtpof=true&amp;sd=true" title="https://docs.google.com/spreadsheets/d/1avu0-WtaKV2RHXtz2eiP7iS8znGVBdKC/edit?usp=sharing&amp;ouid=112233925171588304692&amp;rtpof=true&amp;sd=true">click here</a> to access the spreadsheet in order to look at the <a href="/upload/files/State%20wise%20average%20daily%20nominal%20wage%20rates%20in%20rural%20india%20men%20non%20farm%20labourers.JPG" title="/upload/files/State%20wise%20average%20daily%20nominal%20wage%20rates%20in%20rural%20india%20men%20non%20farm%20labourers.JPG">trends in nominal wage rates</a>, <a href="/upload/files/State%20wise%20growth%20in%20average%20daily%20nominal%20wage%20rates%20in%20rural%20india%20men%20non%20farm%20labourers.JPG" title="/upload/files/State%20wise%20growth%20in%20average%20daily%20nominal%20wage%20rates%20in%20rural%20india%20men%20non%20farm%20labourers.JPG">annual growth in nominal wage rates</a>, and <a href="/upload/files/State%20wise%20growth%20in%20average%20daily%20wage%20rates%20in%20real%20terms%20for%20male%20non%20farm%20labourers%20in%20rural%20India.JPG" title="/upload/files/State%20wise%20growth%20in%20average%20daily%20wage%20rates%20in%20real%20terms%20for%20male%20non%20farm%20labourers%20in%20rural%20India.JPG">annual growth in real wage rates</a> for non-farm labourers in rural areas.&nbsp;</p><p style="text-align:justify"><strong>Construction sector wages in rural areas</strong></p><p style="text-align:justify">The <a href="https://im4change.org/upload/files/State%20wise%20average%20daily%20nominal%20wage%20rates%20in%20rural%20india%20men%20construction%20workers.JPG" title="https://im4change.org/upload/files/State%20wise%20average%20daily%20nominal%20wage%20rates%20in%20rural%20india%20men%20construction%20workers.JPG">highest average daily nominal wage rates</a> <a href="https://im4change.org/upload/files/State%20wise%20average%20daily%20nominal%20wage%20rates%20in%20rural%20india%20men%20construction%20workers.JPG" title="https://im4change.org/upload/files/State%20wise%20average%20daily%20nominal%20wage%20rates%20in%20rural%20india%20men%20construction%20workers.JPG">for male construction workers in rural India</a> during the period from 2014-15 to 2020-21 was detected in Kerala <em>(Rs. 810.3)</em>, followed by Jammu and Kashmir <em>(Rs. 445.1)</em>, Tamil Nadu <em>(Rs. 424.1)</em>, Haryana <em>(Rs. 379.9)</em>, Himachal Pradesh <em>(Rs. 368.7)</em>, Rajasthan <em>(Rs. 347.7)</em>, and Punjab <em>(Rs. 339.1)</em>. Kindly see chart-1.&nbsp;</p><p style="text-align:justify">The <a href="https://im4change.org/upload/files/State%20wise%20average%20daily%20nominal%20wage%20rates%20in%20rural%20india%20men%20construction%20workers.JPG" title="https://im4change.org/upload/files/State%20wise%20average%20daily%20nominal%20wage%20rates%20in%20rural%20india%20men%20construction%20workers.JPG">lowest average daily nominal wage rates</a> <a href="https://im4change.org/upload/files/State%20wise%20average%20daily%20nominal%20wage%20rates%20in%20rural%20india%20men%20construction%20workers.JPG" title="https://im4change.org/upload/files/State%20wise%20average%20daily%20nominal%20wage%20rates%20in%20rural%20india%20men%20construction%20workers.JPG">for male construction workers in rural areas</a> during the period from 2014-15 to 2020-21 was found in Madhya Pradesh <em>(Rs. 212.4)</em>, followed by Tripura <em>(Rs. 230.4)</em>, Meghalaya <em>(Rs. 231.7)</em>, Odisha <em>(Rs. 247.1)</em>, Gujarat <em>(Rs. 251.8)</em>, Uttar Pradesh <em>(Rs. 267.4)</em>, Bihar <em>(Rs. 270.8)</em>, and West Bengal <em>(Rs. 274.0)</em>. The related national level figure was Rs. 316.9 during the period from 2014-15 to 2020-21. Kindly consult chart-1.</p><p style="text-align:justify">The <a href="https://im4change.org/upload/files/State%20wise%20growth%20in%20average%20daily%20nominal%20wage%20rates%20in%20rural%20india%20men%20construction%20workers.JPG" title="https://im4change.org/upload/files/State%20wise%20growth%20in%20average%20daily%20nominal%20wage%20rates%20in%20rural%20india%20men%20construction%20workers.JPG">highest average annual growth rates in</a> <a href="https://im4change.org/upload/files/State%20wise%20growth%20in%20average%20daily%20nominal%20wage%20rates%20in%20rural%20india%20men%20construction%20workers.JPG" title="https://im4change.org/upload/files/State%20wise%20growth%20in%20average%20daily%20nominal%20wage%20rates%20in%20rural%20india%20men%20construction%20workers.JPG">nominal wage rates</a> during the period from 2015-16 to 2020-21 was noticed in Meghalaya <em>(20.9 percent)</em>, followed by Madhya Pradesh <em>(7.4 percent)</em>, Odisha and Andhra Pradesh <em>(6.8 percent each)</em>, Uttar Pradesh <em>(6.4 percent)</em>, and Bihar <em>(6.2 percent)</em>. Please see chart-2.&nbsp;</p><p style="text-align:justify">The <a href="https://im4change.org/upload/files/State%20wise%20growth%20in%20average%20daily%20nominal%20wage%20rates%20in%20rural%20india%20men%20construction%20workers.JPG" title="https://im4change.org/upload/files/State%20wise%20growth%20in%20average%20daily%20nominal%20wage%20rates%20in%20rural%20india%20men%20construction%20workers.JPG">lowest average annual growth rates in</a> <a href="https://im4change.org/upload/files/State%20wise%20growth%20in%20average%20daily%20nominal%20wage%20rates%20in%20rural%20india%20men%20construction%20workers.JPG" title="https://im4change.org/upload/files/State%20wise%20growth%20in%20average%20daily%20nominal%20wage%20rates%20in%20rural%20india%20men%20construction%20workers.JPG">nominal wage rates</a> during the same period was observed in Kerala <em>(0.9 percent)</em>, followed by Manipur <em>(2.0 percent)</em>, Haryana <em>(2.1 percent)</em>, Jammu and Kashmir <em>(3.0 percent)</em>, Rajasthan <em>(3.2 percent)</em>, and Gujarat <em>(3.6 percent)</em>. Please see chart-2.</p><p style="text-align:justify">The <a href="https://im4change.org/upload/files/State%20wise%20growth%20in%20average%20daily%20wage%20rates%20in%20real%20terms%20for%20male%20construction%20workers%20in%20rural%20India%281%29.JPG" title="https://im4change.org/upload/files/State%20wise%20growth%20in%20average%20daily%20wage%20rates%20in%20real%20terms%20for%20male%20construction%20workers%20in%20rural%20India%281%29.JPG">average annual growth of construction workers&rsquo;</a> <a href="https://im4change.org/upload/files/State%20wise%20growth%20in%20average%20daily%20wage%20rates%20in%20real%20terms%20for%20male%20construction%20workers%20in%20rural%20India%281%29.JPG" title="https://im4change.org/upload/files/State%20wise%20growth%20in%20average%20daily%20wage%20rates%20in%20real%20terms%20for%20male%20construction%20workers%20in%20rural%20India%281%29.JPG">wage rates in real terms</a> during the period from 2015-16 to 2020-21 was negative in Assam <em>(-1.2 percent)</em>, Haryana <em>(-2.1 percent)</em>, Jammu and Kashmir <em>(-2.7 percent)</em>, Karnataka <em>(-0.6 percent)</em>, Kerala <em>(-4.4 percent)</em>, Manipur <em>(-6.3 percent)</em>, Rajasthan <em>(-1.2 percent)</em>, Tamil Nadu <em>(-0.9 percent)</em>, and Tripura <em>(-1.1 percent)</em>. Please note that the <a href="https://im4change.org/upload/files/State-wise%20Average%20Inflation%20CPI%20-%20Inflation.PDF" title="https://im4change.org/upload/files/State-wise%20Average%20Inflation%20CPI%20-%20Inflation.PDF">rate of inflation</a> in <a href="https://im4change.org/upload/files/State-wise%20Average%20Inflation%20CPI%20-%20Inflation.PDF" title="https://im4change.org/upload/files/State-wise%20Average%20Inflation%20CPI%20-%20Inflation.PDF">CPI-General</a> has been used to get the average annual growth of construction workers&rsquo; wage rates in real terms. Kindly have a look at table-1. &nbsp;&nbsp;</p><p style="text-align:justify">In the case of Meghalaya, the <a href="https://im4change.org/upload/files/State%20wise%20average%20daily%20nominal%20wage%20rates%20in%20rural%20india%20men%20construction%20workers.JPG" title="https://im4change.org/upload/files/State%20wise%20average%20daily%20nominal%20wage%20rates%20in%20rural%20india%20men%20construction%20workers.JPG">nominal daily wage rate of male construction</a> <a href="https://im4change.org/upload/files/State%20wise%20average%20daily%20nominal%20wage%20rates%20in%20rural%20india%20men%20construction%20workers.JPG" title="https://im4change.org/upload/files/State%20wise%20average%20daily%20nominal%20wage%20rates%20in%20rural%20india%20men%20construction%20workers.JPG">workers</a> fell from Rs. 186.0 in 2016-17 to Rs. 100.0 in 2017-18 i.e., a decline&nbsp;by -46.2 percent over previous year. However, the same bounced back to Rs. 273.2 in 2018-19 i.e., an increase by 173.2 percent over previous year. In <a href="https://im4change.org/upload/files/State%20wise%20growth%20in%20average%20daily%20wage%20rates%20in%20real%20terms%20for%20male%20construction%20workers%20in%20rural%20India%281%29.JPG" title="https://im4change.org/upload/files/State%20wise%20growth%20in%20average%20daily%20wage%20rates%20in%20real%20terms%20for%20male%20construction%20workers%20in%20rural%20India%281%29.JPG">real terms, the construction sector</a> <a href="https://im4change.org/upload/files/State%20wise%20growth%20in%20average%20daily%20wage%20rates%20in%20real%20terms%20for%20male%20construction%20workers%20in%20rural%20India%281%29.JPG" title="https://im4change.org/upload/files/State%20wise%20growth%20in%20average%20daily%20wage%20rates%20in%20real%20terms%20for%20male%20construction%20workers%20in%20rural%20India%281%29.JPG">wage rate in Meghalaya</a> grew by -47.7 percent in 2017-18 <em>(over previous year)</em> and 171.0 percent in 2018-19 <em>(over previous year)</em>.</p><p style="text-align:justify">Some states experienced negative <a href="https://im4change.org/upload/files/State%20wise%20growth%20in%20average%20daily%20wage%20rates%20in%20real%20terms%20for%20male%20construction%20workers%20in%20rural%20India%281%29.JPG" title="https://im4change.org/upload/files/State%20wise%20growth%20in%20average%20daily%20wage%20rates%20in%20real%20terms%20for%20male%20construction%20workers%20in%20rural%20India%281%29.JPG">growth in construction workers&rsquo;</a> <a href="https://im4change.org/upload/files/State%20wise%20growth%20in%20average%20daily%20wage%20rates%20in%20real%20terms%20for%20male%20construction%20workers%20in%20rural%20India%281%29.JPG" title="https://im4change.org/upload/files/State%20wise%20growth%20in%20average%20daily%20wage%20rates%20in%20real%20terms%20for%20male%20construction%20workers%20in%20rural%20India%281%29.JPG">wage rates in real terms</a> for more than two years between 2015-16 and 2020-21. For example, <a href="https://im4change.org/upload/files/State%20wise%20growth%20in%20average%20daily%20wage%20rates%20in%20real%20terms%20for%20male%20construction%20workers%20in%20rural%20India%281%29.JPG" title="https://im4change.org/upload/files/State%20wise%20growth%20in%20average%20daily%20wage%20rates%20in%20real%20terms%20for%20male%20construction%20workers%20in%20rural%20India%281%29.JPG">Assam</a> experienced negative growth in wage rates <em>(in real terms)</em> during 2017-18, 2018-19, 2019-20, and 2020-21. &nbsp;</p><p style="text-align:justify">At the national level, the&nbsp;<a href="https://im4change.org/upload/files/State%20wise%20growth%20in%20average%20daily%20wage%20rates%20in%20real%20terms%20for%20male%20construction%20workers%20in%20rural%20India%281%29.JPG" title="https://im4change.org/upload/files/State%20wise%20growth%20in%20average%20daily%20wage%20rates%20in%20real%20terms%20for%20male%20construction%20workers%20in%20rural%20India%281%29.JPG">construction workers&rsquo; wage rates in real terms</a> on average grew by just 0.1 percent annually during the period from 2015-16 to 2020-21.</p><p style="text-align:justify">Kindly <a href="https://docs.google.com/spreadsheets/d/1avu0-WtaKV2RHXtz2eiP7iS8znGVBdKC/edit?usp=sharing&amp;ouid=112233925171588304692&amp;rtpof=true&amp;sd=true" title="https://docs.google.com/spreadsheets/d/1avu0-WtaKV2RHXtz2eiP7iS8znGVBdKC/edit?usp=sharing&amp;ouid=112233925171588304692&amp;rtpof=true&amp;sd=true">click here</a> to access the spreadsheet in order to look at the <a href="/upload/files/State%20wise%20average%20daily%20nominal%20wage%20rates%20in%20rural%20india%20men%20construction%20workers.JPG" title="/upload/files/State%20wise%20average%20daily%20nominal%20wage%20rates%20in%20rural%20india%20men%20construction%20workers.JPG">trends in nominal wage rates</a>, <a href="/upload/files/State%20wise%20growth%20in%20average%20daily%20nominal%20wage%20rates%20in%20rural%20india%20men%20construction%20workers.JPG" title="/upload/files/State%20wise%20growth%20in%20average%20daily%20nominal%20wage%20rates%20in%20rural%20india%20men%20construction%20workers.JPG">annual growth in nominal wage rates</a>, and <a href="/upload/files/State%20wise%20growth%20in%20average%20daily%20wage%20rates%20in%20real%20terms%20for%20male%20construction%20workers%20in%20rural%20India%281%29.JPG" title="/upload/files/State%20wise%20growth%20in%20average%20daily%20wage%20rates%20in%20real%20terms%20for%20male%20construction%20workers%20in%20rural%20India%281%29.JPG">annual growth in real wage rates</a> for construction workers in rural areas.&nbsp;</p><p style="text-align:justify"><strong>Data collection methodology</strong></p><p style="text-align:justify">As a part of Rural Labour Enquiry, the&nbsp;<a href="https://im4change.org/upload/files/ilj_feb_2013.pdf" title="https://im4change.org/upload/files/ilj_feb_2013.pdf">daily wage rates</a> in respect of eighteen agricultural and non-agricultural occupations are being collected along with rural retail price data by the Field Operations Division of the National Sample Survey Organisation since 1986-87, according to a February 2013 <a href="https://im4change.org/upload/files/ilj_feb_2013.pdf" title="https://im4change.org/upload/files/ilj_feb_2013.pdf">edition of the Indian Labour Journal</a>.&nbsp;On the recommendations of the Governing Council of the National Sample Survey Organisation in its 61st meeting,&nbsp;the <a href="https://im4change.org/upload/files/ilj_feb_2013.pdf" title="https://im4change.org/upload/files/ilj_feb_2013.pdf">Labour Bureau</a> started the compilation and analysis of wage rate data with effect from April, 1998.&nbsp;</p><p style="text-align:justify">The Field Operations Division of the National Sample Survey Organisation has been entrusted with the work of <a href="https://im4change.org/upload/files/METHOLOGY%20FOR%20COMPILATION%20OF%20THE%20WAGE%20RATE%20DATA.pdf" title="https://im4change.org/upload/files/METHOLOGY%20FOR%20COMPILATION%20OF%20THE%20WAGE%20RATE%20DATA.pdf">data collection</a>. The <a href="https://im4change.org/upload/files/METHOLOGY%20FOR%20COMPILATION%20OF%20THE%20WAGE%20RATE%20DATA.pdf" title="https://im4change.org/upload/files/METHOLOGY%20FOR%20COMPILATION%20OF%20THE%20WAGE%20RATE%20DATA.pdf">wage rate data</a> are being collected along with rural retail prices from 600 sample villages spread over 66 NSS regions of 20 States by canvassing Block-5 <em>(Annexure-I)</em> of Schedule 3.01(R). The data collection from these sample villages is staggered over the four weeks of a month with one-fourth of them being covered every week. The days of canvassing of Schedule 3.01(R) are fixed. The village functionaries like the Panchayat Secretary, Progress Assistant, Patwari and other Village or Block Officials are the primary informants for collection of data on wage rates. The data on normal working hours and the prevailing wage rates in cash and kind for the reported working hours are collected sex-wise for each of the 18 selected occupations in 20 states, indicates an old&nbsp;<a href="https://im4change.org/upload/files/METHOLOGY%20FOR%20COMPILATION%20OF%20THE%20WAGE%20RATE%20DATA.pdf" title="https://im4change.org/upload/files/METHOLOGY%20FOR%20COMPILATION%20OF%20THE%20WAGE%20RATE%20DATA.pdf">document</a> of the Labour Bureau. &nbsp;&nbsp;</p><p style="text-align:justify">The wage rates are sometimes reported for a duration that is less/more than the normal working hours. In such cases, they are <a href="https://im4change.org/upload/files/METHOLOGY%20FOR%20COMPILATION%20OF%20THE%20WAGE%20RATE%20DATA.pdf" title="https://im4change.org/upload/files/METHOLOGY%20FOR%20COMPILATION%20OF%20THE%20WAGE%20RATE%20DATA.pdf">first normalised for eight hours</a> working day. As regards the mode of payment of wages, it is made in both ways i.e., in cash and/or in kind. The payments made in kind are very common in rural areas, which include foodgrains, cooked food, tea, fuel, cigarette, beedi, fodder, etc.&nbsp;The wages reported in kind are evaluated at local retail prices. Thereafter, the data is thoroughly scrutinised and discrepant points are referred back to the field for clarification. In the next stage, the simple arithmetic average of these normalised daily wage rates is worked out occupation-wise and sex-wise for each state.</p><p style="text-align:justify"><a href="http://ras.org.in/methodology_of_data_collection_unsuited_to_changing_rural_reality" title="http://ras.org.in/methodology_of_data_collection_unsuited_to_changing_rural_reality">Up to June 2000</a>, the average wage rates at the national level were derived by taking the simple average of state figures; since July 2000, the averages have been obtained by dividing the sum total of wages of all 20 states by the number of centres or villages from which data were collected. The state-wise averages are restricted only to those occupations where the number of centres is five or more to avoid abnormal fluctuations and inconsistency in wages paid to different categories of workers on account of varying numbers of centres. However, in order to calculate the all-India averages, all neglected centres are taken into account to arrive at the total number of centres at the national level.</p><p style="text-align:justify">The <a href="/upload/files/RBI%20note%20Average%20Daily%20Wage%20rate%20Methodology.pdf" title="/upload/files/RBI%20note%20Average%20Daily%20Wage%20rate%20Methodology.pdf">Reserve Bank of India</a>&nbsp;<em>(whose data we have used in writing this news alert)</em> has collated and is releasing monthly time series data on rural wage rates based on the data published by the Labour Bureau, Government of India. Starting from November 2013 the Labour Bureau is collecting the rural wage data in respect of 12 agricultural and 13 non-agricultural occupations across 20 major states, namely, Andhra Pradesh, Assam, Bihar, Gujarat, Haryana, Himachal Pradesh, Jammu &amp; Kashmir, Karnataka, Kerala, Madhya Pradesh, Maharashtra, Manipur, Meghalaya, Orissa, Punjab, Rajasthan, Tamil Nadu, Tripura, Uttar Pradesh and West Bengal. The occupations for which the daily wage rates are collected every month are: <u>(A) Agricultural occupations</u> &ndash; (1) &nbsp;Ploughing/ Tilling workers, (2) Sowing <em>(including planting/ Transplanting/ Weeding)</em> workers, (3) Harvesting/ Winnowing/ Threshing workers, (4) Picking workers <em>(including Tea, Cotton, Tobacco and other commercial crops)</em>, (5) Horticulture workers <em>(including nursery growers)</em>, (6) Fishermen-inland, (7) Fishermen coastal/deep-sea, (8) Loggers and wood cutters, (9) Animal husbandry workers <em>(including poultry workers, dairy workers and herdsman)</em>, (10) Packaging labourers, agriculture, (11) General agricultural labourers <em>(including watering/ irrigation workers, etc.)</em>, (12) Plant protection workers <em>(applying pesticides, treating seeds, etc.)</em>; and <u>(B) Non-agricultural occupations</u> &ndash; (13) Carpenter, (14) Blacksmith, (15) Mason, (16) Weavers, (17) Beedi makers, (18) Bamboo, cane basket weavers, (19) Handicraft workers, (20) Plumbers, (21) Electrician, (22) Construction workers <em>(for roads, dams, industrial &amp; project construction work and Well diggers)</em>, (23) LMV &amp; Tractor drivers, (24) Non-agricultural labourers <em>(including porters, loaders)</em>, and (25) Sweeping/cleaning workers.&nbsp;</p><p style="text-align:justify"><strong><em>References&nbsp;</em></strong></p><p style="text-align:justify">Handbook of Statistics on Indian States 2020-21, released in November 2021, please <a href="https://m.rbi.org.in/scripts/AnnualPublications.aspx?head=Handbook%20of%20Statistics%20on%20Indian%20States" title="https://m.rbi.org.in/scripts/AnnualPublications.aspx?head=Handbook%20of%20Statistics%20on%20Indian%20States">click here</a> to access</p><p style="text-align:justify">State-wise Average Daily Wage Rates in Rural India (Men - General Agricultural Labourers), RBI Handbook of Statistics on Indian States 2020-21, released in November 2021, please <a href="/upload/files/State-wise%20Average%20Daily%20Wage%20Rates%20in%20Rural%20India%20Men%20-%20General%20Agricultural%20Labourers.PDF" title="/upload/files/State-wise%20Average%20Daily%20Wage%20Rates%20in%20Rural%20India%20Men%20-%20General%20Agricultural%20Labourers.PDF">click here</a> to access&nbsp;</p><p style="text-align:justify">State-wise Average Daily Wage Rates in Rural India (Men - Non-Agricultural Labourers), RBI Handbook of Statistics on Indian States 2020-21, released in November 2021, please <a href="/upload/files/State-wise%20Average%20Daily%20Wage%20Rates%20in%20Rural%20India%20Men%20-%20Non%20Agricultural%20Labourers.PDF" title="/upload/files/State-wise%20Average%20Daily%20Wage%20Rates%20in%20Rural%20India%20Men%20-%20Non%20Agricultural%20Labourers.PDF">click here</a> to access&nbsp;</p><p style="text-align:justify">State-wise Average Daily Wage Rates in Rural India (Men - Construction Workers), RBI Handbook of Statistics on Indian States 2020-21, released in November 2021, please <a href="/upload/files/State-wise%20Average%20Daily%20Wage%20Rates%20in%20Rural%20India%20Men%20-%20Construction%20Workers.PDF" title="/upload/files/State-wise%20Average%20Daily%20Wage%20Rates%20in%20Rural%20India%20Men%20-%20Construction%20Workers.PDF">click here</a> to access&nbsp;</p><p style="text-align:justify">State-wise Average Inflation (CPI) - Inflation, RBI Handbook of Statistics on Indian States 2020-21, released in November 2021, please <a href="/upload/files/State-wise%20Average%20Inflation%20CPI%20-%20Inflation.PDF" title="/upload/files/State-wise%20Average%20Inflation%20CPI%20-%20Inflation.PDF">click here</a> to access&nbsp;</p><p style="text-align:justify">Indian Labour Journal, February 2013, please <a href="/upload/files/ilj_feb_2013.pdf" title="/upload/files/ilj_feb_2013.pdf">click here</a> to access &nbsp;</p><p style="text-align:justify">Wage Rates in Rural India 2003-04: Methodology for Compilation of the Wage Rate Data, Labour Bureau, please <a href="/upload/files/METHOLOGY%20FOR%20COMPILATION%20OF%20THE%20WAGE%20RATE%20DATA.pdf" title="/upload/files/METHOLOGY%20FOR%20COMPILATION%20OF%20THE%20WAGE%20RATE%20DATA.pdf">click here</a> to access&nbsp; &nbsp;&nbsp;</p><p style="text-align:justify">Average Daily Wage Rates in Rural India: Methodology and coverage (From November 2013), Reserve Bank of India, please <a href="https://dbie.rbi.org.in" title="https://dbie.rbi.org.in">click here</a>&nbsp;and <a href="/upload/files/RBI%20note%20Average%20Daily%20Wage%20rate%20Methodology%281%29.pdf" title="/upload/files/RBI%20note%20Average%20Daily%20Wage%20rate%20Methodology%281%29.pdf">here</a> to access&nbsp;</p><p style="text-align:justify">Consumer Price Index Numbers on Base 2012=100 for Rural, Urban and Combined for the month of January 2022, Ministry of Statistics and Programme Implementation (MoSPI), National Statistical Office (NSO), released on 14th February 2022, please <a href="/upload/files/CPI%20Press%20Release%20January%202022%281%29.pdf" title="/upload/files/CPI%20Press%20Release%20January%202022%281%29.pdf">click here</a> to access&nbsp;</p><p style="text-align:justify">Methodology of Data Collection Unsuited to Changing Rural Reality: A Study of Agricultural Wage Data in India -Yoshifumi Usami, Arindam Das, and Madhura Swaminathan, Review of Agrarian Studies, Vol. 10, No. 2, July-December, 2020, please <a href="http://ras.org.in/methodology_of_data_collection_unsuited_to_changing_rural_reality" title="http://ras.org.in/methodology_of_data_collection_unsuited_to_changing_rural_reality">click here</a> to access</p><p>Russia-ukraine crisis to push up fertiliser prices, govt subsidies, IANS/ Business Standard, 4 March, 2022, please <a href="https://www.business-standard.com/article/economy-policy/russia-ukraine-crisis-to-push-up-fertiliser-prices-govt-subsidies-122030400560_1.html" title="https://www.business-standard.com/article/economy-policy/russia-ukraine-crisis-to-push-up-fertiliser-prices-govt-subsidies-122030400560_1.html">click here</a> to access &nbsp;</p><p>Cooking oil prices spike in India due to Russia-ukraine crisis -B Krishna Mohan, TelanganaToday.com, 3 March, 2022, please <a href="https://telanganatoday.com/cooking-oil-prices-spike-in-india-due-to-russia-ukraine-crisis" title="https://telanganatoday.com/cooking-oil-prices-spike-in-india-due-to-russia-ukraine-crisis">click here</a> to access &nbsp;</p><p>Govt reviews cooking oil imports as ukraine crisis disrupts supplies, prices shoot up -Amiti Sen and Prabhudutta Mishra, The Hindu Business Line, 4 March, 2022, please <a href="https://www.thehindubusinessline.com/markets/commodities/govt-reviews-cooking-oil-imports-as-ukraine-crisis-disrupts-supplies-prices-shoot-up/article65190879.ece" title="https://www.thehindubusinessline.com/markets/commodities/govt-reviews-cooking-oil-imports-as-ukraine-crisis-disrupts-supplies-prices-shoot-up/article65190879.ece">click here</a> to access &nbsp;</p><p>India&#39;s Economy Faces A Potential Stagflation Risk From Ukraine War -Sunil Prabhu, NDTV.com, 1 March, 2022, please <a href="https://www.ndtv.com/business/indias-economy-faces-a-potential-stagflation-risk-from-ukraine-war-2796624" title="https://www.ndtv.com/business/indias-economy-faces-a-potential-stagflation-risk-from-ukraine-war-2796624">click here</a> to access</p><p>India to be one of Asia&rsquo;s &lsquo;biggest losers&rsquo; from the Ukraine war as Russia slammed by global sanctions -Paran Balakrishnan, The Telegraph, 1 March, 2022, please <a href="https://www.telegraphindia.com/business/russia-ukraine-crisis-india-to-be-one-of-asias-biggest-losers-from-the-ukraine-war-as-russia-slammed-by-global-sanctions/cid/1854032" title="https://www.telegraphindia.com/business/russia-ukraine-crisis-india-to-be-one-of-asias-biggest-losers-from-the-ukraine-war-as-russia-slammed-by-global-sanctions/cid/1854032">click here</a> to access</p><p>Crude Oil Prices Rise, Tracking Russia-Ukraine Conflict -Rahul Karunakar, NDTV.com <em>(with inputs from Agencies)</em>, 1 March, 2022, please <a href="https://www.ndtv.com/business/crude-oil-prices-rise-on-tuesday-tracking-russia-ukraine-conflict-2796187" title="https://www.ndtv.com/business/crude-oil-prices-rise-on-tuesday-tracking-russia-ukraine-conflict-2796187">click here</a> to access</p><p>Cooking Oil May Become Costlier Due to Russia-ukraine War. Know Why, News18.com, 27 February, 2022, please <a href="https://www.news18.com/news/business/markets/cooking-oil-may-become-costlier-due-to-russia-ukraine-war-know-why-4812740.html" title="https://www.news18.com/news/business/markets/cooking-oil-may-become-costlier-due-to-russia-ukraine-war-know-why-4812740.html">click here</a> to access &nbsp;</p><p style="text-align:justify"><strong>Image Courtesy: Inclusive Media for Change/ Shambhu Ghatak</strong></p>'
$lang = 'English'
$SITE_URL = 'https://im4change.in/'
$site_title = 'im4change'
$adminprix = 'admin'</pre><pre class="stack-trace">include - APP/Template/Layout/printlayout.ctp, line 8
Cake\View\View::_evaluate() - CORE/src/View/View.php, line 1413
Cake\View\View::_render() - CORE/src/View/View.php, line 1374
Cake\View\View::renderLayout() - CORE/src/View/View.php, line 927
Cake\View\View::render() - CORE/src/View/View.php, line 885
Cake\Controller\Controller::render() - CORE/src/Controller/Controller.php, line 791
Cake\Http\ActionDispatcher::_invoke() - CORE/src/Http/ActionDispatcher.php, line 126
Cake\Http\ActionDispatcher::dispatch() - CORE/src/Http/ActionDispatcher.php, line 94
Cake\Http\BaseApplication::__invoke() - CORE/src/Http/BaseApplication.php, line 235
Cake\Http\Runner::__invoke() - CORE/src/Http/Runner.php, line 65
Cake\Routing\Middleware\RoutingMiddleware::__invoke() - CORE/src/Routing/Middleware/RoutingMiddleware.php, line 162
Cake\Http\Runner::__invoke() - CORE/src/Http/Runner.php, line 65
Cake\Routing\Middleware\AssetMiddleware::__invoke() - CORE/src/Routing/Middleware/AssetMiddleware.php, line 88
Cake\Http\Runner::__invoke() - CORE/src/Http/Runner.php, line 65
Cake\Error\Middleware\ErrorHandlerMiddleware::__invoke() - CORE/src/Error/Middleware/ErrorHandlerMiddleware.php, line 96
Cake\Http\Runner::__invoke() - CORE/src/Http/Runner.php, line 65
Cake\Http\Runner::run() - CORE/src/Http/Runner.php, line 51</pre></div></pre>news-alerts-57/real-wage-rates-of-the-rural-workers-hardly-increased-during-the-past-6-years.html"/>
<meta http-equiv="Content-Type" content="text/html; charset=utf-8"/>
<link href="https://im4change.in/css/control.css" rel="stylesheet" type="text/css"
media="all"/>
<title>NEWS ALERTS | Real wage rates of the rural workers hardly increased during the last 6 years | Im4change.org</title>
<meta name="description" content="In the absence of income or expenditure-based headcount ratio, the growth in the real wages (i.e., nominal wages adjusted against retail inflation) of the manual workers is considered to be a good proxy to assess the trends in poverty. This..."/>
<script src="https://im4change.in/js/jquery-1.10.2.js"></script>
<script type="text/javascript" src="https://im4change.in/js/jquery-migrate.min.js"></script>
<script language="javascript" type="text/javascript">
$(document).ready(function () {
var img = $("img")[0]; // Get my img elem
var pic_real_width, pic_real_height;
$("<img/>") // Make in memory copy of image to avoid css issues
.attr("src", $(img).attr("src"))
.load(function () {
pic_real_width = this.width; // Note: $(this).width() will not
pic_real_height = this.height; // work for in memory images.
});
});
</script>
<style type="text/css">
@media screen {
div.divFooter {
display: block;
}
}
@media print {
.printbutton {
display: none !important;
}
}
</style>
</head>
<body>
<table cellpadding="0" cellspacing="0" border="0" width="98%" align="center">
<tr>
<td class="top_bg">
<div class="divFooter">
<img src="https://im4change.in/images/logo1.jpg" height="59" border="0"
alt="Resource centre on India's rural distress" style="padding-top:14px;"/>
</div>
</td>
</tr>
<tr>
<td id="topspace"> </td>
</tr>
<tr id="topspace">
<td> </td>
</tr>
<tr>
<td height="50" style="border-bottom:1px solid #000; padding-top:10px;" class="printbutton">
<form><input type="button" value=" Print this page "
onclick="window.print();return false;"/></form>
</td>
</tr>
<tr>
<td width="100%">
<h1 class="news_headlines" style="font-style:normal">
<strong>Real wage rates of the rural workers hardly increased during the last 6 years</strong></h1>
</td>
</tr>
<tr>
<td width="100%" style="font-family:Arial, 'Segoe Script', 'Segoe UI', sans-serif, serif"><font size="3">
<p style="text-align:justify">In the absence of income or expenditure-based headcount ratio, the growth in the real wages <em>(i.e., nominal wages adjusted against retail inflation)</em> of the manual workers is considered to be a good proxy to assess the trends in poverty. This is because the manual, unskilled/ semi-skilled labourers exist at the bottom of the pyramid or economic hierarchy, and most of them belong to the social categories Scheduled Castes (SCs) and Scheduled Tribes (STs). A positive growth in their real wages <em>(or real wage rates) </em>is anticipated to improve their purchasing power <em>(i.e., income or consumption expenditure)</em> and lift them out of the poverty trap. </p><p style="text-align:justify">Clearly, there exists inter-state differences in nominal wage rates, growth in nominal wage rates and growth in real wage rates, which we will see in this news alert. </p><p style="text-align:justify">Against the backdrop of the <a href="https://www.thehindubusinessline.com/markets/commodities/govt-reviews-cooking-oil-imports-as-ukraine-crisis-disrupts-supplies-prices-shoot-up/article65190879.ece" title="https://www.thehindubusinessline.com/markets/commodities/govt-reviews-cooking-oil-imports-as-ukraine-crisis-disrupts-supplies-prices-shoot-up/article65190879.ece">Russia-Ukraine conflict</a>, which is anticipated to cause both <a href="https://www.ndtv.com/business/indias-economy-faces-a-potential-stagflation-risk-from-ukraine-war-2796624" title="https://www.ndtv.com/business/indias-economy-faces-a-potential-stagflation-risk-from-ukraine-war-2796624">food and fuel retail inflation</a> in India in the coming times, it is even more important to look at the past trends in wage rate growth of the rural workers. It should be noted that the <a href="https://public.flourish.studio/visualisation/8706137" title="https://public.flourish.studio/visualisation/8706137">year-on-year inflation</a> in <a href="https://public.flourish.studio/visualisation/8706137" title="https://public.flourish.studio/visualisation/8706137">Consumer</a> <a href="https://public.flourish.studio/visualisation/8706137" title="https://public.flourish.studio/visualisation/8706137">Price Index Rural</a> exceeded the <a href="https://public.flourish.studio/visualisation/8706137" title="https://public.flourish.studio/visualisation/8706137">year-on-year inflation</a> in <a href="https://public.flourish.studio/visualisation/8706137" title="https://public.flourish.studio/visualisation/8706137">CPI Urban</a> during January 2022 at the national level. Even before the beginning of Russia-Ukraine conflict <em>(i.e., during January 2022)</em>, in rural areas, <a href="https://im4change.org/upload/files/CPI%20Press%20Release%20January%202022%281%29.pdf" title="https://im4change.org/upload/files/CPI%20Press%20Release%20January%202022%281%29.pdf">retail inflation rate of 20.6 percent</a> was noticed for 'oils and fats', aside from <a href="https://im4change.org/upload/files/CPI%20Press%20Release%20January%202022%281%29.pdf" title="https://im4change.org/upload/files/CPI%20Press%20Release%20January%202022%281%29.pdf">8.44 percent retail inflation for 'fuel and light'</a>, <a href="https://im4change.org/upload/files/CPI%20Press%20Release%20January%202022%281%29.pdf" title="https://im4change.org/upload/files/CPI%20Press%20Release%20January%202022%281%29.pdf">8.27 percent</a> for 'transport and communication', and <a href="https://im4change.org/upload/files/CPI%20Press%20Release%20January%202022%281%29.pdf" title="https://im4change.org/upload/files/CPI%20Press%20Release%20January%202022%281%29.pdf">9.65 percent for 'clothing and footwear'</a>. </p><p style="text-align:justify">At the national level, the average daily nominal wage rate for male construction workers in rural areas during the period from 2014-15 to 2020-21 was Rs. 316.9, which was greater than that of the male non-farm workers in rural areas. The average daily nominal wage rate for male non-agricultural labourers in rural areas during the period from 2014-15 to 2020-21 was Rs. 273.8, which exceeded the average daily nominal wage rates for male farm labourers in rural areas <em>(i.e., Rs. 265.1)</em>. However, in Andhra Pradesh, Haryana, Himachal Pradesh, Jammu and Kashmir, Karnataka, Kerala, Meghalaya, Punjab, and Tripura, the average daily nominal wage rates for male agricultural labourers in rural areas during the period from 2014-15 to 2020-21 exceeded the average daily nominal wage rates for male non-farm labourers in rural areas. Please see chart-1.</p><p style="text-align:justify"><img alt="" src="/upload/images/Chart%201.png" style="height:670px; width:1000px" /></p><p style="text-align:justify"><em><strong>Notes:</strong> The average (i.e., arithmetic mean) daily nominal wage rates for various categories of workers in rural India in the period from 2014-15 to 2020-21 has been calculated by the Inclusive Media for Change staff</em></p><p style="text-align:justify"><em>Please <a href="https://docs.google.com/spreadsheets/d/1avu0-WtaKV2RHXtz2eiP7iS8znGVBdKC/edit?usp=sharing&ouid=112233925171588304692&rtpof=true&sd=true" title="https://docs.google.com/spreadsheets/d/1avu0-WtaKV2RHXtz2eiP7iS8znGVBdKC/edit?usp=sharing&ouid=112233925171588304692&rtpof=true&sd=true">click here</a> to access the data in spreadsheet format</em></p><p style="text-align:justify"><em><strong>Source: </strong>Handbook of Statistics on Indian States 2020-21, released in November 2021, please <a href="https://m.rbi.org.in/scripts/AnnualPublications.aspx?head=Handbook%20of%20Statistics%20on%20Indian%20States" title="https://m.rbi.org.in/scripts/AnnualPublications.aspx?head=Handbook%20of%20Statistics%20on%20Indian%20States">click here</a> to access</em></p><p style="text-align:justify"><em>State-wise Average Daily Wage Rates in Rural India (Men - General Agricultural Labourers), RBI Handbook of Statistics on Indian States 2020-21, released in November 2021, please <a href="/upload/files/State-wise%20Average%20Daily%20Wage%20Rates%20in%20Rural%20India%20Men%20-%20General%20Agricultural%20Labourers.PDF" title="/upload/files/State-wise%20Average%20Daily%20Wage%20Rates%20in%20Rural%20India%20Men%20-%20General%20Agricultural%20Labourers.PDF">click here</a> to access </em></p><p style="text-align:justify"><em>State-wise Average Daily Wage Rates in Rural India (Men - Non-Agricultural Labourers), RBI Handbook of Statistics on Indian States 2020-21, released in November 2021, please <a href="/upload/files/State-wise%20Average%20Daily%20Wage%20Rates%20in%20Rural%20India%20Men%20-%20Non%20Agricultural%20Labourers.PDF" title="/upload/files/State-wise%20Average%20Daily%20Wage%20Rates%20in%20Rural%20India%20Men%20-%20Non%20Agricultural%20Labourers.PDF">click here</a> to access </em></p><p style="text-align:justify"><em>State-wise Average Daily Wage Rates in Rural India (Men - Construction Workers), RBI Handbook of Statistics on Indian States 2020-21, released in November 2021, please <a href="/upload/files/State-wise%20Average%20Daily%20Wage%20Rates%20in%20Rural%20India%20Men%20-%20Construction%20Workers.PDF" title="/upload/files/State-wise%20Average%20Daily%20Wage%20Rates%20in%20Rural%20India%20Men%20-%20Construction%20Workers.PDF">click here</a> to access </em></p><p style="text-align:justify"><em>State-wise Average Inflation (CPI) - Inflation, RBI Handbook of Statistics on Indian States 2020-21, released in November 2021, please <a href="/upload/files/State-wise%20Average%20Inflation%20CPI%20-%20Inflation.PDF" title="/upload/files/State-wise%20Average%20Inflation%20CPI%20-%20Inflation.PDF">click here</a> to access </em></p><p style="text-align:justify"><strong>---</strong></p><p style="text-align:justify">At the national level, the agricultural nominal wage rate grew faster than the non-farm wage rate on average for male labourers in rural areas during the period from 2015-16 to 2020-21. However, in states like Assam, Bihar, Haryana, Madhya Pradesh, Odisha, Punjab, and West Bengal, the non-farm nominal wage rates grew faster than the farm wage rates on average for male workers in rural areas during the period from 2015-16 to 2020-21. Please see chart-2. </p><p style="text-align:justify"><img alt="" src="/upload/images/Chart%202.png" style="height:653px; width:1000px" /></p><p style="text-align:justify"><em><strong>Notes: </strong>The average growth in daily nominal wage rates for various categories of workers in rural India in the period from 2015-16 to 2020-21 has been calculated by the Inclusive Media for Change staff</em></p><p style="text-align:justify"><em>Please <a href="https://docs.google.com/spreadsheets/d/1avu0-WtaKV2RHXtz2eiP7iS8znGVBdKC/edit?usp=sharing&ouid=112233925171588304692&rtpof=true&sd=true" title="https://docs.google.com/spreadsheets/d/1avu0-WtaKV2RHXtz2eiP7iS8znGVBdKC/edit?usp=sharing&ouid=112233925171588304692&rtpof=true&sd=true">click here</a> to access the data in spreadsheet format</em></p><p style="text-align:justify"><em><strong>Source: </strong>Same as above</em><br /><strong>---</strong></p><p style="text-align:justify">At the national level, the construction sector nominal wage rate grew slower than the non-agricultural wage rate on average for male labourers in rural areas during the period from 2015-16 to 2020-21. However, in states like Andhra Pradesh, Bihar, Himachal Pradesh, Maharashtra, Meghalaya, Punjab, Tamil Nadu, and Uttar Pradesh, the construction sector nominal wage rates grew faster than the non-farm wage rates on average for male workers in rural areas during the period from 2015-16 to 2020-21. Please take a look at chart-2. </p><p style="text-align:justify">At the national level, the agricultural wage rate in real terms grew faster than the non-farm wage rate on average for male labourers in rural areas during the period from 2015-16 to 2020-21. However, in states like Assam, Bihar, Haryana, Madhya Pradesh, Odisha, Punjab, and West Bengal, the non-farm wage rates in real terms grew faster than the farm wage rates on average for male workers in rural areas during the period from 2015-16 to 2020-21. Please see table-1.</p><p style="text-align:justify"><strong>Table 1: State-wise Growth in Average Daily Wage Rates in Real terms for Male Agricultural Labourers, Male Non-Agricultural Labourers, and Male Construction Workers in Rural India, in %</strong><br /><img alt="" src="/upload/images/Table%201%20State-wise%20Growth%20in%20Average%20Daily%20Wage%20Rates%20in%20Real%20terms%20for%20Male%20Agricultural%20Labourers%20Male%20Non-Agricultural%20Labourers%20and%20Male%20Construction%20Workers%20in%20Rural%20India%20in%20percent.png" style="height:539px; width:750px" /></p><p style="text-align:justify"><em><strong>Notes: </strong>The average growth in daily wage rates in real terms for various categories of workers in rural India in the period from 2015-16 to 2020-21 has been calculated by the Inclusive Media for Change staff</em></p><p style="text-align:justify"><em>Please <a href="https://docs.google.com/spreadsheets/d/1avu0-WtaKV2RHXtz2eiP7iS8znGVBdKC/edit?usp=sharing&ouid=112233925171588304692&rtpof=true&sd=true" title="https://docs.google.com/spreadsheets/d/1avu0-WtaKV2RHXtz2eiP7iS8znGVBdKC/edit?usp=sharing&ouid=112233925171588304692&rtpof=true&sd=true">click here</a> to access the data in spreadsheet format</em></p><p style="text-align:justify"><em><strong>Source: </strong>Same as above</em><br /><strong>---</strong></p><p style="text-align:justify">At the national level, the construction sector wage rate in real terms grew slower than the non-agricultural wage rate on average for male labourers in rural areas during the period from 2015-16 to 2020-21. However, in states like Andhra Pradesh, Bihar, Himachal Pradesh, Maharashtra, Meghalaya, Punjab, Tamil Nadu, and Uttar Pradesh, the construction sector wage rates in real terms grew faster than the non-farm wage rates on average for male workers in rural areas during the period from 2015-16 to 2020-21. Please take a look at table-1. </p><p style="text-align:justify">In the following paragraphs, we have discussed the trends in agricultural wage rates, non-farm wage rates, and construction sector wage rates <em>(in rural areas)</em> in detail. </p><p style="text-align:justify"><strong>Agricultural wages in rural areas</strong></p><p style="text-align:justify">The highest <a href="https://im4change.org/upload/files/State%20wise%20average%20daily%20nominal%20wage%20rates%20in%20rural%20india%20men%20farm%20labourers.JPG" title="https://im4change.org/upload/files/State%20wise%20average%20daily%20nominal%20wage%20rates%20in%20rural%20india%20men%20farm%20labourers.JPG">average daily nominal wage rate</a> <a href="https://im4change.org/upload/files/State%20wise%20average%20daily%20nominal%20wage%20rates%20in%20rural%20india%20men%20farm%20labourers.JPG" title="https://im4change.org/upload/files/State%20wise%20average%20daily%20nominal%20wage%20rates%20in%20rural%20india%20men%20farm%20labourers.JPG">for male agricultural labourers</a> in rural India during the period from 2014-15 to 2020-21 was found in Kerala <em>(Rs. 653.93)</em>, followed by Jammu and Kashmir <em>(Rs. 429.19)</em>, Tamil Nadu <em>(Rs. 385.6)</em>, Haryana <em>(Rs. 368.53)</em>, Himachal Pradesh <em>(Rs. 366.23)</em>, and Punjab <em>(Rs. 325.31)</em>. Please have a look at chart-1.</p><p style="text-align:justify">The lowest <a href="https://im4change.org/upload/files/State%20wise%20average%20daily%20nominal%20wage%20rates%20in%20rural%20india%20men%20farm%20labourers.JPG" title="https://im4change.org/upload/files/State%20wise%20average%20daily%20nominal%20wage%20rates%20in%20rural%20india%20men%20farm%20labourers.JPG">average daily nominal wage rate</a> <a href="https://im4change.org/upload/files/State%20wise%20average%20daily%20nominal%20wage%20rates%20in%20rural%20india%20men%20farm%20labourers.JPG" title="https://im4change.org/upload/files/State%20wise%20average%20daily%20nominal%20wage%20rates%20in%20rural%20india%20men%20farm%20labourers.JPG">for male agricultural labourers</a> in rural India during the period from 2014-15 to 2020-21 was observed in Madhya Pradesh <em>(Rs. 183.97)</em>, followed by Gujarat <em>(Rs. 190.07)</em>, Maharashtra <em>(Rs. 215.71)</em>, Odisha <em>(Rs. 216.87)</em>, Meghalaya <em>(Rs. 219.93)</em>, Bihar <em>(Rs. 230.43)</em>, Uttar Pradesh <em>(Rs. 230.5)</em>, and Assam <em>(Rs. 237.3)</em>. The related national level figure was Rs. 265.09 during the period from 2014-15 to 2020-21. Please consult chart-1. </p><p style="text-align:justify">The highest <a href="https://im4change.org/upload/files/State%20wise%20growth%20in%20average%20daily%20nominal%20wage%20rates%20in%20rural%20india%20men%20farm%20labourers.JPG" title="https://im4change.org/upload/files/State%20wise%20growth%20in%20average%20daily%20nominal%20wage%20rates%20in%20rural%20india%20men%20farm%20labourers.JPG">average annual growth rate in</a> <a href="https://im4change.org/upload/files/State%20wise%20growth%20in%20average%20daily%20nominal%20wage%20rates%20in%20rural%20india%20men%20farm%20labourers.JPG" title="https://im4change.org/upload/files/State%20wise%20growth%20in%20average%20daily%20nominal%20wage%20rates%20in%20rural%20india%20men%20farm%20labourers.JPG">nominal wage rates</a> during the period from 2015-16 to 2020-21 was found in Karnataka <em>(7.3 percent)</em>, followed by Andhra Pradesh <em>(6.8 percent)</em>, Madhya Pradesh <em>(6.4 percent)</em>, Uttar Pradesh <em>(6.2 percent)</em>, Odisha <em>(6.1 percent)</em>, and Meghalaya <em>(6.0 percent)</em>. Please see chart-2.</p><p style="text-align:justify">The lowest <a href="https://im4change.org/upload/files/State%20wise%20growth%20in%20average%20daily%20nominal%20wage%20rates%20in%20rural%20india%20men%20farm%20labourers.JPG" title="https://im4change.org/upload/files/State%20wise%20growth%20in%20average%20daily%20nominal%20wage%20rates%20in%20rural%20india%20men%20farm%20labourers.JPG">average annual growth rate</a> <a href="https://im4change.org/upload/files/State%20wise%20growth%20in%20average%20daily%20nominal%20wage%20rates%20in%20rural%20india%20men%20farm%20labourers.JPG" title="https://im4change.org/upload/files/State%20wise%20growth%20in%20average%20daily%20nominal%20wage%20rates%20in%20rural%20india%20men%20farm%20labourers.JPG">in nominal wage rates</a> during the same period was noticed in Haryana <em>(2.1 percent)</em>, followed by Rajasthan <em>(3.3 percent)</em>, Kerala <em>(3.5 percent)</em>, Punjab <em>(3.9 percent)</em>, and Tamil Nadu <em>(4.5 percent)</em>. Please consult chart-2.</p><p style="text-align:justify">The average annual <a href="https://im4change.org/upload/files/State%20wise%20growth%20in%20average%20daily%20wage%20rates%20in%20real%20terms%20for%20male%20farm%20labourers%20in%20rural%20India.JPG" title="https://im4change.org/upload/files/State%20wise%20growth%20in%20average%20daily%20wage%20rates%20in%20real%20terms%20for%20male%20farm%20labourers%20in%20rural%20India.JPG">growth of agricultural labourers’</a> <a href="https://im4change.org/upload/files/State%20wise%20growth%20in%20average%20daily%20wage%20rates%20in%20real%20terms%20for%20male%20farm%20labourers%20in%20rural%20India.JPG" title="https://im4change.org/upload/files/State%20wise%20growth%20in%20average%20daily%20wage%20rates%20in%20real%20terms%20for%20male%20farm%20labourers%20in%20rural%20India.JPG">wage rates in real terms</a> during the period from 2015-16 to 2020-21 were negative in Haryana <em>(-2.1 percent)</em>, Jammu and Kashmir <em>(-0.3 percent)</em>, Kerala <em>(-1.7 percent)</em>, Punjab <em>(-0.4 percent)</em>, Rajasthan <em>(-1.1 percent)</em>, Tamil Nadu <em>(-0.8 percent)</em>, Tripura <em>(-0.5 percent)</em>, and West Bengal <em>(-0.1 percent)</em>. It should be noted that the <a href="https://im4change.org/upload/files/State-wise%20Average%20Inflation%20CPI%20-%20Inflation.PDF" title="https://im4change.org/upload/files/State-wise%20Average%20Inflation%20CPI%20-%20Inflation.PDF">rate of inflation</a> in <a href="https://im4change.org/upload/files/State-wise%20Average%20Inflation%20CPI%20-%20Inflation.PDF" title="https://im4change.org/upload/files/State-wise%20Average%20Inflation%20CPI%20-%20Inflation.PDF">Consumer Price Index-General</a> has been used to get the average annual growth of agricultural labourers’ wage rates in real terms. Kindly consult table-1. </p><p style="text-align:justify">Some states witnessed negative <a href="https://im4change.org/upload/files/State%20wise%20growth%20in%20average%20daily%20wage%20rates%20in%20real%20terms%20for%20male%20farm%20labourers%20in%20rural%20India.JPG" title="https://im4change.org/upload/files/State%20wise%20growth%20in%20average%20daily%20wage%20rates%20in%20real%20terms%20for%20male%20farm%20labourers%20in%20rural%20India.JPG">growth in agricultural labourers’</a> <a href="https://im4change.org/upload/files/State%20wise%20growth%20in%20average%20daily%20wage%20rates%20in%20real%20terms%20for%20male%20farm%20labourers%20in%20rural%20India.JPG" title="https://im4change.org/upload/files/State%20wise%20growth%20in%20average%20daily%20wage%20rates%20in%20real%20terms%20for%20male%20farm%20labourers%20in%20rural%20India.JPG">wage rates in real terms</a> for more than two years between 2015-16 and 2020-21. For example, <a href="https://im4change.org/upload/files/State%20wise%20growth%20in%20average%20daily%20wage%20rates%20in%20real%20terms%20for%20male%20farm%20labourers%20in%20rural%20India.JPG" title="https://im4change.org/upload/files/State%20wise%20growth%20in%20average%20daily%20wage%20rates%20in%20real%20terms%20for%20male%20farm%20labourers%20in%20rural%20India.JPG">Haryana</a> experienced negative growth in 2015-16, 2016-17, 2017-18, 2019-20, and 2020-21. Likewise, <a href="https://im4change.org/upload/files/State%20wise%20growth%20in%20average%20daily%20wage%20rates%20in%20real%20terms%20for%20male%20farm%20labourers%20in%20rural%20India.JPG" title="https://im4change.org/upload/files/State%20wise%20growth%20in%20average%20daily%20wage%20rates%20in%20real%20terms%20for%20male%20farm%20labourers%20in%20rural%20India.JPG">Kerala</a> faced negative growth in 2017-18, 2018-19, 2019-20, and 2020-21. </p><p style="text-align:justify">At the national level, the <a href="https://im4change.org/upload/files/State%20wise%20growth%20in%20average%20daily%20wage%20rates%20in%20real%20terms%20for%20male%20farm%20labourers%20in%20rural%20India.JPG" title="https://im4change.org/upload/files/State%20wise%20growth%20in%20average%20daily%20wage%20rates%20in%20real%20terms%20for%20male%20farm%20labourers%20in%20rural%20India.JPG">agricultural labourers’</a> <a href="https://im4change.org/upload/files/State%20wise%20growth%20in%20average%20daily%20wage%20rates%20in%20real%20terms%20for%20male%20farm%20labourers%20in%20rural%20India.JPG" title="https://im4change.org/upload/files/State%20wise%20growth%20in%20average%20daily%20wage%20rates%20in%20real%20terms%20for%20male%20farm%20labourers%20in%20rural%20India.JPG">wage rates in real terms</a> on average grew by 1.0 percent annually during the period from 2015-16 to 2020-21.</p><p style="text-align:justify">Please <a href="https://docs.google.com/spreadsheets/d/1avu0-WtaKV2RHXtz2eiP7iS8znGVBdKC/edit?usp=sharing&ouid=112233925171588304692&rtpof=true&sd=true" title="https://docs.google.com/spreadsheets/d/1avu0-WtaKV2RHXtz2eiP7iS8znGVBdKC/edit?usp=sharing&ouid=112233925171588304692&rtpof=true&sd=true">click here</a> to access the spreadsheet in order to look at the trends in <a href="/upload/files/State%20wise%20average%20daily%20nominal%20wage%20rates%20in%20rural%20india%20men%20farm%20labourers.JPG" title="/upload/files/State%20wise%20average%20daily%20nominal%20wage%20rates%20in%20rural%20india%20men%20farm%20labourers.JPG">nominal wage rates</a>, <a href="/upload/files/State%20wise%20growth%20in%20average%20daily%20nominal%20wage%20rates%20in%20rural%20india%20men%20farm%20labourers.JPG" title="/upload/files/State%20wise%20growth%20in%20average%20daily%20nominal%20wage%20rates%20in%20rural%20india%20men%20farm%20labourers.JPG">annual growth in nominal wage rates</a> and <a href="/upload/files/State%20wise%20growth%20in%20average%20daily%20wage%20rates%20in%20real%20terms%20for%20male%20farm%20labourers%20in%20rural%20India.JPG" title="/upload/files/State%20wise%20growth%20in%20average%20daily%20wage%20rates%20in%20real%20terms%20for%20male%20farm%20labourers%20in%20rural%20India.JPG">annual growth in real wage rates</a> for farm labourers in rural areas. </p><p style="text-align:justify"><strong>Non-agricultural wages in rural areas</strong></p><p style="text-align:justify">The rural economy is not just about farming any longer. That is why we have looked at the wage growth in the non-farm sector too. The highest <a href="https://im4change.org/upload/files/State%20wise%20average%20daily%20nominal%20wage%20rates%20in%20rural%20india%20men%20non%20farm%20labourers.JPG" title="https://im4change.org/upload/files/State%20wise%20average%20daily%20nominal%20wage%20rates%20in%20rural%20india%20men%20non%20farm%20labourers.JPG">average daily nominal wage rate for male</a> <a href="https://im4change.org/upload/files/State%20wise%20average%20daily%20nominal%20wage%20rates%20in%20rural%20india%20men%20non%20farm%20labourers.JPG" title="https://im4change.org/upload/files/State%20wise%20average%20daily%20nominal%20wage%20rates%20in%20rural%20india%20men%20non%20farm%20labourers.JPG">non-agricultural labourers</a> in rural India during the period from 2014-15 to 2020-21 was detected in Kerala <em>(Rs. 639.01)</em>, followed by Jammu and Kashmir <em>(Rs. 426.37)</em>, Tamil Nadu <em>(Rs. 405.77)</em>, Haryana <em>(Rs. 359.24)</em>, Himachal Pradesh <em>(Rs. 311.10)</em>, and Punjab <em>(Rs. 309.09)</em>. Please see chart-1.</p><p style="text-align:justify">The lowest average <a href="https://im4change.org/upload/files/State%20wise%20average%20daily%20nominal%20wage%20rates%20in%20rural%20india%20men%20non%20farm%20labourers.JPG" title="https://im4change.org/upload/files/State%20wise%20average%20daily%20nominal%20wage%20rates%20in%20rural%20india%20men%20non%20farm%20labourers.JPG">daily nominal wage rate for male</a> <a href="https://im4change.org/upload/files/State%20wise%20average%20daily%20nominal%20wage%20rates%20in%20rural%20india%20men%20non%20farm%20labourers.JPG" title="https://im4change.org/upload/files/State%20wise%20average%20daily%20nominal%20wage%20rates%20in%20rural%20india%20men%20non%20farm%20labourers.JPG">non-agricultural labourers in rural India</a> during the period from 2014-15 to 2020-21 was found in Madhya Pradesh <em>(Rs. 191.47)</em>, followed by Meghalaya <em>(Rs. 210.26)</em>, Gujarat <em>(Rs. 213.51)</em>, Odisha <em>(Rs. 218.06)</em>, Maharashtra <em>(Rs. 226.70)</em>, Tripura <em>(Rs. 230.36)</em>, Bihar <em>(Rs. 243.51)</em>, and Uttar Pradesh <em>(Rs. 243.97)</em>. The related national level figure was Rs. 273.79 during the period from 2014-15 to 2020-21. Please see chart-1.</p><p style="text-align:justify">The highest <a href="https://im4change.org/upload/files/State%20wise%20growth%20in%20average%20daily%20nominal%20wage%20rates%20in%20rural%20india%20men%20non%20farm%20labourers.JPG" title="https://im4change.org/upload/files/State%20wise%20growth%20in%20average%20daily%20nominal%20wage%20rates%20in%20rural%20india%20men%20non%20farm%20labourers.JPG">average annual growth rate in</a> <a href="https://im4change.org/upload/files/State%20wise%20growth%20in%20average%20daily%20nominal%20wage%20rates%20in%20rural%20india%20men%20non%20farm%20labourers.JPG" title="https://im4change.org/upload/files/State%20wise%20growth%20in%20average%20daily%20nominal%20wage%20rates%20in%20rural%20india%20men%20non%20farm%20labourers.JPG">nominal wage rates</a> during the period from 2015-16 to 2020-21 was noticed in Odisha <em>(8.0 percent)</em>, followed by Madhya Pradesh <em>(7.6 percent)</em>, Assam <em>(6.6 percent)</em>, West Bengal <em>(5.9 percent)</em>, Uttar Pradesh and Andhra Pradesh <em>(5.6 percent each)</em>, and Bihar <em>(5.5 percent)</em>. Kindly consult chart-2.</p><p style="text-align:justify">The lowest <a href="https://im4change.org/upload/files/State%20wise%20growth%20in%20average%20daily%20nominal%20wage%20rates%20in%20rural%20india%20men%20non%20farm%20labourers.JPG" title="https://im4change.org/upload/files/State%20wise%20growth%20in%20average%20daily%20nominal%20wage%20rates%20in%20rural%20india%20men%20non%20farm%20labourers.JPG">average annual growth rate</a> <a href="https://im4change.org/upload/files/State%20wise%20growth%20in%20average%20daily%20nominal%20wage%20rates%20in%20rural%20india%20men%20non%20farm%20labourers.JPG" title="https://im4change.org/upload/files/State%20wise%20growth%20in%20average%20daily%20nominal%20wage%20rates%20in%20rural%20india%20men%20non%20farm%20labourers.JPG">in nominal wage rates</a> during the same period was observed in Kerala <em>(1.8 percent)</em>, followed by Haryana <em>(2.4 percent)</em>, Meghalaya <em>(2.8 percent)</em>, Tamil Nadu and Rajasthan <em>(3.2 percent each)</em>, Tripura and Jammu and Kashmir <em>(4.0 percent each),</em> and Maharashtra and Punjab <em>(4.2 percent each)</em>. Kindly consult chart-2. </p><p style="text-align:justify">The average annual <a href="https://im4change.org/upload/files/State%20wise%20growth%20in%20average%20daily%20wage%20rates%20in%20real%20terms%20for%20male%20non%20farm%20labourers%20in%20rural%20India.JPG" title="https://im4change.org/upload/files/State%20wise%20growth%20in%20average%20daily%20wage%20rates%20in%20real%20terms%20for%20male%20non%20farm%20labourers%20in%20rural%20India.JPG">growth of non-agricultural labourers’</a> <a href="https://im4change.org/upload/files/State%20wise%20growth%20in%20average%20daily%20wage%20rates%20in%20real%20terms%20for%20male%20non%20farm%20labourers%20in%20rural%20India.JPG" title="https://im4change.org/upload/files/State%20wise%20growth%20in%20average%20daily%20wage%20rates%20in%20real%20terms%20for%20male%20non%20farm%20labourers%20in%20rural%20India.JPG">wage rates in real terms</a> during the period from 2015-16 to 2020-21 were negative in Haryana <em>(-1.9 percent)</em>, Jammu and Kashmir <em>(-1.7 percent)</em>, Kerala <em>(-3.5 percent)</em>, Maharashtra <em>(-0.3 percent)</em>, Meghalaya <em>(-1.2 percent)</em>, Punjab <em>(-0.1 percent)</em>, Rajasthan <em>(-1.2 percent)</em>, Tamil Nadu <em>(-2.1 percent)</em>, and Tripura <em>(-1.1 percent)</em>. It should be noted that the <a href="https://im4change.org/upload/files/State-wise%20Average%20Inflation%20CPI%20-%20Inflation.PDF" title="https://im4change.org/upload/files/State-wise%20Average%20Inflation%20CPI%20-%20Inflation.PDF">rate of inflation</a> in <a href="https://im4change.org/upload/files/State-wise%20Average%20Inflation%20CPI%20-%20Inflation.PDF" title="https://im4change.org/upload/files/State-wise%20Average%20Inflation%20CPI%20-%20Inflation.PDF">CPI-General</a> has been used to get the average annual growth of non-agricultural labourers’ wage rates in real terms. Kindly have a look at table-1. </p><p style="text-align:justify">Some states experienced negative growth in <a href="https://im4change.org/upload/files/State%20wise%20growth%20in%20average%20daily%20wage%20rates%20in%20real%20terms%20for%20male%20non%20farm%20labourers%20in%20rural%20India.JPG" title="https://im4change.org/upload/files/State%20wise%20growth%20in%20average%20daily%20wage%20rates%20in%20real%20terms%20for%20male%20non%20farm%20labourers%20in%20rural%20India.JPG">non-agricultural labourers’ wage</a> <a href="https://im4change.org/upload/files/State%20wise%20growth%20in%20average%20daily%20wage%20rates%20in%20real%20terms%20for%20male%20non%20farm%20labourers%20in%20rural%20India.JPG" title="https://im4change.org/upload/files/State%20wise%20growth%20in%20average%20daily%20wage%20rates%20in%20real%20terms%20for%20male%20non%20farm%20labourers%20in%20rural%20India.JPG">rates in real terms</a> for more than two years between 2015-16 and 2020-21. For example, <a href="https://im4change.org/upload/files/State%20wise%20growth%20in%20average%20daily%20wage%20rates%20in%20real%20terms%20for%20male%20non%20farm%20labourers%20in%20rural%20India.JPG" title="https://im4change.org/upload/files/State%20wise%20growth%20in%20average%20daily%20wage%20rates%20in%20real%20terms%20for%20male%20non%20farm%20labourers%20in%20rural%20India.JPG">Haryana</a> experienced negative <a href="https://im4change.org/upload/files/State%20wise%20growth%20in%20average%20daily%20wage%20rates%20in%20real%20terms%20for%20male%20non%20farm%20labourers%20in%20rural%20India.JPG" title="https://im4change.org/upload/files/State%20wise%20growth%20in%20average%20daily%20wage%20rates%20in%20real%20terms%20for%20male%20non%20farm%20labourers%20in%20rural%20India.JPG">growth in wage rates</a> <a href="https://im4change.org/upload/files/State%20wise%20growth%20in%20average%20daily%20wage%20rates%20in%20real%20terms%20for%20male%20non%20farm%20labourers%20in%20rural%20India.JPG" title="https://im4change.org/upload/files/State%20wise%20growth%20in%20average%20daily%20wage%20rates%20in%20real%20terms%20for%20male%20non%20farm%20labourers%20in%20rural%20India.JPG">(in real terms)</a> during 2016-17, 2017-18, 2018-19, 2019-20, and 2020-21. Likewise, <a href="https://im4change.org/upload/files/State%20wise%20growth%20in%20average%20daily%20wage%20rates%20in%20real%20terms%20for%20male%20non%20farm%20labourers%20in%20rural%20India.JPG" title="https://im4change.org/upload/files/State%20wise%20growth%20in%20average%20daily%20wage%20rates%20in%20real%20terms%20for%20male%20non%20farm%20labourers%20in%20rural%20India.JPG">Kerala</a> faced negative growth rates in 2015-16, 2016-17, 2017-18, 2019-20, and 2020-21. </p><p style="text-align:justify">At the national level, the <a href="https://im4change.org/upload/files/State%20wise%20growth%20in%20average%20daily%20wage%20rates%20in%20real%20terms%20for%20male%20non%20farm%20labourers%20in%20rural%20India.JPG" title="https://im4change.org/upload/files/State%20wise%20growth%20in%20average%20daily%20wage%20rates%20in%20real%20terms%20for%20male%20non%20farm%20labourers%20in%20rural%20India.JPG">non-agricultural labourers’</a> <a href="https://im4change.org/upload/files/State%20wise%20growth%20in%20average%20daily%20wage%20rates%20in%20real%20terms%20for%20male%20non%20farm%20labourers%20in%20rural%20India.JPG" title="https://im4change.org/upload/files/State%20wise%20growth%20in%20average%20daily%20wage%20rates%20in%20real%20terms%20for%20male%20non%20farm%20labourers%20in%20rural%20India.JPG">wage rates in real terms</a> on average grew by just 0.3 percent annually during the period from 2015-16 to 2020-21. </p><p style="text-align:justify">Please <a href="https://docs.google.com/spreadsheets/d/1avu0-WtaKV2RHXtz2eiP7iS8znGVBdKC/edit?usp=sharing&ouid=112233925171588304692&rtpof=true&sd=true" title="https://docs.google.com/spreadsheets/d/1avu0-WtaKV2RHXtz2eiP7iS8znGVBdKC/edit?usp=sharing&ouid=112233925171588304692&rtpof=true&sd=true">click here</a> to access the spreadsheet in order to look at the <a href="/upload/files/State%20wise%20average%20daily%20nominal%20wage%20rates%20in%20rural%20india%20men%20non%20farm%20labourers.JPG" title="/upload/files/State%20wise%20average%20daily%20nominal%20wage%20rates%20in%20rural%20india%20men%20non%20farm%20labourers.JPG">trends in nominal wage rates</a>, <a href="/upload/files/State%20wise%20growth%20in%20average%20daily%20nominal%20wage%20rates%20in%20rural%20india%20men%20non%20farm%20labourers.JPG" title="/upload/files/State%20wise%20growth%20in%20average%20daily%20nominal%20wage%20rates%20in%20rural%20india%20men%20non%20farm%20labourers.JPG">annual growth in nominal wage rates</a>, and <a href="/upload/files/State%20wise%20growth%20in%20average%20daily%20wage%20rates%20in%20real%20terms%20for%20male%20non%20farm%20labourers%20in%20rural%20India.JPG" title="/upload/files/State%20wise%20growth%20in%20average%20daily%20wage%20rates%20in%20real%20terms%20for%20male%20non%20farm%20labourers%20in%20rural%20India.JPG">annual growth in real wage rates</a> for non-farm labourers in rural areas. </p><p style="text-align:justify"><strong>Construction sector wages in rural areas</strong></p><p style="text-align:justify">The <a href="https://im4change.org/upload/files/State%20wise%20average%20daily%20nominal%20wage%20rates%20in%20rural%20india%20men%20construction%20workers.JPG" title="https://im4change.org/upload/files/State%20wise%20average%20daily%20nominal%20wage%20rates%20in%20rural%20india%20men%20construction%20workers.JPG">highest average daily nominal wage rates</a> <a href="https://im4change.org/upload/files/State%20wise%20average%20daily%20nominal%20wage%20rates%20in%20rural%20india%20men%20construction%20workers.JPG" title="https://im4change.org/upload/files/State%20wise%20average%20daily%20nominal%20wage%20rates%20in%20rural%20india%20men%20construction%20workers.JPG">for male construction workers in rural India</a> during the period from 2014-15 to 2020-21 was detected in Kerala <em>(Rs. 810.3)</em>, followed by Jammu and Kashmir <em>(Rs. 445.1)</em>, Tamil Nadu <em>(Rs. 424.1)</em>, Haryana <em>(Rs. 379.9)</em>, Himachal Pradesh <em>(Rs. 368.7)</em>, Rajasthan <em>(Rs. 347.7)</em>, and Punjab <em>(Rs. 339.1)</em>. Kindly see chart-1. </p><p style="text-align:justify">The <a href="https://im4change.org/upload/files/State%20wise%20average%20daily%20nominal%20wage%20rates%20in%20rural%20india%20men%20construction%20workers.JPG" title="https://im4change.org/upload/files/State%20wise%20average%20daily%20nominal%20wage%20rates%20in%20rural%20india%20men%20construction%20workers.JPG">lowest average daily nominal wage rates</a> <a href="https://im4change.org/upload/files/State%20wise%20average%20daily%20nominal%20wage%20rates%20in%20rural%20india%20men%20construction%20workers.JPG" title="https://im4change.org/upload/files/State%20wise%20average%20daily%20nominal%20wage%20rates%20in%20rural%20india%20men%20construction%20workers.JPG">for male construction workers in rural areas</a> during the period from 2014-15 to 2020-21 was found in Madhya Pradesh <em>(Rs. 212.4)</em>, followed by Tripura <em>(Rs. 230.4)</em>, Meghalaya <em>(Rs. 231.7)</em>, Odisha <em>(Rs. 247.1)</em>, Gujarat <em>(Rs. 251.8)</em>, Uttar Pradesh <em>(Rs. 267.4)</em>, Bihar <em>(Rs. 270.8)</em>, and West Bengal <em>(Rs. 274.0)</em>. The related national level figure was Rs. 316.9 during the period from 2014-15 to 2020-21. Kindly consult chart-1.</p><p style="text-align:justify">The <a href="https://im4change.org/upload/files/State%20wise%20growth%20in%20average%20daily%20nominal%20wage%20rates%20in%20rural%20india%20men%20construction%20workers.JPG" title="https://im4change.org/upload/files/State%20wise%20growth%20in%20average%20daily%20nominal%20wage%20rates%20in%20rural%20india%20men%20construction%20workers.JPG">highest average annual growth rates in</a> <a href="https://im4change.org/upload/files/State%20wise%20growth%20in%20average%20daily%20nominal%20wage%20rates%20in%20rural%20india%20men%20construction%20workers.JPG" title="https://im4change.org/upload/files/State%20wise%20growth%20in%20average%20daily%20nominal%20wage%20rates%20in%20rural%20india%20men%20construction%20workers.JPG">nominal wage rates</a> during the period from 2015-16 to 2020-21 was noticed in Meghalaya <em>(20.9 percent)</em>, followed by Madhya Pradesh <em>(7.4 percent)</em>, Odisha and Andhra Pradesh <em>(6.8 percent each)</em>, Uttar Pradesh <em>(6.4 percent)</em>, and Bihar <em>(6.2 percent)</em>. Please see chart-2. </p><p style="text-align:justify">The <a href="https://im4change.org/upload/files/State%20wise%20growth%20in%20average%20daily%20nominal%20wage%20rates%20in%20rural%20india%20men%20construction%20workers.JPG" title="https://im4change.org/upload/files/State%20wise%20growth%20in%20average%20daily%20nominal%20wage%20rates%20in%20rural%20india%20men%20construction%20workers.JPG">lowest average annual growth rates in</a> <a href="https://im4change.org/upload/files/State%20wise%20growth%20in%20average%20daily%20nominal%20wage%20rates%20in%20rural%20india%20men%20construction%20workers.JPG" title="https://im4change.org/upload/files/State%20wise%20growth%20in%20average%20daily%20nominal%20wage%20rates%20in%20rural%20india%20men%20construction%20workers.JPG">nominal wage rates</a> during the same period was observed in Kerala <em>(0.9 percent)</em>, followed by Manipur <em>(2.0 percent)</em>, Haryana <em>(2.1 percent)</em>, Jammu and Kashmir <em>(3.0 percent)</em>, Rajasthan <em>(3.2 percent)</em>, and Gujarat <em>(3.6 percent)</em>. Please see chart-2.</p><p style="text-align:justify">The <a href="https://im4change.org/upload/files/State%20wise%20growth%20in%20average%20daily%20wage%20rates%20in%20real%20terms%20for%20male%20construction%20workers%20in%20rural%20India%281%29.JPG" title="https://im4change.org/upload/files/State%20wise%20growth%20in%20average%20daily%20wage%20rates%20in%20real%20terms%20for%20male%20construction%20workers%20in%20rural%20India%281%29.JPG">average annual growth of construction workers’</a> <a href="https://im4change.org/upload/files/State%20wise%20growth%20in%20average%20daily%20wage%20rates%20in%20real%20terms%20for%20male%20construction%20workers%20in%20rural%20India%281%29.JPG" title="https://im4change.org/upload/files/State%20wise%20growth%20in%20average%20daily%20wage%20rates%20in%20real%20terms%20for%20male%20construction%20workers%20in%20rural%20India%281%29.JPG">wage rates in real terms</a> during the period from 2015-16 to 2020-21 was negative in Assam <em>(-1.2 percent)</em>, Haryana <em>(-2.1 percent)</em>, Jammu and Kashmir <em>(-2.7 percent)</em>, Karnataka <em>(-0.6 percent)</em>, Kerala <em>(-4.4 percent)</em>, Manipur <em>(-6.3 percent)</em>, Rajasthan <em>(-1.2 percent)</em>, Tamil Nadu <em>(-0.9 percent)</em>, and Tripura <em>(-1.1 percent)</em>. Please note that the <a href="https://im4change.org/upload/files/State-wise%20Average%20Inflation%20CPI%20-%20Inflation.PDF" title="https://im4change.org/upload/files/State-wise%20Average%20Inflation%20CPI%20-%20Inflation.PDF">rate of inflation</a> in <a href="https://im4change.org/upload/files/State-wise%20Average%20Inflation%20CPI%20-%20Inflation.PDF" title="https://im4change.org/upload/files/State-wise%20Average%20Inflation%20CPI%20-%20Inflation.PDF">CPI-General</a> has been used to get the average annual growth of construction workers’ wage rates in real terms. Kindly have a look at table-1. </p><p style="text-align:justify">In the case of Meghalaya, the <a href="https://im4change.org/upload/files/State%20wise%20average%20daily%20nominal%20wage%20rates%20in%20rural%20india%20men%20construction%20workers.JPG" title="https://im4change.org/upload/files/State%20wise%20average%20daily%20nominal%20wage%20rates%20in%20rural%20india%20men%20construction%20workers.JPG">nominal daily wage rate of male construction</a> <a href="https://im4change.org/upload/files/State%20wise%20average%20daily%20nominal%20wage%20rates%20in%20rural%20india%20men%20construction%20workers.JPG" title="https://im4change.org/upload/files/State%20wise%20average%20daily%20nominal%20wage%20rates%20in%20rural%20india%20men%20construction%20workers.JPG">workers</a> fell from Rs. 186.0 in 2016-17 to Rs. 100.0 in 2017-18 i.e., a decline by -46.2 percent over previous year. However, the same bounced back to Rs. 273.2 in 2018-19 i.e., an increase by 173.2 percent over previous year. In <a href="https://im4change.org/upload/files/State%20wise%20growth%20in%20average%20daily%20wage%20rates%20in%20real%20terms%20for%20male%20construction%20workers%20in%20rural%20India%281%29.JPG" title="https://im4change.org/upload/files/State%20wise%20growth%20in%20average%20daily%20wage%20rates%20in%20real%20terms%20for%20male%20construction%20workers%20in%20rural%20India%281%29.JPG">real terms, the construction sector</a> <a href="https://im4change.org/upload/files/State%20wise%20growth%20in%20average%20daily%20wage%20rates%20in%20real%20terms%20for%20male%20construction%20workers%20in%20rural%20India%281%29.JPG" title="https://im4change.org/upload/files/State%20wise%20growth%20in%20average%20daily%20wage%20rates%20in%20real%20terms%20for%20male%20construction%20workers%20in%20rural%20India%281%29.JPG">wage rate in Meghalaya</a> grew by -47.7 percent in 2017-18 <em>(over previous year)</em> and 171.0 percent in 2018-19 <em>(over previous year)</em>.</p><p style="text-align:justify">Some states experienced negative <a href="https://im4change.org/upload/files/State%20wise%20growth%20in%20average%20daily%20wage%20rates%20in%20real%20terms%20for%20male%20construction%20workers%20in%20rural%20India%281%29.JPG" title="https://im4change.org/upload/files/State%20wise%20growth%20in%20average%20daily%20wage%20rates%20in%20real%20terms%20for%20male%20construction%20workers%20in%20rural%20India%281%29.JPG">growth in construction workers’</a> <a href="https://im4change.org/upload/files/State%20wise%20growth%20in%20average%20daily%20wage%20rates%20in%20real%20terms%20for%20male%20construction%20workers%20in%20rural%20India%281%29.JPG" title="https://im4change.org/upload/files/State%20wise%20growth%20in%20average%20daily%20wage%20rates%20in%20real%20terms%20for%20male%20construction%20workers%20in%20rural%20India%281%29.JPG">wage rates in real terms</a> for more than two years between 2015-16 and 2020-21. For example, <a href="https://im4change.org/upload/files/State%20wise%20growth%20in%20average%20daily%20wage%20rates%20in%20real%20terms%20for%20male%20construction%20workers%20in%20rural%20India%281%29.JPG" title="https://im4change.org/upload/files/State%20wise%20growth%20in%20average%20daily%20wage%20rates%20in%20real%20terms%20for%20male%20construction%20workers%20in%20rural%20India%281%29.JPG">Assam</a> experienced negative growth in wage rates <em>(in real terms)</em> during 2017-18, 2018-19, 2019-20, and 2020-21. </p><p style="text-align:justify">At the national level, the <a href="https://im4change.org/upload/files/State%20wise%20growth%20in%20average%20daily%20wage%20rates%20in%20real%20terms%20for%20male%20construction%20workers%20in%20rural%20India%281%29.JPG" title="https://im4change.org/upload/files/State%20wise%20growth%20in%20average%20daily%20wage%20rates%20in%20real%20terms%20for%20male%20construction%20workers%20in%20rural%20India%281%29.JPG">construction workers’ wage rates in real terms</a> on average grew by just 0.1 percent annually during the period from 2015-16 to 2020-21.</p><p style="text-align:justify">Kindly <a href="https://docs.google.com/spreadsheets/d/1avu0-WtaKV2RHXtz2eiP7iS8znGVBdKC/edit?usp=sharing&ouid=112233925171588304692&rtpof=true&sd=true" title="https://docs.google.com/spreadsheets/d/1avu0-WtaKV2RHXtz2eiP7iS8znGVBdKC/edit?usp=sharing&ouid=112233925171588304692&rtpof=true&sd=true">click here</a> to access the spreadsheet in order to look at the <a href="/upload/files/State%20wise%20average%20daily%20nominal%20wage%20rates%20in%20rural%20india%20men%20construction%20workers.JPG" title="/upload/files/State%20wise%20average%20daily%20nominal%20wage%20rates%20in%20rural%20india%20men%20construction%20workers.JPG">trends in nominal wage rates</a>, <a href="/upload/files/State%20wise%20growth%20in%20average%20daily%20nominal%20wage%20rates%20in%20rural%20india%20men%20construction%20workers.JPG" title="/upload/files/State%20wise%20growth%20in%20average%20daily%20nominal%20wage%20rates%20in%20rural%20india%20men%20construction%20workers.JPG">annual growth in nominal wage rates</a>, and <a href="/upload/files/State%20wise%20growth%20in%20average%20daily%20wage%20rates%20in%20real%20terms%20for%20male%20construction%20workers%20in%20rural%20India%281%29.JPG" title="/upload/files/State%20wise%20growth%20in%20average%20daily%20wage%20rates%20in%20real%20terms%20for%20male%20construction%20workers%20in%20rural%20India%281%29.JPG">annual growth in real wage rates</a> for construction workers in rural areas. </p><p style="text-align:justify"><strong>Data collection methodology</strong></p><p style="text-align:justify">As a part of Rural Labour Enquiry, the <a href="https://im4change.org/upload/files/ilj_feb_2013.pdf" title="https://im4change.org/upload/files/ilj_feb_2013.pdf">daily wage rates</a> in respect of eighteen agricultural and non-agricultural occupations are being collected along with rural retail price data by the Field Operations Division of the National Sample Survey Organisation since 1986-87, according to a February 2013 <a href="https://im4change.org/upload/files/ilj_feb_2013.pdf" title="https://im4change.org/upload/files/ilj_feb_2013.pdf">edition of the Indian Labour Journal</a>. On the recommendations of the Governing Council of the National Sample Survey Organisation in its 61st meeting, the <a href="https://im4change.org/upload/files/ilj_feb_2013.pdf" title="https://im4change.org/upload/files/ilj_feb_2013.pdf">Labour Bureau</a> started the compilation and analysis of wage rate data with effect from April, 1998. </p><p style="text-align:justify">The Field Operations Division of the National Sample Survey Organisation has been entrusted with the work of <a href="https://im4change.org/upload/files/METHOLOGY%20FOR%20COMPILATION%20OF%20THE%20WAGE%20RATE%20DATA.pdf" title="https://im4change.org/upload/files/METHOLOGY%20FOR%20COMPILATION%20OF%20THE%20WAGE%20RATE%20DATA.pdf">data collection</a>. The <a href="https://im4change.org/upload/files/METHOLOGY%20FOR%20COMPILATION%20OF%20THE%20WAGE%20RATE%20DATA.pdf" title="https://im4change.org/upload/files/METHOLOGY%20FOR%20COMPILATION%20OF%20THE%20WAGE%20RATE%20DATA.pdf">wage rate data</a> are being collected along with rural retail prices from 600 sample villages spread over 66 NSS regions of 20 States by canvassing Block-5 <em>(Annexure-I)</em> of Schedule 3.01(R). The data collection from these sample villages is staggered over the four weeks of a month with one-fourth of them being covered every week. The days of canvassing of Schedule 3.01(R) are fixed. The village functionaries like the Panchayat Secretary, Progress Assistant, Patwari and other Village or Block Officials are the primary informants for collection of data on wage rates. The data on normal working hours and the prevailing wage rates in cash and kind for the reported working hours are collected sex-wise for each of the 18 selected occupations in 20 states, indicates an old <a href="https://im4change.org/upload/files/METHOLOGY%20FOR%20COMPILATION%20OF%20THE%20WAGE%20RATE%20DATA.pdf" title="https://im4change.org/upload/files/METHOLOGY%20FOR%20COMPILATION%20OF%20THE%20WAGE%20RATE%20DATA.pdf">document</a> of the Labour Bureau. </p><p style="text-align:justify">The wage rates are sometimes reported for a duration that is less/more than the normal working hours. In such cases, they are <a href="https://im4change.org/upload/files/METHOLOGY%20FOR%20COMPILATION%20OF%20THE%20WAGE%20RATE%20DATA.pdf" title="https://im4change.org/upload/files/METHOLOGY%20FOR%20COMPILATION%20OF%20THE%20WAGE%20RATE%20DATA.pdf">first normalised for eight hours</a> working day. As regards the mode of payment of wages, it is made in both ways i.e., in cash and/or in kind. The payments made in kind are very common in rural areas, which include foodgrains, cooked food, tea, fuel, cigarette, beedi, fodder, etc. The wages reported in kind are evaluated at local retail prices. Thereafter, the data is thoroughly scrutinised and discrepant points are referred back to the field for clarification. In the next stage, the simple arithmetic average of these normalised daily wage rates is worked out occupation-wise and sex-wise for each state.</p><p style="text-align:justify"><a href="http://ras.org.in/methodology_of_data_collection_unsuited_to_changing_rural_reality" title="http://ras.org.in/methodology_of_data_collection_unsuited_to_changing_rural_reality">Up to June 2000</a>, the average wage rates at the national level were derived by taking the simple average of state figures; since July 2000, the averages have been obtained by dividing the sum total of wages of all 20 states by the number of centres or villages from which data were collected. The state-wise averages are restricted only to those occupations where the number of centres is five or more to avoid abnormal fluctuations and inconsistency in wages paid to different categories of workers on account of varying numbers of centres. However, in order to calculate the all-India averages, all neglected centres are taken into account to arrive at the total number of centres at the national level.</p><p style="text-align:justify">The <a href="/upload/files/RBI%20note%20Average%20Daily%20Wage%20rate%20Methodology.pdf" title="/upload/files/RBI%20note%20Average%20Daily%20Wage%20rate%20Methodology.pdf">Reserve Bank of India</a> <em>(whose data we have used in writing this news alert)</em> has collated and is releasing monthly time series data on rural wage rates based on the data published by the Labour Bureau, Government of India. Starting from November 2013 the Labour Bureau is collecting the rural wage data in respect of 12 agricultural and 13 non-agricultural occupations across 20 major states, namely, Andhra Pradesh, Assam, Bihar, Gujarat, Haryana, Himachal Pradesh, Jammu & Kashmir, Karnataka, Kerala, Madhya Pradesh, Maharashtra, Manipur, Meghalaya, Orissa, Punjab, Rajasthan, Tamil Nadu, Tripura, Uttar Pradesh and West Bengal. The occupations for which the daily wage rates are collected every month are: <u>(A) Agricultural occupations</u> – (1) Ploughing/ Tilling workers, (2) Sowing <em>(including planting/ Transplanting/ Weeding)</em> workers, (3) Harvesting/ Winnowing/ Threshing workers, (4) Picking workers <em>(including Tea, Cotton, Tobacco and other commercial crops)</em>, (5) Horticulture workers <em>(including nursery growers)</em>, (6) Fishermen-inland, (7) Fishermen coastal/deep-sea, (8) Loggers and wood cutters, (9) Animal husbandry workers <em>(including poultry workers, dairy workers and herdsman)</em>, (10) Packaging labourers, agriculture, (11) General agricultural labourers <em>(including watering/ irrigation workers, etc.)</em>, (12) Plant protection workers <em>(applying pesticides, treating seeds, etc.)</em>; and <u>(B) Non-agricultural occupations</u> – (13) Carpenter, (14) Blacksmith, (15) Mason, (16) Weavers, (17) Beedi makers, (18) Bamboo, cane basket weavers, (19) Handicraft workers, (20) Plumbers, (21) Electrician, (22) Construction workers <em>(for roads, dams, industrial & project construction work and Well diggers)</em>, (23) LMV & Tractor drivers, (24) Non-agricultural labourers <em>(including porters, loaders)</em>, and (25) Sweeping/cleaning workers. </p><p style="text-align:justify"><strong><em>References </em></strong></p><p style="text-align:justify">Handbook of Statistics on Indian States 2020-21, released in November 2021, please <a href="https://m.rbi.org.in/scripts/AnnualPublications.aspx?head=Handbook%20of%20Statistics%20on%20Indian%20States" title="https://m.rbi.org.in/scripts/AnnualPublications.aspx?head=Handbook%20of%20Statistics%20on%20Indian%20States">click here</a> to access</p><p style="text-align:justify">State-wise Average Daily Wage Rates in Rural India (Men - General Agricultural Labourers), RBI Handbook of Statistics on Indian States 2020-21, released in November 2021, please <a href="/upload/files/State-wise%20Average%20Daily%20Wage%20Rates%20in%20Rural%20India%20Men%20-%20General%20Agricultural%20Labourers.PDF" title="/upload/files/State-wise%20Average%20Daily%20Wage%20Rates%20in%20Rural%20India%20Men%20-%20General%20Agricultural%20Labourers.PDF">click here</a> to access </p><p style="text-align:justify">State-wise Average Daily Wage Rates in Rural India (Men - Non-Agricultural Labourers), RBI Handbook of Statistics on Indian States 2020-21, released in November 2021, please <a href="/upload/files/State-wise%20Average%20Daily%20Wage%20Rates%20in%20Rural%20India%20Men%20-%20Non%20Agricultural%20Labourers.PDF" title="/upload/files/State-wise%20Average%20Daily%20Wage%20Rates%20in%20Rural%20India%20Men%20-%20Non%20Agricultural%20Labourers.PDF">click here</a> to access </p><p style="text-align:justify">State-wise Average Daily Wage Rates in Rural India (Men - Construction Workers), RBI Handbook of Statistics on Indian States 2020-21, released in November 2021, please <a href="/upload/files/State-wise%20Average%20Daily%20Wage%20Rates%20in%20Rural%20India%20Men%20-%20Construction%20Workers.PDF" title="/upload/files/State-wise%20Average%20Daily%20Wage%20Rates%20in%20Rural%20India%20Men%20-%20Construction%20Workers.PDF">click here</a> to access </p><p style="text-align:justify">State-wise Average Inflation (CPI) - Inflation, RBI Handbook of Statistics on Indian States 2020-21, released in November 2021, please <a href="/upload/files/State-wise%20Average%20Inflation%20CPI%20-%20Inflation.PDF" title="/upload/files/State-wise%20Average%20Inflation%20CPI%20-%20Inflation.PDF">click here</a> to access </p><p style="text-align:justify">Indian Labour Journal, February 2013, please <a href="/upload/files/ilj_feb_2013.pdf" title="/upload/files/ilj_feb_2013.pdf">click here</a> to access </p><p style="text-align:justify">Wage Rates in Rural India 2003-04: Methodology for Compilation of the Wage Rate Data, Labour Bureau, please <a href="/upload/files/METHOLOGY%20FOR%20COMPILATION%20OF%20THE%20WAGE%20RATE%20DATA.pdf" title="/upload/files/METHOLOGY%20FOR%20COMPILATION%20OF%20THE%20WAGE%20RATE%20DATA.pdf">click here</a> to access </p><p style="text-align:justify">Average Daily Wage Rates in Rural India: Methodology and coverage (From November 2013), Reserve Bank of India, please <a href="https://dbie.rbi.org.in" title="https://dbie.rbi.org.in">click here</a> and <a href="/upload/files/RBI%20note%20Average%20Daily%20Wage%20rate%20Methodology%281%29.pdf" title="/upload/files/RBI%20note%20Average%20Daily%20Wage%20rate%20Methodology%281%29.pdf">here</a> to access </p><p style="text-align:justify">Consumer Price Index Numbers on Base 2012=100 for Rural, Urban and Combined for the month of January 2022, Ministry of Statistics and Programme Implementation (MoSPI), National Statistical Office (NSO), released on 14th February 2022, please <a href="/upload/files/CPI%20Press%20Release%20January%202022%281%29.pdf" title="/upload/files/CPI%20Press%20Release%20January%202022%281%29.pdf">click here</a> to access </p><p style="text-align:justify">Methodology of Data Collection Unsuited to Changing Rural Reality: A Study of Agricultural Wage Data in India -Yoshifumi Usami, Arindam Das, and Madhura Swaminathan, Review of Agrarian Studies, Vol. 10, No. 2, July-December, 2020, please <a href="http://ras.org.in/methodology_of_data_collection_unsuited_to_changing_rural_reality" title="http://ras.org.in/methodology_of_data_collection_unsuited_to_changing_rural_reality">click here</a> to access</p><p>Russia-ukraine crisis to push up fertiliser prices, govt subsidies, IANS/ Business Standard, 4 March, 2022, please <a href="https://www.business-standard.com/article/economy-policy/russia-ukraine-crisis-to-push-up-fertiliser-prices-govt-subsidies-122030400560_1.html" title="https://www.business-standard.com/article/economy-policy/russia-ukraine-crisis-to-push-up-fertiliser-prices-govt-subsidies-122030400560_1.html">click here</a> to access </p><p>Cooking oil prices spike in India due to Russia-ukraine crisis -B Krishna Mohan, TelanganaToday.com, 3 March, 2022, please <a href="https://telanganatoday.com/cooking-oil-prices-spike-in-india-due-to-russia-ukraine-crisis" title="https://telanganatoday.com/cooking-oil-prices-spike-in-india-due-to-russia-ukraine-crisis">click here</a> to access </p><p>Govt reviews cooking oil imports as ukraine crisis disrupts supplies, prices shoot up -Amiti Sen and Prabhudutta Mishra, The Hindu Business Line, 4 March, 2022, please <a href="https://www.thehindubusinessline.com/markets/commodities/govt-reviews-cooking-oil-imports-as-ukraine-crisis-disrupts-supplies-prices-shoot-up/article65190879.ece" title="https://www.thehindubusinessline.com/markets/commodities/govt-reviews-cooking-oil-imports-as-ukraine-crisis-disrupts-supplies-prices-shoot-up/article65190879.ece">click here</a> to access </p><p>India's Economy Faces A Potential Stagflation Risk From Ukraine War -Sunil Prabhu, NDTV.com, 1 March, 2022, please <a href="https://www.ndtv.com/business/indias-economy-faces-a-potential-stagflation-risk-from-ukraine-war-2796624" title="https://www.ndtv.com/business/indias-economy-faces-a-potential-stagflation-risk-from-ukraine-war-2796624">click here</a> to access</p><p>India to be one of Asia’s ‘biggest losers’ from the Ukraine war as Russia slammed by global sanctions -Paran Balakrishnan, The Telegraph, 1 March, 2022, please <a href="https://www.telegraphindia.com/business/russia-ukraine-crisis-india-to-be-one-of-asias-biggest-losers-from-the-ukraine-war-as-russia-slammed-by-global-sanctions/cid/1854032" title="https://www.telegraphindia.com/business/russia-ukraine-crisis-india-to-be-one-of-asias-biggest-losers-from-the-ukraine-war-as-russia-slammed-by-global-sanctions/cid/1854032">click here</a> to access</p><p>Crude Oil Prices Rise, Tracking Russia-Ukraine Conflict -Rahul Karunakar, NDTV.com <em>(with inputs from Agencies)</em>, 1 March, 2022, please <a href="https://www.ndtv.com/business/crude-oil-prices-rise-on-tuesday-tracking-russia-ukraine-conflict-2796187" title="https://www.ndtv.com/business/crude-oil-prices-rise-on-tuesday-tracking-russia-ukraine-conflict-2796187">click here</a> to access</p><p>Cooking Oil May Become Costlier Due to Russia-ukraine War. Know Why, News18.com, 27 February, 2022, please <a href="https://www.news18.com/news/business/markets/cooking-oil-may-become-costlier-due-to-russia-ukraine-war-know-why-4812740.html" title="https://www.news18.com/news/business/markets/cooking-oil-may-become-costlier-due-to-russia-ukraine-war-know-why-4812740.html">click here</a> to access </p><p style="text-align:justify"><strong>Image Courtesy: Inclusive Media for Change/ Shambhu Ghatak</strong></p> </font>
</td>
</tr>
<tr>
<td> </td>
</tr>
<tr>
<td height="50" style="border-top:1px solid #000; border-bottom:1px solid #000;padding-top:10px;">
<form><input type="button" value=" Print this page "
onclick="window.print();return false;"/></form>
</td>
</tr>
</table></body>
</html>'
}
$reasonPhrase = 'OK'
header - [internal], line ??
Cake\Http\ResponseEmitter::emitStatusLine() - CORE/src/Http/ResponseEmitter.php, line 148
Cake\Http\ResponseEmitter::emit() - CORE/src/Http/ResponseEmitter.php, line 54
Cake\Http\Server::emit() - CORE/src/Http/Server.php, line 141
[main] - ROOT/webroot/index.php, line 39
Warning (2): Cannot modify header information - headers already sent by (output started at /home/brlfuser/public_html/vendor/cakephp/cakephp/src/Error/Debugger.php:853) [CORE/src/Http/ResponseEmitter.php, line 181]
$response = object(Cake\Http\Response) {
'status' => (int) 200,
'contentType' => 'text/html',
'headers' => [
'Content-Type' => [
[maximum depth reached]
]
],
'file' => null,
'fileRange' => [],
'cookies' => object(Cake\Http\Cookie\CookieCollection) {},
'cacheDirectives' => [],
'body' => '<!DOCTYPE html PUBLIC "-//W3C//DTD XHTML 1.0 Transitional//EN"
"http://www.w3.org/TR/xhtml1/DTD/xhtml1-transitional.dtd">
<html xmlns="http://www.w3.org/1999/xhtml">
<head>
<link rel="canonical" href="https://im4change.in/<pre class="cake-error"><a href="javascript:void(0);" onclick="document.getElementById('cakeErr67edc2d06b76a-trace').style.display = (document.getElementById('cakeErr67edc2d06b76a-trace').style.display == 'none' ? '' : 'none');"><b>Notice</b> (8)</a>: Undefined variable: urlPrefix [<b>APP/Template/Layout/printlayout.ctp</b>, line <b>8</b>]<div id="cakeErr67edc2d06b76a-trace" class="cake-stack-trace" style="display: none;"><a href="javascript:void(0);" onclick="document.getElementById('cakeErr67edc2d06b76a-code').style.display = (document.getElementById('cakeErr67edc2d06b76a-code').style.display == 'none' ? '' : 'none')">Code</a> <a href="javascript:void(0);" onclick="document.getElementById('cakeErr67edc2d06b76a-context').style.display = (document.getElementById('cakeErr67edc2d06b76a-context').style.display == 'none' ? '' : 'none')">Context</a><pre id="cakeErr67edc2d06b76a-code" class="cake-code-dump" style="display: none;"><code><span style="color: #000000"><span style="color: #0000BB"></span><span style="color: #007700"><</span><span style="color: #0000BB">head</span><span style="color: #007700">>
</span></span></code>
<span class="code-highlight"><code><span style="color: #000000"> <link rel="canonical" href="<span style="color: #0000BB"><?php </span><span style="color: #007700">echo </span><span style="color: #0000BB">Configure</span><span style="color: #007700">::</span><span style="color: #0000BB">read</span><span style="color: #007700">(</span><span style="color: #DD0000">'SITE_URL'</span><span style="color: #007700">); </span><span style="color: #0000BB">?><?php </span><span style="color: #007700">echo </span><span style="color: #0000BB">$urlPrefix</span><span style="color: #007700">;</span><span style="color: #0000BB">?><?php </span><span style="color: #007700">echo </span><span style="color: #0000BB">$article_current</span><span style="color: #007700">-></span><span style="color: #0000BB">category</span><span style="color: #007700">-></span><span style="color: #0000BB">slug</span><span style="color: #007700">; </span><span style="color: #0000BB">?></span>/<span style="color: #0000BB"><?php </span><span style="color: #007700">echo </span><span style="color: #0000BB">$article_current</span><span style="color: #007700">-></span><span style="color: #0000BB">seo_url</span><span style="color: #007700">; </span><span style="color: #0000BB">?></span>.html"/>
</span></code></span>
<code><span style="color: #000000"><span style="color: #0000BB"> </span><span style="color: #007700"><</span><span style="color: #0000BB">meta http</span><span style="color: #007700">-</span><span style="color: #0000BB">equiv</span><span style="color: #007700">=</span><span style="color: #DD0000">"Content-Type" </span><span style="color: #0000BB">content</span><span style="color: #007700">=</span><span style="color: #DD0000">"text/html; charset=utf-8"</span><span style="color: #007700">/>
</span></span></code></pre><pre id="cakeErr67edc2d06b76a-context" class="cake-context" style="display: none;">$viewFile = '/home/brlfuser/public_html/src/Template/Layout/printlayout.ctp'
$dataForView = [
'article_current' => object(App\Model\Entity\Article) {
'id' => (int) 62349,
'title' => 'Real wage rates of the rural workers hardly increased during the last 6 years',
'subheading' => null,
'description' => '<p style="text-align:justify">In the absence of income or expenditure-based headcount ratio, the growth in the real wages <em>(i.e., nominal wages adjusted against retail inflation)</em> of the manual workers is considered to be a good proxy to assess the trends in poverty. This is because the manual, unskilled/ semi-skilled labourers exist at the bottom of the pyramid or economic hierarchy, and most of them belong to the social categories Scheduled Castes (SCs) and Scheduled Tribes (STs). A positive growth in their real wages <em>(or real wage rates) </em>is anticipated to improve their purchasing power <em>(i.e., income or consumption expenditure)</em> and lift them out of the poverty trap. &nbsp;</p>
<p style="text-align:justify">Clearly, there exists inter-state differences in nominal wage rates, growth in nominal wage rates and growth in real wage rates, which we will see in this news alert.&nbsp;</p>
<p style="text-align:justify">Against the backdrop of the <a href="https://www.thehindubusinessline.com/markets/commodities/govt-reviews-cooking-oil-imports-as-ukraine-crisis-disrupts-supplies-prices-shoot-up/article65190879.ece">Russia-Ukraine conflict</a>, which is anticipated to cause both <a href="https://www.ndtv.com/business/indias-economy-faces-a-potential-stagflation-risk-from-ukraine-war-2796624">food and fuel retail inflation</a> in India in the coming times, it is even more important to look at the past trends in wage rate growth of the rural workers. It should be noted that the <a href="https://public.flourish.studio/visualisation/8706137">year-on-year inflation</a> in <a href="https://public.flourish.studio/visualisation/8706137">Consumer</a> <a href="https://public.flourish.studio/visualisation/8706137">Price Index Rural</a> exceeded the <a href="https://public.flourish.studio/visualisation/8706137">year-on-year inflation</a> in <a href="https://public.flourish.studio/visualisation/8706137">CPI Urban</a> during January 2022 at the national level. Even before the beginning of Russia-Ukraine conflict <em>(i.e., during January 2022)</em>, in rural areas, <a href="https://im4change.org/upload/files/CPI%20Press%20Release%20January%202022%281%29.pdf">retail inflation rate of 20.6 percent</a> was noticed for &#39;oils and fats&#39;, aside from&nbsp;<a href="https://im4change.org/upload/files/CPI%20Press%20Release%20January%202022%281%29.pdf">8.44 percent retail inflation for &#39;fuel and light&#39;</a>, <a href="https://im4change.org/upload/files/CPI%20Press%20Release%20January%202022%281%29.pdf">8.27 percent</a> for &#39;transport and communication&#39;, and <a href="https://im4change.org/upload/files/CPI%20Press%20Release%20January%202022%281%29.pdf">9.65 percent for &#39;clothing and footwear&#39;</a>.&nbsp; &nbsp;&nbsp;</p>
<p style="text-align:justify">At the national level, the average daily nominal wage rate&nbsp;for male construction workers in rural areas during the period from 2014-15 to 2020-21 was Rs. 316.9, which was greater than that of the male non-farm workers in rural areas. The average daily nominal wage rate&nbsp;for male non-agricultural labourers in rural areas during the period from 2014-15 to 2020-21 was Rs. 273.8, which exceeded the average daily nominal wage rates for male farm labourers in rural areas <em>(i.e., Rs. 265.1)</em>. However, in Andhra Pradesh, Haryana, Himachal Pradesh, Jammu and Kashmir,&nbsp;Karnataka, Kerala, Meghalaya, Punjab, and Tripura, the average daily nominal wage rates for male agricultural labourers in rural areas during the period from 2014-15 to 2020-21 exceeded the average daily nominal wage rates for male non-farm labourers in rural areas. Please see chart-1.</p>
<p style="text-align:justify"><img alt="" src="/upload/images/Chart%201.png" style="height:670px; width:1000px" /></p>
<p style="text-align:justify"><em><strong>Notes:</strong> The average (i.e., arithmetic mean) daily nominal wage rates for various categories of workers in rural India in the period from 2014-15 to 2020-21 has been calculated by the Inclusive Media for Change staff</em></p>
<p style="text-align:justify"><em>Please <a href="https://docs.google.com/spreadsheets/d/1avu0-WtaKV2RHXtz2eiP7iS8znGVBdKC/edit?usp=sharing&amp;ouid=112233925171588304692&amp;rtpof=true&amp;sd=true">click here</a> to access the data in spreadsheet format</em></p>
<p style="text-align:justify"><em><strong>Source:&nbsp;</strong>Handbook of Statistics on Indian States 2020-21, released in November 2021, please <a href="https://m.rbi.org.in/scripts/AnnualPublications.aspx?head=Handbook%20of%20Statistics%20on%20Indian%20States">click here</a> to access</em></p>
<p style="text-align:justify"><em>State-wise Average Daily Wage Rates in Rural India (Men - General Agricultural Labourers), RBI Handbook of Statistics on Indian States 2020-21, released in November 2021, please <a href="/upload/files/State-wise%20Average%20Daily%20Wage%20Rates%20in%20Rural%20India%20Men%20-%20General%20Agricultural%20Labourers.PDF">click here</a> to access&nbsp;</em></p>
<p style="text-align:justify"><em>State-wise Average Daily Wage Rates in Rural India (Men - Non-Agricultural Labourers), RBI Handbook of Statistics on Indian States 2020-21, released in November 2021, please <a href="/upload/files/State-wise%20Average%20Daily%20Wage%20Rates%20in%20Rural%20India%20Men%20-%20Non%20Agricultural%20Labourers.PDF">click here</a> to access&nbsp;</em></p>
<p style="text-align:justify"><em>State-wise Average Daily Wage Rates in Rural India (Men - Construction Workers), RBI Handbook of Statistics on Indian States 2020-21, released in November 2021, please <a href="/upload/files/State-wise%20Average%20Daily%20Wage%20Rates%20in%20Rural%20India%20Men%20-%20Construction%20Workers.PDF">click here</a> to access&nbsp;</em></p>
<p style="text-align:justify"><em>State-wise Average Inflation (CPI) - Inflation, RBI Handbook of Statistics on Indian States 2020-21, released in November 2021, please <a href="/upload/files/State-wise%20Average%20Inflation%20CPI%20-%20Inflation.PDF">click here</a> to access&nbsp;</em></p>
<p style="text-align:justify"><strong>---</strong></p>
<p style="text-align:justify">At the national level, the agricultural nominal wage rate&nbsp;grew faster than the non-farm wage&nbsp;rate&nbsp;on average for male labourers in rural areas during the period from 2015-16 to 2020-21. However, in states like Assam, Bihar, Haryana, Madhya Pradesh, Odisha, Punjab, and West Bengal, the non-farm nominal wage rates grew faster than the farm wage rates on average for male workers in rural areas during the period from 2015-16 to 2020-21. Please see chart-2.&nbsp;</p>
<p style="text-align:justify"><img alt="" src="/upload/images/Chart%202.png" style="height:653px; width:1000px" /></p>
<p style="text-align:justify"><em><strong>Notes: </strong>The average growth in daily nominal wage rates for various categories of workers in rural India in the period from 2015-16 to 2020-21 has been calculated by the Inclusive Media for Change staff</em></p>
<p style="text-align:justify"><em>Please <a href="https://docs.google.com/spreadsheets/d/1avu0-WtaKV2RHXtz2eiP7iS8znGVBdKC/edit?usp=sharing&amp;ouid=112233925171588304692&amp;rtpof=true&amp;sd=true">click here</a> to access the data in spreadsheet format</em></p>
<p style="text-align:justify"><em><strong>Source: </strong>Same as above</em><br />
<strong>---</strong></p>
<p style="text-align:justify">At the national level, the construction sector nominal wage rate&nbsp;grew slower than the non-agricultural wage&nbsp;rate&nbsp;on average for male labourers in rural areas during the period from 2015-16 to 2020-21. However, in states like Andhra Pradesh, Bihar, Himachal Pradesh, Maharashtra, Meghalaya, Punjab,&nbsp;Tamil Nadu, and Uttar Pradesh, the construction sector nominal wage rates grew faster than the non-farm wage rates on average for male workers in rural areas during the period from 2015-16 to 2020-21. Please take a look at chart-2. &nbsp;</p>
<p style="text-align:justify">At the national level, the agricultural wage rate&nbsp;in real terms grew faster than the non-farm wage rate&nbsp;on average for male labourers in rural areas during the period from 2015-16 to 2020-21. However, in states like Assam, Bihar, Haryana, Madhya Pradesh, Odisha, Punjab, and West Bengal, the non-farm wage rates in real terms grew faster than the farm wage rates on average for male workers in rural areas during the period from 2015-16 to 2020-21. Please see table-1.</p>
<p style="text-align:justify"><strong>Table 1: State-wise Growth in Average Daily Wage Rates in Real terms for Male Agricultural Labourers, Male Non-Agricultural Labourers, and Male Construction Workers in Rural India, in %</strong><br />
<img alt="" src="/upload/images/Table%201%20State-wise%20Growth%20in%20Average%20Daily%20Wage%20Rates%20in%20Real%20terms%20for%20Male%20Agricultural%20Labourers%20Male%20Non-Agricultural%20Labourers%20and%20Male%20Construction%20Workers%20in%20Rural%20India%20in%20percent.png" style="height:539px; width:750px" /></p>
<p style="text-align:justify"><em><strong>Notes: </strong>The average growth in daily wage rates in real terms for various categories of workers in rural India in the period from 2015-16 to 2020-21 has been calculated by the Inclusive Media for Change staff</em></p>
<p style="text-align:justify"><em>Please <a href="https://docs.google.com/spreadsheets/d/1avu0-WtaKV2RHXtz2eiP7iS8znGVBdKC/edit?usp=sharing&amp;ouid=112233925171588304692&amp;rtpof=true&amp;sd=true">click here</a> to access the data in spreadsheet format</em></p>
<p style="text-align:justify"><em><strong>Source: </strong>Same as above</em><br />
<strong>---</strong></p>
<p style="text-align:justify">At the national level, the construction sector wage rate&nbsp;in real terms grew slower than the non-agricultural wage rate&nbsp;on average for male labourers in rural areas during the period from 2015-16 to 2020-21. However, in states like Andhra Pradesh, Bihar, Himachal Pradesh, Maharashtra, Meghalaya, Punjab, Tamil Nadu, and Uttar Pradesh, the construction sector wage rates in real terms grew faster than the non-farm wage rates on average for male workers in rural areas during the period from 2015-16 to 2020-21. Please take a look at table-1. &nbsp;</p>
<p style="text-align:justify">In the following paragraphs, we have discussed the trends in agricultural wage rates, non-farm wage rates, and construction sector wage rates <em>(in rural areas)</em> in detail.&nbsp;</p>
<p style="text-align:justify"><strong>Agricultural wages in rural areas</strong></p>
<p style="text-align:justify">The highest <a href="https://im4change.org/upload/files/State%20wise%20average%20daily%20nominal%20wage%20rates%20in%20rural%20india%20men%20farm%20labourers.JPG">average daily nominal wage rate</a> <a href="https://im4change.org/upload/files/State%20wise%20average%20daily%20nominal%20wage%20rates%20in%20rural%20india%20men%20farm%20labourers.JPG">for male agricultural labourers</a> in rural India during the period from 2014-15 to 2020-21 was found in Kerala <em>(Rs. 653.93)</em>, followed by Jammu and Kashmir <em>(Rs. 429.19)</em>, Tamil Nadu <em>(Rs. 385.6)</em>, Haryana <em>(Rs. 368.53)</em>, Himachal Pradesh <em>(Rs. 366.23)</em>, and Punjab <em>(Rs. 325.31)</em>. Please have a look at chart-1.</p>
<p style="text-align:justify">The lowest <a href="https://im4change.org/upload/files/State%20wise%20average%20daily%20nominal%20wage%20rates%20in%20rural%20india%20men%20farm%20labourers.JPG">average daily nominal wage rate</a> <a href="https://im4change.org/upload/files/State%20wise%20average%20daily%20nominal%20wage%20rates%20in%20rural%20india%20men%20farm%20labourers.JPG">for male agricultural labourers</a> in rural India during the period from 2014-15 to 2020-21 was observed in Madhya Pradesh <em>(Rs. 183.97)</em>, followed by Gujarat <em>(Rs. 190.07)</em>, Maharashtra <em>(Rs. 215.71)</em>, Odisha <em>(Rs. 216.87)</em>, Meghalaya <em>(Rs. 219.93)</em>, Bihar <em>(Rs. 230.43)</em>, Uttar Pradesh <em>(Rs. 230.5)</em>, and Assam <em>(Rs. 237.3)</em>. The related national level figure was Rs. 265.09 during the period from 2014-15 to 2020-21. Please consult chart-1.&nbsp;</p>
<p style="text-align:justify">The highest <a href="https://im4change.org/upload/files/State%20wise%20growth%20in%20average%20daily%20nominal%20wage%20rates%20in%20rural%20india%20men%20farm%20labourers.JPG">average annual growth rate in</a> <a href="https://im4change.org/upload/files/State%20wise%20growth%20in%20average%20daily%20nominal%20wage%20rates%20in%20rural%20india%20men%20farm%20labourers.JPG">nominal wage rates</a> during the period from 2015-16 to 2020-21 was found in Karnataka <em>(7.3 percent)</em>, followed by Andhra Pradesh <em>(6.8 percent)</em>, Madhya Pradesh <em>(6.4 percent)</em>, Uttar Pradesh <em>(6.2 percent)</em>, Odisha <em>(6.1 percent)</em>, and Meghalaya <em>(6.0 percent)</em>. Please see chart-2.</p>
<p style="text-align:justify">The lowest <a href="https://im4change.org/upload/files/State%20wise%20growth%20in%20average%20daily%20nominal%20wage%20rates%20in%20rural%20india%20men%20farm%20labourers.JPG">average annual growth rate</a> <a href="https://im4change.org/upload/files/State%20wise%20growth%20in%20average%20daily%20nominal%20wage%20rates%20in%20rural%20india%20men%20farm%20labourers.JPG">in nominal wage rates</a> during the same period was noticed in Haryana <em>(2.1 percent)</em>, followed by Rajasthan <em>(3.3 percent)</em>, Kerala <em>(3.5 percent)</em>, Punjab <em>(3.9 percent)</em>, and Tamil Nadu <em>(4.5 percent)</em>. Please consult chart-2.</p>
<p style="text-align:justify">The average annual <a href="https://im4change.org/upload/files/State%20wise%20growth%20in%20average%20daily%20wage%20rates%20in%20real%20terms%20for%20male%20farm%20labourers%20in%20rural%20India.JPG">growth of agricultural labourers&rsquo;</a> <a href="https://im4change.org/upload/files/State%20wise%20growth%20in%20average%20daily%20wage%20rates%20in%20real%20terms%20for%20male%20farm%20labourers%20in%20rural%20India.JPG">wage rates in real terms</a> during the period from 2015-16 to 2020-21 were negative in Haryana <em>(-2.1 percent)</em>, Jammu and Kashmir <em>(-0.3 percent)</em>, Kerala <em>(-1.7 percent)</em>, Punjab <em>(-0.4 percent)</em>, Rajasthan <em>(-1.1 percent)</em>, Tamil Nadu <em>(-0.8 percent)</em>, Tripura <em>(-0.5 percent)</em>, and West Bengal <em>(-0.1 percent)</em>. It should be noted that the <a href="https://im4change.org/upload/files/State-wise%20Average%20Inflation%20CPI%20-%20Inflation.PDF">rate of inflation</a> in <a href="https://im4change.org/upload/files/State-wise%20Average%20Inflation%20CPI%20-%20Inflation.PDF">Consumer Price Index-General</a> has been used to get the average annual growth of agricultural labourers&rsquo; wage rates in real terms. Kindly consult table-1. &nbsp;</p>
<p style="text-align:justify">Some states witnessed negative <a href="https://im4change.org/upload/files/State%20wise%20growth%20in%20average%20daily%20wage%20rates%20in%20real%20terms%20for%20male%20farm%20labourers%20in%20rural%20India.JPG">growth in agricultural labourers&rsquo;</a> <a href="https://im4change.org/upload/files/State%20wise%20growth%20in%20average%20daily%20wage%20rates%20in%20real%20terms%20for%20male%20farm%20labourers%20in%20rural%20India.JPG">wage rates in real terms</a> for more than two years between 2015-16 and 2020-21. For example, <a href="https://im4change.org/upload/files/State%20wise%20growth%20in%20average%20daily%20wage%20rates%20in%20real%20terms%20for%20male%20farm%20labourers%20in%20rural%20India.JPG">Haryana</a> experienced negative growth in 2015-16, 2016-17, 2017-18, 2019-20, and 2020-21. Likewise, <a href="https://im4change.org/upload/files/State%20wise%20growth%20in%20average%20daily%20wage%20rates%20in%20real%20terms%20for%20male%20farm%20labourers%20in%20rural%20India.JPG">Kerala</a> faced negative growth in 2017-18, 2018-19, 2019-20, and 2020-21. &nbsp;</p>
<p style="text-align:justify">At the national level, the <a href="https://im4change.org/upload/files/State%20wise%20growth%20in%20average%20daily%20wage%20rates%20in%20real%20terms%20for%20male%20farm%20labourers%20in%20rural%20India.JPG">agricultural labourers&rsquo;</a> <a href="https://im4change.org/upload/files/State%20wise%20growth%20in%20average%20daily%20wage%20rates%20in%20real%20terms%20for%20male%20farm%20labourers%20in%20rural%20India.JPG">wage rates in real terms</a> on average grew by 1.0 percent annually during the period from 2015-16 to 2020-21.</p>
<p style="text-align:justify">Please <a href="https://docs.google.com/spreadsheets/d/1avu0-WtaKV2RHXtz2eiP7iS8znGVBdKC/edit?usp=sharing&amp;ouid=112233925171588304692&amp;rtpof=true&amp;sd=true">click here</a> to access the spreadsheet in order to look at the trends in <a href="/upload/files/State%20wise%20average%20daily%20nominal%20wage%20rates%20in%20rural%20india%20men%20farm%20labourers.JPG">nominal wage rates</a>, <a href="/upload/files/State%20wise%20growth%20in%20average%20daily%20nominal%20wage%20rates%20in%20rural%20india%20men%20farm%20labourers.JPG">annual growth in nominal wage rates</a> and <a href="/upload/files/State%20wise%20growth%20in%20average%20daily%20wage%20rates%20in%20real%20terms%20for%20male%20farm%20labourers%20in%20rural%20India.JPG">annual growth in real wage rates</a> for farm labourers in rural areas.&nbsp;</p>
<p style="text-align:justify"><strong>Non-agricultural wages in rural areas</strong></p>
<p style="text-align:justify">The rural economy is not just about farming any longer. That is why we have looked at the wage growth in the non-farm sector too.&nbsp;The highest <a href="https://im4change.org/upload/files/State%20wise%20average%20daily%20nominal%20wage%20rates%20in%20rural%20india%20men%20non%20farm%20labourers.JPG">average daily nominal wage rate for male</a> <a href="https://im4change.org/upload/files/State%20wise%20average%20daily%20nominal%20wage%20rates%20in%20rural%20india%20men%20non%20farm%20labourers.JPG">non-agricultural labourers</a> in rural India during the period from 2014-15 to 2020-21 was detected in Kerala <em>(Rs. 639.01)</em>, followed by Jammu and Kashmir <em>(Rs. 426.37)</em>, Tamil Nadu <em>(Rs. 405.77)</em>, Haryana <em>(Rs. 359.24)</em>, Himachal Pradesh <em>(Rs. 311.10)</em>, and Punjab <em>(Rs. 309.09)</em>. Please see chart-1.</p>
<p style="text-align:justify">The lowest average <a href="https://im4change.org/upload/files/State%20wise%20average%20daily%20nominal%20wage%20rates%20in%20rural%20india%20men%20non%20farm%20labourers.JPG">daily nominal wage rate for male</a> <a href="https://im4change.org/upload/files/State%20wise%20average%20daily%20nominal%20wage%20rates%20in%20rural%20india%20men%20non%20farm%20labourers.JPG">non-agricultural labourers in rural India</a> during the period from 2014-15 to 2020-21 was found in Madhya Pradesh <em>(Rs. 191.47)</em>, followed by Meghalaya <em>(Rs. 210.26)</em>, Gujarat <em>(Rs. 213.51)</em>, Odisha <em>(Rs. 218.06)</em>, Maharashtra <em>(Rs. 226.70)</em>, Tripura <em>(Rs. 230.36)</em>, Bihar <em>(Rs. 243.51)</em>, and Uttar Pradesh <em>(Rs. 243.97)</em>. The related national level figure was Rs. 273.79 during the period from 2014-15 to 2020-21. Please see chart-1.</p>
<p style="text-align:justify">The highest <a href="https://im4change.org/upload/files/State%20wise%20growth%20in%20average%20daily%20nominal%20wage%20rates%20in%20rural%20india%20men%20non%20farm%20labourers.JPG">average annual growth rate in</a> <a href="https://im4change.org/upload/files/State%20wise%20growth%20in%20average%20daily%20nominal%20wage%20rates%20in%20rural%20india%20men%20non%20farm%20labourers.JPG">nominal wage rates</a> during the period from 2015-16 to 2020-21 was noticed in Odisha <em>(8.0 percent)</em>, followed by Madhya Pradesh <em>(7.6 percent)</em>, Assam <em>(6.6 percent)</em>, West Bengal <em>(5.9 percent)</em>, Uttar Pradesh and Andhra Pradesh <em>(5.6 percent each)</em>, and Bihar <em>(5.5 percent)</em>. Kindly consult chart-2.</p>
<p style="text-align:justify">The lowest <a href="https://im4change.org/upload/files/State%20wise%20growth%20in%20average%20daily%20nominal%20wage%20rates%20in%20rural%20india%20men%20non%20farm%20labourers.JPG">average annual growth rate</a> <a href="https://im4change.org/upload/files/State%20wise%20growth%20in%20average%20daily%20nominal%20wage%20rates%20in%20rural%20india%20men%20non%20farm%20labourers.JPG">in nominal wage rates</a> during the same period was observed in Kerala <em>(1.8 percent)</em>, followed by Haryana <em>(2.4 percent)</em>, Meghalaya <em>(2.8 percent)</em>, Tamil Nadu and Rajasthan <em>(3.2 percent each)</em>, Tripura and Jammu and Kashmir <em>(4.0 percent each),</em> and Maharashtra and Punjab <em>(4.2 percent each)</em>. Kindly consult chart-2.&nbsp;</p>
<p style="text-align:justify">The average annual <a href="https://im4change.org/upload/files/State%20wise%20growth%20in%20average%20daily%20wage%20rates%20in%20real%20terms%20for%20male%20non%20farm%20labourers%20in%20rural%20India.JPG">growth of non-agricultural labourers&rsquo;</a> <a href="https://im4change.org/upload/files/State%20wise%20growth%20in%20average%20daily%20wage%20rates%20in%20real%20terms%20for%20male%20non%20farm%20labourers%20in%20rural%20India.JPG">wage rates in real terms</a> during the period from 2015-16 to 2020-21 were negative in Haryana <em>(-1.9 percent)</em>, Jammu and Kashmir <em>(-1.7 percent)</em>, Kerala <em>(-3.5 percent)</em>, Maharashtra <em>(-0.3 percent)</em>, Meghalaya <em>(-1.2 percent)</em>, Punjab <em>(-0.1 percent)</em>, Rajasthan <em>(-1.2 percent)</em>, Tamil Nadu <em>(-2.1 percent)</em>, and Tripura <em>(-1.1 percent)</em>. It should be noted that the <a href="https://im4change.org/upload/files/State-wise%20Average%20Inflation%20CPI%20-%20Inflation.PDF">rate of inflation</a> in <a href="https://im4change.org/upload/files/State-wise%20Average%20Inflation%20CPI%20-%20Inflation.PDF">CPI-General</a> has been used to get the average annual growth of non-agricultural labourers&rsquo; wage rates in real terms. Kindly have a look at table-1. &nbsp;&nbsp;</p>
<p style="text-align:justify">Some states experienced negative growth in <a href="https://im4change.org/upload/files/State%20wise%20growth%20in%20average%20daily%20wage%20rates%20in%20real%20terms%20for%20male%20non%20farm%20labourers%20in%20rural%20India.JPG">non-agricultural labourers&rsquo; wage</a> <a href="https://im4change.org/upload/files/State%20wise%20growth%20in%20average%20daily%20wage%20rates%20in%20real%20terms%20for%20male%20non%20farm%20labourers%20in%20rural%20India.JPG">rates in real terms</a> for more than two years between 2015-16 and 2020-21. For example, <a href="https://im4change.org/upload/files/State%20wise%20growth%20in%20average%20daily%20wage%20rates%20in%20real%20terms%20for%20male%20non%20farm%20labourers%20in%20rural%20India.JPG">Haryana</a> experienced negative <a href="https://im4change.org/upload/files/State%20wise%20growth%20in%20average%20daily%20wage%20rates%20in%20real%20terms%20for%20male%20non%20farm%20labourers%20in%20rural%20India.JPG">growth in wage rates</a> <a href="https://im4change.org/upload/files/State%20wise%20growth%20in%20average%20daily%20wage%20rates%20in%20real%20terms%20for%20male%20non%20farm%20labourers%20in%20rural%20India.JPG"><em>(in real terms)</em></a> during 2016-17, 2017-18, 2018-19, 2019-20, and 2020-21. Likewise, <a href="https://im4change.org/upload/files/State%20wise%20growth%20in%20average%20daily%20wage%20rates%20in%20real%20terms%20for%20male%20non%20farm%20labourers%20in%20rural%20India.JPG">Kerala</a> faced negative growth rates in 2015-16, 2016-17, 2017-18, 2019-20, and 2020-21. &nbsp;</p>
<p style="text-align:justify">At the national level, the&nbsp;<a href="https://im4change.org/upload/files/State%20wise%20growth%20in%20average%20daily%20wage%20rates%20in%20real%20terms%20for%20male%20non%20farm%20labourers%20in%20rural%20India.JPG">non-agricultural labourers&rsquo;</a> <a href="https://im4change.org/upload/files/State%20wise%20growth%20in%20average%20daily%20wage%20rates%20in%20real%20terms%20for%20male%20non%20farm%20labourers%20in%20rural%20India.JPG">wage rates in real terms</a> on average grew by just 0.3 percent annually during the period from 2015-16 to 2020-21.&nbsp;</p>
<p style="text-align:justify">Please <a href="https://docs.google.com/spreadsheets/d/1avu0-WtaKV2RHXtz2eiP7iS8znGVBdKC/edit?usp=sharing&amp;ouid=112233925171588304692&amp;rtpof=true&amp;sd=true">click here</a> to access the spreadsheet in order to look at the <a href="/upload/files/State%20wise%20average%20daily%20nominal%20wage%20rates%20in%20rural%20india%20men%20non%20farm%20labourers.JPG">trends in nominal wage rates</a>, <a href="/upload/files/State%20wise%20growth%20in%20average%20daily%20nominal%20wage%20rates%20in%20rural%20india%20men%20non%20farm%20labourers.JPG">annual growth in nominal wage rates</a>, and <a href="/upload/files/State%20wise%20growth%20in%20average%20daily%20wage%20rates%20in%20real%20terms%20for%20male%20non%20farm%20labourers%20in%20rural%20India.JPG">annual growth in real wage rates</a> for non-farm labourers in rural areas.&nbsp;</p>
<p style="text-align:justify"><strong>Construction sector wages in rural areas</strong></p>
<p style="text-align:justify">The <a href="https://im4change.org/upload/files/State%20wise%20average%20daily%20nominal%20wage%20rates%20in%20rural%20india%20men%20construction%20workers.JPG">highest average daily nominal wage rates</a> <a href="https://im4change.org/upload/files/State%20wise%20average%20daily%20nominal%20wage%20rates%20in%20rural%20india%20men%20construction%20workers.JPG">for male construction workers in rural India</a> during the period from 2014-15 to 2020-21 was detected in Kerala <em>(Rs. 810.3)</em>, followed by Jammu and Kashmir <em>(Rs. 445.1)</em>, Tamil Nadu <em>(Rs. 424.1)</em>, Haryana <em>(Rs. 379.9)</em>, Himachal Pradesh <em>(Rs. 368.7)</em>, Rajasthan <em>(Rs. 347.7)</em>, and Punjab <em>(Rs. 339.1)</em>. Kindly see chart-1.&nbsp;</p>
<p style="text-align:justify">The <a href="https://im4change.org/upload/files/State%20wise%20average%20daily%20nominal%20wage%20rates%20in%20rural%20india%20men%20construction%20workers.JPG">lowest average daily nominal wage rates</a> <a href="https://im4change.org/upload/files/State%20wise%20average%20daily%20nominal%20wage%20rates%20in%20rural%20india%20men%20construction%20workers.JPG">for male construction workers in rural areas</a> during the period from 2014-15 to 2020-21 was found in Madhya Pradesh <em>(Rs. 212.4)</em>, followed by Tripura <em>(Rs. 230.4)</em>, Meghalaya <em>(Rs. 231.7)</em>, Odisha <em>(Rs. 247.1)</em>, Gujarat <em>(Rs. 251.8)</em>, Uttar Pradesh <em>(Rs. 267.4)</em>, Bihar <em>(Rs. 270.8)</em>, and West Bengal <em>(Rs. 274.0)</em>. The related national level figure was Rs. 316.9 during the period from 2014-15 to 2020-21. Kindly consult chart-1.</p>
<p style="text-align:justify">The <a href="https://im4change.org/upload/files/State%20wise%20growth%20in%20average%20daily%20nominal%20wage%20rates%20in%20rural%20india%20men%20construction%20workers.JPG">highest average annual growth rates in</a> <a href="https://im4change.org/upload/files/State%20wise%20growth%20in%20average%20daily%20nominal%20wage%20rates%20in%20rural%20india%20men%20construction%20workers.JPG">nominal wage rates</a> during the period from 2015-16 to 2020-21 was noticed in Meghalaya <em>(20.9 percent)</em>, followed by Madhya Pradesh <em>(7.4 percent)</em>, Odisha and Andhra Pradesh <em>(6.8 percent each)</em>, Uttar Pradesh <em>(6.4 percent)</em>, and Bihar <em>(6.2 percent)</em>. Please see chart-2.&nbsp;</p>
<p style="text-align:justify">The <a href="https://im4change.org/upload/files/State%20wise%20growth%20in%20average%20daily%20nominal%20wage%20rates%20in%20rural%20india%20men%20construction%20workers.JPG">lowest average annual growth rates in</a> <a href="https://im4change.org/upload/files/State%20wise%20growth%20in%20average%20daily%20nominal%20wage%20rates%20in%20rural%20india%20men%20construction%20workers.JPG">nominal wage rates</a> during the same period was observed in Kerala <em>(0.9 percent)</em>, followed by Manipur <em>(2.0 percent)</em>, Haryana <em>(2.1 percent)</em>, Jammu and Kashmir <em>(3.0 percent)</em>, Rajasthan <em>(3.2 percent)</em>, and Gujarat <em>(3.6 percent)</em>. Please see chart-2.</p>
<p style="text-align:justify">The <a href="https://im4change.org/upload/files/State%20wise%20growth%20in%20average%20daily%20wage%20rates%20in%20real%20terms%20for%20male%20construction%20workers%20in%20rural%20India%281%29.JPG">average annual growth of construction workers&rsquo;</a> <a href="https://im4change.org/upload/files/State%20wise%20growth%20in%20average%20daily%20wage%20rates%20in%20real%20terms%20for%20male%20construction%20workers%20in%20rural%20India%281%29.JPG">wage rates in real terms</a> during the period from 2015-16 to 2020-21 was negative in Assam <em>(-1.2 percent)</em>, Haryana <em>(-2.1 percent)</em>, Jammu and Kashmir <em>(-2.7 percent)</em>, Karnataka <em>(-0.6 percent)</em>, Kerala <em>(-4.4 percent)</em>, Manipur <em>(-6.3 percent)</em>, Rajasthan <em>(-1.2 percent)</em>, Tamil Nadu <em>(-0.9 percent)</em>, and Tripura <em>(-1.1 percent)</em>. Please note that the <a href="https://im4change.org/upload/files/State-wise%20Average%20Inflation%20CPI%20-%20Inflation.PDF">rate of inflation</a> in <a href="https://im4change.org/upload/files/State-wise%20Average%20Inflation%20CPI%20-%20Inflation.PDF">CPI-General</a> has been used to get the average annual growth of construction workers&rsquo; wage rates in real terms. Kindly have a look at table-1. &nbsp;&nbsp;</p>
<p style="text-align:justify">In the case of Meghalaya, the <a href="https://im4change.org/upload/files/State%20wise%20average%20daily%20nominal%20wage%20rates%20in%20rural%20india%20men%20construction%20workers.JPG">nominal daily wage rate of male construction</a> <a href="https://im4change.org/upload/files/State%20wise%20average%20daily%20nominal%20wage%20rates%20in%20rural%20india%20men%20construction%20workers.JPG">workers</a> fell from Rs. 186.0 in 2016-17 to Rs. 100.0 in 2017-18 i.e., a decline&nbsp;by -46.2 percent over previous year. However, the same bounced back to Rs. 273.2 in 2018-19 i.e., an increase by 173.2 percent over previous year. In <a href="https://im4change.org/upload/files/State%20wise%20growth%20in%20average%20daily%20wage%20rates%20in%20real%20terms%20for%20male%20construction%20workers%20in%20rural%20India%281%29.JPG">real terms, the construction sector</a> <a href="https://im4change.org/upload/files/State%20wise%20growth%20in%20average%20daily%20wage%20rates%20in%20real%20terms%20for%20male%20construction%20workers%20in%20rural%20India%281%29.JPG">wage rate in Meghalaya</a> grew by -47.7 percent in 2017-18 <em>(over previous year)</em> and 171.0 percent in 2018-19 <em>(over previous year)</em>.</p>
<p style="text-align:justify">Some states experienced negative <a href="https://im4change.org/upload/files/State%20wise%20growth%20in%20average%20daily%20wage%20rates%20in%20real%20terms%20for%20male%20construction%20workers%20in%20rural%20India%281%29.JPG">growth in construction workers&rsquo;</a> <a href="https://im4change.org/upload/files/State%20wise%20growth%20in%20average%20daily%20wage%20rates%20in%20real%20terms%20for%20male%20construction%20workers%20in%20rural%20India%281%29.JPG">wage rates in real terms</a> for more than two years between 2015-16 and 2020-21. For example, <a href="https://im4change.org/upload/files/State%20wise%20growth%20in%20average%20daily%20wage%20rates%20in%20real%20terms%20for%20male%20construction%20workers%20in%20rural%20India%281%29.JPG">Assam</a> experienced negative growth in wage rates <em>(in real terms)</em> during 2017-18, 2018-19, 2019-20, and 2020-21. &nbsp;</p>
<p style="text-align:justify">At the national level, the&nbsp;<a href="https://im4change.org/upload/files/State%20wise%20growth%20in%20average%20daily%20wage%20rates%20in%20real%20terms%20for%20male%20construction%20workers%20in%20rural%20India%281%29.JPG">construction workers&rsquo; wage rates in real terms</a> on average grew by just 0.1 percent annually during the period from 2015-16 to 2020-21.</p>
<p style="text-align:justify">Kindly <a href="https://docs.google.com/spreadsheets/d/1avu0-WtaKV2RHXtz2eiP7iS8znGVBdKC/edit?usp=sharing&amp;ouid=112233925171588304692&amp;rtpof=true&amp;sd=true">click here</a> to access the spreadsheet in order to look at the <a href="/upload/files/State%20wise%20average%20daily%20nominal%20wage%20rates%20in%20rural%20india%20men%20construction%20workers.JPG">trends in nominal wage rates</a>, <a href="/upload/files/State%20wise%20growth%20in%20average%20daily%20nominal%20wage%20rates%20in%20rural%20india%20men%20construction%20workers.JPG">annual growth in nominal wage rates</a>, and <a href="/upload/files/State%20wise%20growth%20in%20average%20daily%20wage%20rates%20in%20real%20terms%20for%20male%20construction%20workers%20in%20rural%20India%281%29.JPG">annual growth in real wage rates</a> for construction workers in rural areas.&nbsp;</p>
<p style="text-align:justify"><strong>Data collection methodology</strong></p>
<p style="text-align:justify">As a part of Rural Labour Enquiry, the&nbsp;<a href="https://im4change.org/upload/files/ilj_feb_2013.pdf">daily wage rates</a> in respect of eighteen agricultural and non-agricultural occupations are being collected along with rural retail price data by the Field Operations Division of the National Sample Survey Organisation since 1986-87, according to a February 2013 <a href="https://im4change.org/upload/files/ilj_feb_2013.pdf">edition of the Indian Labour Journal</a>.&nbsp;On the recommendations of the Governing Council of the National Sample Survey Organisation in its 61st meeting,&nbsp;the <a href="https://im4change.org/upload/files/ilj_feb_2013.pdf">Labour Bureau</a> started the compilation and analysis of wage rate data with effect from April, 1998.&nbsp;</p>
<p style="text-align:justify">The Field Operations Division of the National Sample Survey Organisation has been entrusted with the work of <a href="https://im4change.org/upload/files/METHOLOGY%20FOR%20COMPILATION%20OF%20THE%20WAGE%20RATE%20DATA.pdf">data collection</a>. The <a href="https://im4change.org/upload/files/METHOLOGY%20FOR%20COMPILATION%20OF%20THE%20WAGE%20RATE%20DATA.pdf">wage rate data</a> are being collected along with rural retail prices from 600 sample villages spread over 66 NSS regions of 20 States by canvassing Block-5 <em>(Annexure-I)</em> of Schedule 3.01(R). The data collection from these sample villages is staggered over the four weeks of a month with one-fourth of them being covered every week. The days of canvassing of Schedule 3.01(R) are fixed. The village functionaries like the Panchayat Secretary, Progress Assistant, Patwari and other Village or Block Officials are the primary informants for collection of data on wage rates. The data on normal working hours and the prevailing wage rates in cash and kind for the reported working hours are collected sex-wise for each of the 18 selected occupations in 20 states, indicates an old&nbsp;<a href="https://im4change.org/upload/files/METHOLOGY%20FOR%20COMPILATION%20OF%20THE%20WAGE%20RATE%20DATA.pdf">document</a> of the Labour Bureau. &nbsp;&nbsp;</p>
<p style="text-align:justify">The wage rates are sometimes reported for a duration that is less/more than the normal working hours. In such cases, they are <a href="https://im4change.org/upload/files/METHOLOGY%20FOR%20COMPILATION%20OF%20THE%20WAGE%20RATE%20DATA.pdf">first normalised for eight hours</a> working day. As regards the mode of payment of wages, it is made in both ways i.e., in cash and/or in kind. The payments made in kind are very common in rural areas, which include foodgrains, cooked food, tea, fuel, cigarette, beedi, fodder, etc.&nbsp;The wages reported in kind are evaluated at local retail prices. Thereafter, the data is thoroughly scrutinised and discrepant points are referred back to the field for clarification. In the next stage, the simple arithmetic average of these normalised daily wage rates is worked out occupation-wise and sex-wise for each state.</p>
<p style="text-align:justify"><a href="http://ras.org.in/methodology_of_data_collection_unsuited_to_changing_rural_reality">Up to June 2000</a>, the average wage rates at the national level were derived by taking the simple average of state figures; since July 2000, the averages have been obtained by dividing the sum total of wages of all 20 states by the number of centres or villages from which data were collected. The state-wise averages are restricted only to those occupations where the number of centres is five or more to avoid abnormal fluctuations and inconsistency in wages paid to different categories of workers on account of varying numbers of centres. However, in order to calculate the all-India averages, all neglected centres are taken into account to arrive at the total number of centres at the national level.</p>
<p style="text-align:justify">The <a href="/upload/files/RBI%20note%20Average%20Daily%20Wage%20rate%20Methodology.pdf">Reserve Bank of India</a>&nbsp;<em>(whose data we have used in writing this news alert)</em> has collated and is releasing monthly time series data on rural wage rates based on the data published by the Labour Bureau, Government of India. Starting from November 2013 the Labour Bureau is collecting the rural wage data in respect of 12 agricultural and 13 non-agricultural occupations across 20 major states, namely, Andhra Pradesh, Assam, Bihar, Gujarat, Haryana, Himachal Pradesh, Jammu &amp; Kashmir, Karnataka, Kerala, Madhya Pradesh, Maharashtra, Manipur, Meghalaya, Orissa, Punjab, Rajasthan, Tamil Nadu, Tripura, Uttar Pradesh and West Bengal. The occupations for which the daily wage rates are collected every month are: <u>(A) Agricultural occupations</u> &ndash; (1) &nbsp;Ploughing/ Tilling workers, (2) Sowing <em>(including planting/ Transplanting/ Weeding)</em> workers, (3) Harvesting/ Winnowing/ Threshing workers, (4) Picking workers <em>(including Tea, Cotton, Tobacco and other commercial crops)</em>, (5) Horticulture workers <em>(including nursery growers)</em>, (6) Fishermen-inland, (7) Fishermen coastal/deep-sea, (8) Loggers and wood cutters, (9) Animal husbandry workers <em>(including poultry workers, dairy workers and herdsman)</em>, (10) Packaging labourers, agriculture, (11) General agricultural labourers <em>(including watering/ irrigation workers, etc.)</em>, (12) Plant protection workers <em>(applying pesticides, treating seeds, etc.)</em>; and <u>(B) Non-agricultural occupations</u> &ndash; (13) Carpenter, (14) Blacksmith, (15) Mason, (16) Weavers, (17) Beedi makers, (18) Bamboo, cane basket weavers, (19) Handicraft workers, (20) Plumbers, (21) Electrician, (22) Construction workers <em>(for roads, dams, industrial &amp; project construction work and Well diggers)</em>, (23) LMV &amp; Tractor drivers, (24) Non-agricultural labourers <em>(including porters, loaders)</em>, and (25) Sweeping/cleaning workers.&nbsp;</p>
<p style="text-align:justify"><strong><em>References&nbsp;</em></strong></p>
<p style="text-align:justify">Handbook of Statistics on Indian States 2020-21, released in November 2021, please <a href="https://m.rbi.org.in/scripts/AnnualPublications.aspx?head=Handbook%20of%20Statistics%20on%20Indian%20States">click here</a> to access</p>
<p style="text-align:justify">State-wise Average Daily Wage Rates in Rural India (Men - General Agricultural Labourers), RBI Handbook of Statistics on Indian States 2020-21, released in November 2021, please <a href="/upload/files/State-wise%20Average%20Daily%20Wage%20Rates%20in%20Rural%20India%20Men%20-%20General%20Agricultural%20Labourers.PDF">click here</a> to access&nbsp;</p>
<p style="text-align:justify">State-wise Average Daily Wage Rates in Rural India (Men - Non-Agricultural Labourers), RBI Handbook of Statistics on Indian States 2020-21, released in November 2021, please <a href="/upload/files/State-wise%20Average%20Daily%20Wage%20Rates%20in%20Rural%20India%20Men%20-%20Non%20Agricultural%20Labourers.PDF">click here</a> to access&nbsp;</p>
<p style="text-align:justify">State-wise Average Daily Wage Rates in Rural India (Men - Construction Workers), RBI Handbook of Statistics on Indian States 2020-21, released in November 2021, please <a href="/upload/files/State-wise%20Average%20Daily%20Wage%20Rates%20in%20Rural%20India%20Men%20-%20Construction%20Workers.PDF">click here</a> to access&nbsp;</p>
<p style="text-align:justify">State-wise Average Inflation (CPI) - Inflation, RBI Handbook of Statistics on Indian States 2020-21, released in November 2021, please <a href="/upload/files/State-wise%20Average%20Inflation%20CPI%20-%20Inflation.PDF">click here</a> to access&nbsp;</p>
<p style="text-align:justify">Indian Labour Journal, February 2013, please <a href="/upload/files/ilj_feb_2013.pdf">click here</a> to access &nbsp;</p>
<p style="text-align:justify">Wage Rates in Rural India 2003-04: Methodology for Compilation of the Wage Rate Data, Labour Bureau, please <a href="/upload/files/METHOLOGY%20FOR%20COMPILATION%20OF%20THE%20WAGE%20RATE%20DATA.pdf">click here</a> to access&nbsp; &nbsp;&nbsp;</p>
<p style="text-align:justify">Average Daily Wage Rates in Rural India: Methodology and coverage (From November 2013), Reserve Bank of India, please <a href="https://dbie.rbi.org.in">click here</a>&nbsp;and <a href="/upload/files/RBI%20note%20Average%20Daily%20Wage%20rate%20Methodology%281%29.pdf">here</a> to access&nbsp;</p>
<p style="text-align:justify">Consumer Price Index Numbers on Base 2012=100 for Rural, Urban and Combined for the month of January 2022, Ministry of Statistics and Programme Implementation (MoSPI), National Statistical Office (NSO), released on 14th February 2022, please <a href="/upload/files/CPI%20Press%20Release%20January%202022%281%29.pdf">click here</a> to access&nbsp;</p>
<p style="text-align:justify">Methodology of Data Collection Unsuited to Changing Rural Reality: A Study of Agricultural Wage Data in India -Yoshifumi Usami, Arindam Das, and Madhura Swaminathan, Review of Agrarian Studies, Vol. 10, No. 2, July-December, 2020, please <a href="http://ras.org.in/methodology_of_data_collection_unsuited_to_changing_rural_reality">click here</a> to access</p>
<p>Russia-ukraine crisis to push up fertiliser prices, govt subsidies, IANS/ Business Standard, 4 March, 2022, please <a href="https://www.business-standard.com/article/economy-policy/russia-ukraine-crisis-to-push-up-fertiliser-prices-govt-subsidies-122030400560_1.html">click here</a> to access &nbsp;</p>
<p>Cooking oil prices spike in India due to Russia-ukraine crisis -B Krishna Mohan, TelanganaToday.com, 3 March, 2022, please <a href="https://telanganatoday.com/cooking-oil-prices-spike-in-india-due-to-russia-ukraine-crisis">click here</a> to access &nbsp;</p>
<p>Govt reviews cooking oil imports as ukraine crisis disrupts supplies, prices shoot up -Amiti Sen and Prabhudutta Mishra, The Hindu Business Line, 4 March, 2022, please <a href="https://www.thehindubusinessline.com/markets/commodities/govt-reviews-cooking-oil-imports-as-ukraine-crisis-disrupts-supplies-prices-shoot-up/article65190879.ece">click here</a> to access &nbsp;</p>
<p>India&#39;s Economy Faces A Potential Stagflation Risk From Ukraine War -Sunil Prabhu, NDTV.com, 1 March, 2022, please <a href="https://www.ndtv.com/business/indias-economy-faces-a-potential-stagflation-risk-from-ukraine-war-2796624">click here</a> to access</p>
<p>India to be one of Asia&rsquo;s &lsquo;biggest losers&rsquo; from the Ukraine war as Russia slammed by global sanctions -Paran Balakrishnan, The Telegraph, 1 March, 2022, please <a href="https://www.telegraphindia.com/business/russia-ukraine-crisis-india-to-be-one-of-asias-biggest-losers-from-the-ukraine-war-as-russia-slammed-by-global-sanctions/cid/1854032">click here</a> to access</p>
<p>Crude Oil Prices Rise, Tracking Russia-Ukraine Conflict -Rahul Karunakar, NDTV.com <em>(with inputs from Agencies)</em>, 1 March, 2022, please <a href="https://www.ndtv.com/business/crude-oil-prices-rise-on-tuesday-tracking-russia-ukraine-conflict-2796187">click here</a> to access</p>
<p>Cooking Oil May Become Costlier Due to Russia-ukraine War. Know Why, News18.com, 27 February, 2022, please <a href="https://www.news18.com/news/business/markets/cooking-oil-may-become-costlier-due-to-russia-ukraine-war-know-why-4812740.html">click here</a> to access &nbsp;</p>
<p style="text-align:justify"><strong>Image Courtesy: Inclusive Media for Change/ Shambhu Ghatak</strong></p>
',
'credit_writer' => '',
'article_img' => 'Image construction worker 11 Mar 2022.jpg',
'article_img_thumb' => 'Image construction worker 11 Mar 2022.jpg',
'status' => (int) 1,
'show_on_home' => (int) 1,
'lang' => 'EN',
'category_id' => (int) 4,
'tag_keyword' => '',
'seo_url' => 'real-wage-rates-of-the-rural-workers-hardly-increased-during-the-past-6-years',
'meta_title' => '',
'meta_keywords' => '',
'meta_description' => '',
'noindex' => (int) 1,
'publish_date' => object(Cake\I18n\FrozenDate) {},
'most_visit_section_id' => null,
'article_big_img' => null,
'liveid' => null,
'created' => object(Cake\I18n\FrozenTime) {},
'modified' => object(Cake\I18n\FrozenTime) {},
'edate' => '',
'tags' => [
[maximum depth reached]
],
'category' => object(App\Model\Entity\Category) {},
'[new]' => false,
'[accessible]' => [
[maximum depth reached]
],
'[dirty]' => [[maximum depth reached]],
'[original]' => [[maximum depth reached]],
'[virtual]' => [[maximum depth reached]],
'[hasErrors]' => false,
'[errors]' => [[maximum depth reached]],
'[invalid]' => [[maximum depth reached]],
'[repository]' => 'Articles'
},
'articleid' => (int) 62349,
'metaTitle' => 'NEWS ALERTS | Real wage rates of the rural workers hardly increased during the last 6 years',
'metaKeywords' => 'Construction Workers,Consumer Price Index,CPI Rural,CPI Urban,Farm Labourers,Farm Workers,Food Inflation,Food Prices,Fuel Inflation,Fuel Prices,Nominal Wage Rate,Non-Farm Labourers,Non-Farm Workers,Real Wage Growth,Real Wages,Retail Inflation,Rural Workers',
'metaDesc' => 'In the absence of income or expenditure-based headcount ratio, the growth in the real wages (i.e., nominal wages adjusted against retail inflation) of the manual workers is considered to be a good proxy to assess the trends in poverty. This...',
'disp' => '<p style="text-align:justify">In the absence of income or expenditure-based headcount ratio, the growth in the real wages <em>(i.e., nominal wages adjusted against retail inflation)</em> of the manual workers is considered to be a good proxy to assess the trends in poverty. This is because the manual, unskilled/ semi-skilled labourers exist at the bottom of the pyramid or economic hierarchy, and most of them belong to the social categories Scheduled Castes (SCs) and Scheduled Tribes (STs). A positive growth in their real wages <em>(or real wage rates) </em>is anticipated to improve their purchasing power <em>(i.e., income or consumption expenditure)</em> and lift them out of the poverty trap. &nbsp;</p><p style="text-align:justify">Clearly, there exists inter-state differences in nominal wage rates, growth in nominal wage rates and growth in real wage rates, which we will see in this news alert.&nbsp;</p><p style="text-align:justify">Against the backdrop of the <a href="https://www.thehindubusinessline.com/markets/commodities/govt-reviews-cooking-oil-imports-as-ukraine-crisis-disrupts-supplies-prices-shoot-up/article65190879.ece" title="https://www.thehindubusinessline.com/markets/commodities/govt-reviews-cooking-oil-imports-as-ukraine-crisis-disrupts-supplies-prices-shoot-up/article65190879.ece">Russia-Ukraine conflict</a>, which is anticipated to cause both <a href="https://www.ndtv.com/business/indias-economy-faces-a-potential-stagflation-risk-from-ukraine-war-2796624" title="https://www.ndtv.com/business/indias-economy-faces-a-potential-stagflation-risk-from-ukraine-war-2796624">food and fuel retail inflation</a> in India in the coming times, it is even more important to look at the past trends in wage rate growth of the rural workers. It should be noted that the <a href="https://public.flourish.studio/visualisation/8706137" title="https://public.flourish.studio/visualisation/8706137">year-on-year inflation</a> in <a href="https://public.flourish.studio/visualisation/8706137" title="https://public.flourish.studio/visualisation/8706137">Consumer</a> <a href="https://public.flourish.studio/visualisation/8706137" title="https://public.flourish.studio/visualisation/8706137">Price Index Rural</a> exceeded the <a href="https://public.flourish.studio/visualisation/8706137" title="https://public.flourish.studio/visualisation/8706137">year-on-year inflation</a> in <a href="https://public.flourish.studio/visualisation/8706137" title="https://public.flourish.studio/visualisation/8706137">CPI Urban</a> during January 2022 at the national level. Even before the beginning of Russia-Ukraine conflict <em>(i.e., during January 2022)</em>, in rural areas, <a href="https://im4change.org/upload/files/CPI%20Press%20Release%20January%202022%281%29.pdf" title="https://im4change.org/upload/files/CPI%20Press%20Release%20January%202022%281%29.pdf">retail inflation rate of 20.6 percent</a> was noticed for &#39;oils and fats&#39;, aside from&nbsp;<a href="https://im4change.org/upload/files/CPI%20Press%20Release%20January%202022%281%29.pdf" title="https://im4change.org/upload/files/CPI%20Press%20Release%20January%202022%281%29.pdf">8.44 percent retail inflation for &#39;fuel and light&#39;</a>, <a href="https://im4change.org/upload/files/CPI%20Press%20Release%20January%202022%281%29.pdf" title="https://im4change.org/upload/files/CPI%20Press%20Release%20January%202022%281%29.pdf">8.27 percent</a> for &#39;transport and communication&#39;, and <a href="https://im4change.org/upload/files/CPI%20Press%20Release%20January%202022%281%29.pdf" title="https://im4change.org/upload/files/CPI%20Press%20Release%20January%202022%281%29.pdf">9.65 percent for &#39;clothing and footwear&#39;</a>.&nbsp; &nbsp;&nbsp;</p><p style="text-align:justify">At the national level, the average daily nominal wage rate&nbsp;for male construction workers in rural areas during the period from 2014-15 to 2020-21 was Rs. 316.9, which was greater than that of the male non-farm workers in rural areas. The average daily nominal wage rate&nbsp;for male non-agricultural labourers in rural areas during the period from 2014-15 to 2020-21 was Rs. 273.8, which exceeded the average daily nominal wage rates for male farm labourers in rural areas <em>(i.e., Rs. 265.1)</em>. However, in Andhra Pradesh, Haryana, Himachal Pradesh, Jammu and Kashmir,&nbsp;Karnataka, Kerala, Meghalaya, Punjab, and Tripura, the average daily nominal wage rates for male agricultural labourers in rural areas during the period from 2014-15 to 2020-21 exceeded the average daily nominal wage rates for male non-farm labourers in rural areas. Please see chart-1.</p><p style="text-align:justify"><img alt="" src="/upload/images/Chart%201.png" style="height:670px; width:1000px" /></p><p style="text-align:justify"><em><strong>Notes:</strong> The average (i.e., arithmetic mean) daily nominal wage rates for various categories of workers in rural India in the period from 2014-15 to 2020-21 has been calculated by the Inclusive Media for Change staff</em></p><p style="text-align:justify"><em>Please <a href="https://docs.google.com/spreadsheets/d/1avu0-WtaKV2RHXtz2eiP7iS8znGVBdKC/edit?usp=sharing&amp;ouid=112233925171588304692&amp;rtpof=true&amp;sd=true" title="https://docs.google.com/spreadsheets/d/1avu0-WtaKV2RHXtz2eiP7iS8znGVBdKC/edit?usp=sharing&amp;ouid=112233925171588304692&amp;rtpof=true&amp;sd=true">click here</a> to access the data in spreadsheet format</em></p><p style="text-align:justify"><em><strong>Source:&nbsp;</strong>Handbook of Statistics on Indian States 2020-21, released in November 2021, please <a href="https://m.rbi.org.in/scripts/AnnualPublications.aspx?head=Handbook%20of%20Statistics%20on%20Indian%20States" title="https://m.rbi.org.in/scripts/AnnualPublications.aspx?head=Handbook%20of%20Statistics%20on%20Indian%20States">click here</a> to access</em></p><p style="text-align:justify"><em>State-wise Average Daily Wage Rates in Rural India (Men - General Agricultural Labourers), RBI Handbook of Statistics on Indian States 2020-21, released in November 2021, please <a href="/upload/files/State-wise%20Average%20Daily%20Wage%20Rates%20in%20Rural%20India%20Men%20-%20General%20Agricultural%20Labourers.PDF" title="/upload/files/State-wise%20Average%20Daily%20Wage%20Rates%20in%20Rural%20India%20Men%20-%20General%20Agricultural%20Labourers.PDF">click here</a> to access&nbsp;</em></p><p style="text-align:justify"><em>State-wise Average Daily Wage Rates in Rural India (Men - Non-Agricultural Labourers), RBI Handbook of Statistics on Indian States 2020-21, released in November 2021, please <a href="/upload/files/State-wise%20Average%20Daily%20Wage%20Rates%20in%20Rural%20India%20Men%20-%20Non%20Agricultural%20Labourers.PDF" title="/upload/files/State-wise%20Average%20Daily%20Wage%20Rates%20in%20Rural%20India%20Men%20-%20Non%20Agricultural%20Labourers.PDF">click here</a> to access&nbsp;</em></p><p style="text-align:justify"><em>State-wise Average Daily Wage Rates in Rural India (Men - Construction Workers), RBI Handbook of Statistics on Indian States 2020-21, released in November 2021, please <a href="/upload/files/State-wise%20Average%20Daily%20Wage%20Rates%20in%20Rural%20India%20Men%20-%20Construction%20Workers.PDF" title="/upload/files/State-wise%20Average%20Daily%20Wage%20Rates%20in%20Rural%20India%20Men%20-%20Construction%20Workers.PDF">click here</a> to access&nbsp;</em></p><p style="text-align:justify"><em>State-wise Average Inflation (CPI) - Inflation, RBI Handbook of Statistics on Indian States 2020-21, released in November 2021, please <a href="/upload/files/State-wise%20Average%20Inflation%20CPI%20-%20Inflation.PDF" title="/upload/files/State-wise%20Average%20Inflation%20CPI%20-%20Inflation.PDF">click here</a> to access&nbsp;</em></p><p style="text-align:justify"><strong>---</strong></p><p style="text-align:justify">At the national level, the agricultural nominal wage rate&nbsp;grew faster than the non-farm wage&nbsp;rate&nbsp;on average for male labourers in rural areas during the period from 2015-16 to 2020-21. However, in states like Assam, Bihar, Haryana, Madhya Pradesh, Odisha, Punjab, and West Bengal, the non-farm nominal wage rates grew faster than the farm wage rates on average for male workers in rural areas during the period from 2015-16 to 2020-21. Please see chart-2.&nbsp;</p><p style="text-align:justify"><img alt="" src="/upload/images/Chart%202.png" style="height:653px; width:1000px" /></p><p style="text-align:justify"><em><strong>Notes: </strong>The average growth in daily nominal wage rates for various categories of workers in rural India in the period from 2015-16 to 2020-21 has been calculated by the Inclusive Media for Change staff</em></p><p style="text-align:justify"><em>Please <a href="https://docs.google.com/spreadsheets/d/1avu0-WtaKV2RHXtz2eiP7iS8znGVBdKC/edit?usp=sharing&amp;ouid=112233925171588304692&amp;rtpof=true&amp;sd=true" title="https://docs.google.com/spreadsheets/d/1avu0-WtaKV2RHXtz2eiP7iS8znGVBdKC/edit?usp=sharing&amp;ouid=112233925171588304692&amp;rtpof=true&amp;sd=true">click here</a> to access the data in spreadsheet format</em></p><p style="text-align:justify"><em><strong>Source: </strong>Same as above</em><br /><strong>---</strong></p><p style="text-align:justify">At the national level, the construction sector nominal wage rate&nbsp;grew slower than the non-agricultural wage&nbsp;rate&nbsp;on average for male labourers in rural areas during the period from 2015-16 to 2020-21. However, in states like Andhra Pradesh, Bihar, Himachal Pradesh, Maharashtra, Meghalaya, Punjab,&nbsp;Tamil Nadu, and Uttar Pradesh, the construction sector nominal wage rates grew faster than the non-farm wage rates on average for male workers in rural areas during the period from 2015-16 to 2020-21. Please take a look at chart-2. &nbsp;</p><p style="text-align:justify">At the national level, the agricultural wage rate&nbsp;in real terms grew faster than the non-farm wage rate&nbsp;on average for male labourers in rural areas during the period from 2015-16 to 2020-21. However, in states like Assam, Bihar, Haryana, Madhya Pradesh, Odisha, Punjab, and West Bengal, the non-farm wage rates in real terms grew faster than the farm wage rates on average for male workers in rural areas during the period from 2015-16 to 2020-21. Please see table-1.</p><p style="text-align:justify"><strong>Table 1: State-wise Growth in Average Daily Wage Rates in Real terms for Male Agricultural Labourers, Male Non-Agricultural Labourers, and Male Construction Workers in Rural India, in %</strong><br /><img alt="" src="/upload/images/Table%201%20State-wise%20Growth%20in%20Average%20Daily%20Wage%20Rates%20in%20Real%20terms%20for%20Male%20Agricultural%20Labourers%20Male%20Non-Agricultural%20Labourers%20and%20Male%20Construction%20Workers%20in%20Rural%20India%20in%20percent.png" style="height:539px; width:750px" /></p><p style="text-align:justify"><em><strong>Notes: </strong>The average growth in daily wage rates in real terms for various categories of workers in rural India in the period from 2015-16 to 2020-21 has been calculated by the Inclusive Media for Change staff</em></p><p style="text-align:justify"><em>Please <a href="https://docs.google.com/spreadsheets/d/1avu0-WtaKV2RHXtz2eiP7iS8znGVBdKC/edit?usp=sharing&amp;ouid=112233925171588304692&amp;rtpof=true&amp;sd=true" title="https://docs.google.com/spreadsheets/d/1avu0-WtaKV2RHXtz2eiP7iS8znGVBdKC/edit?usp=sharing&amp;ouid=112233925171588304692&amp;rtpof=true&amp;sd=true">click here</a> to access the data in spreadsheet format</em></p><p style="text-align:justify"><em><strong>Source: </strong>Same as above</em><br /><strong>---</strong></p><p style="text-align:justify">At the national level, the construction sector wage rate&nbsp;in real terms grew slower than the non-agricultural wage rate&nbsp;on average for male labourers in rural areas during the period from 2015-16 to 2020-21. However, in states like Andhra Pradesh, Bihar, Himachal Pradesh, Maharashtra, Meghalaya, Punjab, Tamil Nadu, and Uttar Pradesh, the construction sector wage rates in real terms grew faster than the non-farm wage rates on average for male workers in rural areas during the period from 2015-16 to 2020-21. Please take a look at table-1. &nbsp;</p><p style="text-align:justify">In the following paragraphs, we have discussed the trends in agricultural wage rates, non-farm wage rates, and construction sector wage rates <em>(in rural areas)</em> in detail.&nbsp;</p><p style="text-align:justify"><strong>Agricultural wages in rural areas</strong></p><p style="text-align:justify">The highest <a href="https://im4change.org/upload/files/State%20wise%20average%20daily%20nominal%20wage%20rates%20in%20rural%20india%20men%20farm%20labourers.JPG" title="https://im4change.org/upload/files/State%20wise%20average%20daily%20nominal%20wage%20rates%20in%20rural%20india%20men%20farm%20labourers.JPG">average daily nominal wage rate</a> <a href="https://im4change.org/upload/files/State%20wise%20average%20daily%20nominal%20wage%20rates%20in%20rural%20india%20men%20farm%20labourers.JPG" title="https://im4change.org/upload/files/State%20wise%20average%20daily%20nominal%20wage%20rates%20in%20rural%20india%20men%20farm%20labourers.JPG">for male agricultural labourers</a> in rural India during the period from 2014-15 to 2020-21 was found in Kerala <em>(Rs. 653.93)</em>, followed by Jammu and Kashmir <em>(Rs. 429.19)</em>, Tamil Nadu <em>(Rs. 385.6)</em>, Haryana <em>(Rs. 368.53)</em>, Himachal Pradesh <em>(Rs. 366.23)</em>, and Punjab <em>(Rs. 325.31)</em>. Please have a look at chart-1.</p><p style="text-align:justify">The lowest <a href="https://im4change.org/upload/files/State%20wise%20average%20daily%20nominal%20wage%20rates%20in%20rural%20india%20men%20farm%20labourers.JPG" title="https://im4change.org/upload/files/State%20wise%20average%20daily%20nominal%20wage%20rates%20in%20rural%20india%20men%20farm%20labourers.JPG">average daily nominal wage rate</a> <a href="https://im4change.org/upload/files/State%20wise%20average%20daily%20nominal%20wage%20rates%20in%20rural%20india%20men%20farm%20labourers.JPG" title="https://im4change.org/upload/files/State%20wise%20average%20daily%20nominal%20wage%20rates%20in%20rural%20india%20men%20farm%20labourers.JPG">for male agricultural labourers</a> in rural India during the period from 2014-15 to 2020-21 was observed in Madhya Pradesh <em>(Rs. 183.97)</em>, followed by Gujarat <em>(Rs. 190.07)</em>, Maharashtra <em>(Rs. 215.71)</em>, Odisha <em>(Rs. 216.87)</em>, Meghalaya <em>(Rs. 219.93)</em>, Bihar <em>(Rs. 230.43)</em>, Uttar Pradesh <em>(Rs. 230.5)</em>, and Assam <em>(Rs. 237.3)</em>. The related national level figure was Rs. 265.09 during the period from 2014-15 to 2020-21. Please consult chart-1.&nbsp;</p><p style="text-align:justify">The highest <a href="https://im4change.org/upload/files/State%20wise%20growth%20in%20average%20daily%20nominal%20wage%20rates%20in%20rural%20india%20men%20farm%20labourers.JPG" title="https://im4change.org/upload/files/State%20wise%20growth%20in%20average%20daily%20nominal%20wage%20rates%20in%20rural%20india%20men%20farm%20labourers.JPG">average annual growth rate in</a> <a href="https://im4change.org/upload/files/State%20wise%20growth%20in%20average%20daily%20nominal%20wage%20rates%20in%20rural%20india%20men%20farm%20labourers.JPG" title="https://im4change.org/upload/files/State%20wise%20growth%20in%20average%20daily%20nominal%20wage%20rates%20in%20rural%20india%20men%20farm%20labourers.JPG">nominal wage rates</a> during the period from 2015-16 to 2020-21 was found in Karnataka <em>(7.3 percent)</em>, followed by Andhra Pradesh <em>(6.8 percent)</em>, Madhya Pradesh <em>(6.4 percent)</em>, Uttar Pradesh <em>(6.2 percent)</em>, Odisha <em>(6.1 percent)</em>, and Meghalaya <em>(6.0 percent)</em>. Please see chart-2.</p><p style="text-align:justify">The lowest <a href="https://im4change.org/upload/files/State%20wise%20growth%20in%20average%20daily%20nominal%20wage%20rates%20in%20rural%20india%20men%20farm%20labourers.JPG" title="https://im4change.org/upload/files/State%20wise%20growth%20in%20average%20daily%20nominal%20wage%20rates%20in%20rural%20india%20men%20farm%20labourers.JPG">average annual growth rate</a> <a href="https://im4change.org/upload/files/State%20wise%20growth%20in%20average%20daily%20nominal%20wage%20rates%20in%20rural%20india%20men%20farm%20labourers.JPG" title="https://im4change.org/upload/files/State%20wise%20growth%20in%20average%20daily%20nominal%20wage%20rates%20in%20rural%20india%20men%20farm%20labourers.JPG">in nominal wage rates</a> during the same period was noticed in Haryana <em>(2.1 percent)</em>, followed by Rajasthan <em>(3.3 percent)</em>, Kerala <em>(3.5 percent)</em>, Punjab <em>(3.9 percent)</em>, and Tamil Nadu <em>(4.5 percent)</em>. Please consult chart-2.</p><p style="text-align:justify">The average annual <a href="https://im4change.org/upload/files/State%20wise%20growth%20in%20average%20daily%20wage%20rates%20in%20real%20terms%20for%20male%20farm%20labourers%20in%20rural%20India.JPG" title="https://im4change.org/upload/files/State%20wise%20growth%20in%20average%20daily%20wage%20rates%20in%20real%20terms%20for%20male%20farm%20labourers%20in%20rural%20India.JPG">growth of agricultural labourers&rsquo;</a> <a href="https://im4change.org/upload/files/State%20wise%20growth%20in%20average%20daily%20wage%20rates%20in%20real%20terms%20for%20male%20farm%20labourers%20in%20rural%20India.JPG" title="https://im4change.org/upload/files/State%20wise%20growth%20in%20average%20daily%20wage%20rates%20in%20real%20terms%20for%20male%20farm%20labourers%20in%20rural%20India.JPG">wage rates in real terms</a> during the period from 2015-16 to 2020-21 were negative in Haryana <em>(-2.1 percent)</em>, Jammu and Kashmir <em>(-0.3 percent)</em>, Kerala <em>(-1.7 percent)</em>, Punjab <em>(-0.4 percent)</em>, Rajasthan <em>(-1.1 percent)</em>, Tamil Nadu <em>(-0.8 percent)</em>, Tripura <em>(-0.5 percent)</em>, and West Bengal <em>(-0.1 percent)</em>. It should be noted that the <a href="https://im4change.org/upload/files/State-wise%20Average%20Inflation%20CPI%20-%20Inflation.PDF" title="https://im4change.org/upload/files/State-wise%20Average%20Inflation%20CPI%20-%20Inflation.PDF">rate of inflation</a> in <a href="https://im4change.org/upload/files/State-wise%20Average%20Inflation%20CPI%20-%20Inflation.PDF" title="https://im4change.org/upload/files/State-wise%20Average%20Inflation%20CPI%20-%20Inflation.PDF">Consumer Price Index-General</a> has been used to get the average annual growth of agricultural labourers&rsquo; wage rates in real terms. Kindly consult table-1. &nbsp;</p><p style="text-align:justify">Some states witnessed negative <a href="https://im4change.org/upload/files/State%20wise%20growth%20in%20average%20daily%20wage%20rates%20in%20real%20terms%20for%20male%20farm%20labourers%20in%20rural%20India.JPG" title="https://im4change.org/upload/files/State%20wise%20growth%20in%20average%20daily%20wage%20rates%20in%20real%20terms%20for%20male%20farm%20labourers%20in%20rural%20India.JPG">growth in agricultural labourers&rsquo;</a> <a href="https://im4change.org/upload/files/State%20wise%20growth%20in%20average%20daily%20wage%20rates%20in%20real%20terms%20for%20male%20farm%20labourers%20in%20rural%20India.JPG" title="https://im4change.org/upload/files/State%20wise%20growth%20in%20average%20daily%20wage%20rates%20in%20real%20terms%20for%20male%20farm%20labourers%20in%20rural%20India.JPG">wage rates in real terms</a> for more than two years between 2015-16 and 2020-21. For example, <a href="https://im4change.org/upload/files/State%20wise%20growth%20in%20average%20daily%20wage%20rates%20in%20real%20terms%20for%20male%20farm%20labourers%20in%20rural%20India.JPG" title="https://im4change.org/upload/files/State%20wise%20growth%20in%20average%20daily%20wage%20rates%20in%20real%20terms%20for%20male%20farm%20labourers%20in%20rural%20India.JPG">Haryana</a> experienced negative growth in 2015-16, 2016-17, 2017-18, 2019-20, and 2020-21. Likewise, <a href="https://im4change.org/upload/files/State%20wise%20growth%20in%20average%20daily%20wage%20rates%20in%20real%20terms%20for%20male%20farm%20labourers%20in%20rural%20India.JPG" title="https://im4change.org/upload/files/State%20wise%20growth%20in%20average%20daily%20wage%20rates%20in%20real%20terms%20for%20male%20farm%20labourers%20in%20rural%20India.JPG">Kerala</a> faced negative growth in 2017-18, 2018-19, 2019-20, and 2020-21. &nbsp;</p><p style="text-align:justify">At the national level, the <a href="https://im4change.org/upload/files/State%20wise%20growth%20in%20average%20daily%20wage%20rates%20in%20real%20terms%20for%20male%20farm%20labourers%20in%20rural%20India.JPG" title="https://im4change.org/upload/files/State%20wise%20growth%20in%20average%20daily%20wage%20rates%20in%20real%20terms%20for%20male%20farm%20labourers%20in%20rural%20India.JPG">agricultural labourers&rsquo;</a> <a href="https://im4change.org/upload/files/State%20wise%20growth%20in%20average%20daily%20wage%20rates%20in%20real%20terms%20for%20male%20farm%20labourers%20in%20rural%20India.JPG" title="https://im4change.org/upload/files/State%20wise%20growth%20in%20average%20daily%20wage%20rates%20in%20real%20terms%20for%20male%20farm%20labourers%20in%20rural%20India.JPG">wage rates in real terms</a> on average grew by 1.0 percent annually during the period from 2015-16 to 2020-21.</p><p style="text-align:justify">Please <a href="https://docs.google.com/spreadsheets/d/1avu0-WtaKV2RHXtz2eiP7iS8znGVBdKC/edit?usp=sharing&amp;ouid=112233925171588304692&amp;rtpof=true&amp;sd=true" title="https://docs.google.com/spreadsheets/d/1avu0-WtaKV2RHXtz2eiP7iS8znGVBdKC/edit?usp=sharing&amp;ouid=112233925171588304692&amp;rtpof=true&amp;sd=true">click here</a> to access the spreadsheet in order to look at the trends in <a href="/upload/files/State%20wise%20average%20daily%20nominal%20wage%20rates%20in%20rural%20india%20men%20farm%20labourers.JPG" title="/upload/files/State%20wise%20average%20daily%20nominal%20wage%20rates%20in%20rural%20india%20men%20farm%20labourers.JPG">nominal wage rates</a>, <a href="/upload/files/State%20wise%20growth%20in%20average%20daily%20nominal%20wage%20rates%20in%20rural%20india%20men%20farm%20labourers.JPG" title="/upload/files/State%20wise%20growth%20in%20average%20daily%20nominal%20wage%20rates%20in%20rural%20india%20men%20farm%20labourers.JPG">annual growth in nominal wage rates</a> and <a href="/upload/files/State%20wise%20growth%20in%20average%20daily%20wage%20rates%20in%20real%20terms%20for%20male%20farm%20labourers%20in%20rural%20India.JPG" title="/upload/files/State%20wise%20growth%20in%20average%20daily%20wage%20rates%20in%20real%20terms%20for%20male%20farm%20labourers%20in%20rural%20India.JPG">annual growth in real wage rates</a> for farm labourers in rural areas.&nbsp;</p><p style="text-align:justify"><strong>Non-agricultural wages in rural areas</strong></p><p style="text-align:justify">The rural economy is not just about farming any longer. That is why we have looked at the wage growth in the non-farm sector too.&nbsp;The highest <a href="https://im4change.org/upload/files/State%20wise%20average%20daily%20nominal%20wage%20rates%20in%20rural%20india%20men%20non%20farm%20labourers.JPG" title="https://im4change.org/upload/files/State%20wise%20average%20daily%20nominal%20wage%20rates%20in%20rural%20india%20men%20non%20farm%20labourers.JPG">average daily nominal wage rate for male</a> <a href="https://im4change.org/upload/files/State%20wise%20average%20daily%20nominal%20wage%20rates%20in%20rural%20india%20men%20non%20farm%20labourers.JPG" title="https://im4change.org/upload/files/State%20wise%20average%20daily%20nominal%20wage%20rates%20in%20rural%20india%20men%20non%20farm%20labourers.JPG">non-agricultural labourers</a> in rural India during the period from 2014-15 to 2020-21 was detected in Kerala <em>(Rs. 639.01)</em>, followed by Jammu and Kashmir <em>(Rs. 426.37)</em>, Tamil Nadu <em>(Rs. 405.77)</em>, Haryana <em>(Rs. 359.24)</em>, Himachal Pradesh <em>(Rs. 311.10)</em>, and Punjab <em>(Rs. 309.09)</em>. Please see chart-1.</p><p style="text-align:justify">The lowest average <a href="https://im4change.org/upload/files/State%20wise%20average%20daily%20nominal%20wage%20rates%20in%20rural%20india%20men%20non%20farm%20labourers.JPG" title="https://im4change.org/upload/files/State%20wise%20average%20daily%20nominal%20wage%20rates%20in%20rural%20india%20men%20non%20farm%20labourers.JPG">daily nominal wage rate for male</a> <a href="https://im4change.org/upload/files/State%20wise%20average%20daily%20nominal%20wage%20rates%20in%20rural%20india%20men%20non%20farm%20labourers.JPG" title="https://im4change.org/upload/files/State%20wise%20average%20daily%20nominal%20wage%20rates%20in%20rural%20india%20men%20non%20farm%20labourers.JPG">non-agricultural labourers in rural India</a> during the period from 2014-15 to 2020-21 was found in Madhya Pradesh <em>(Rs. 191.47)</em>, followed by Meghalaya <em>(Rs. 210.26)</em>, Gujarat <em>(Rs. 213.51)</em>, Odisha <em>(Rs. 218.06)</em>, Maharashtra <em>(Rs. 226.70)</em>, Tripura <em>(Rs. 230.36)</em>, Bihar <em>(Rs. 243.51)</em>, and Uttar Pradesh <em>(Rs. 243.97)</em>. The related national level figure was Rs. 273.79 during the period from 2014-15 to 2020-21. Please see chart-1.</p><p style="text-align:justify">The highest <a href="https://im4change.org/upload/files/State%20wise%20growth%20in%20average%20daily%20nominal%20wage%20rates%20in%20rural%20india%20men%20non%20farm%20labourers.JPG" title="https://im4change.org/upload/files/State%20wise%20growth%20in%20average%20daily%20nominal%20wage%20rates%20in%20rural%20india%20men%20non%20farm%20labourers.JPG">average annual growth rate in</a> <a href="https://im4change.org/upload/files/State%20wise%20growth%20in%20average%20daily%20nominal%20wage%20rates%20in%20rural%20india%20men%20non%20farm%20labourers.JPG" title="https://im4change.org/upload/files/State%20wise%20growth%20in%20average%20daily%20nominal%20wage%20rates%20in%20rural%20india%20men%20non%20farm%20labourers.JPG">nominal wage rates</a> during the period from 2015-16 to 2020-21 was noticed in Odisha <em>(8.0 percent)</em>, followed by Madhya Pradesh <em>(7.6 percent)</em>, Assam <em>(6.6 percent)</em>, West Bengal <em>(5.9 percent)</em>, Uttar Pradesh and Andhra Pradesh <em>(5.6 percent each)</em>, and Bihar <em>(5.5 percent)</em>. Kindly consult chart-2.</p><p style="text-align:justify">The lowest <a href="https://im4change.org/upload/files/State%20wise%20growth%20in%20average%20daily%20nominal%20wage%20rates%20in%20rural%20india%20men%20non%20farm%20labourers.JPG" title="https://im4change.org/upload/files/State%20wise%20growth%20in%20average%20daily%20nominal%20wage%20rates%20in%20rural%20india%20men%20non%20farm%20labourers.JPG">average annual growth rate</a> <a href="https://im4change.org/upload/files/State%20wise%20growth%20in%20average%20daily%20nominal%20wage%20rates%20in%20rural%20india%20men%20non%20farm%20labourers.JPG" title="https://im4change.org/upload/files/State%20wise%20growth%20in%20average%20daily%20nominal%20wage%20rates%20in%20rural%20india%20men%20non%20farm%20labourers.JPG">in nominal wage rates</a> during the same period was observed in Kerala <em>(1.8 percent)</em>, followed by Haryana <em>(2.4 percent)</em>, Meghalaya <em>(2.8 percent)</em>, Tamil Nadu and Rajasthan <em>(3.2 percent each)</em>, Tripura and Jammu and Kashmir <em>(4.0 percent each),</em> and Maharashtra and Punjab <em>(4.2 percent each)</em>. Kindly consult chart-2.&nbsp;</p><p style="text-align:justify">The average annual <a href="https://im4change.org/upload/files/State%20wise%20growth%20in%20average%20daily%20wage%20rates%20in%20real%20terms%20for%20male%20non%20farm%20labourers%20in%20rural%20India.JPG" title="https://im4change.org/upload/files/State%20wise%20growth%20in%20average%20daily%20wage%20rates%20in%20real%20terms%20for%20male%20non%20farm%20labourers%20in%20rural%20India.JPG">growth of non-agricultural labourers&rsquo;</a> <a href="https://im4change.org/upload/files/State%20wise%20growth%20in%20average%20daily%20wage%20rates%20in%20real%20terms%20for%20male%20non%20farm%20labourers%20in%20rural%20India.JPG" title="https://im4change.org/upload/files/State%20wise%20growth%20in%20average%20daily%20wage%20rates%20in%20real%20terms%20for%20male%20non%20farm%20labourers%20in%20rural%20India.JPG">wage rates in real terms</a> during the period from 2015-16 to 2020-21 were negative in Haryana <em>(-1.9 percent)</em>, Jammu and Kashmir <em>(-1.7 percent)</em>, Kerala <em>(-3.5 percent)</em>, Maharashtra <em>(-0.3 percent)</em>, Meghalaya <em>(-1.2 percent)</em>, Punjab <em>(-0.1 percent)</em>, Rajasthan <em>(-1.2 percent)</em>, Tamil Nadu <em>(-2.1 percent)</em>, and Tripura <em>(-1.1 percent)</em>. It should be noted that the <a href="https://im4change.org/upload/files/State-wise%20Average%20Inflation%20CPI%20-%20Inflation.PDF" title="https://im4change.org/upload/files/State-wise%20Average%20Inflation%20CPI%20-%20Inflation.PDF">rate of inflation</a> in <a href="https://im4change.org/upload/files/State-wise%20Average%20Inflation%20CPI%20-%20Inflation.PDF" title="https://im4change.org/upload/files/State-wise%20Average%20Inflation%20CPI%20-%20Inflation.PDF">CPI-General</a> has been used to get the average annual growth of non-agricultural labourers&rsquo; wage rates in real terms. Kindly have a look at table-1. &nbsp;&nbsp;</p><p style="text-align:justify">Some states experienced negative growth in <a href="https://im4change.org/upload/files/State%20wise%20growth%20in%20average%20daily%20wage%20rates%20in%20real%20terms%20for%20male%20non%20farm%20labourers%20in%20rural%20India.JPG" title="https://im4change.org/upload/files/State%20wise%20growth%20in%20average%20daily%20wage%20rates%20in%20real%20terms%20for%20male%20non%20farm%20labourers%20in%20rural%20India.JPG">non-agricultural labourers&rsquo; wage</a> <a href="https://im4change.org/upload/files/State%20wise%20growth%20in%20average%20daily%20wage%20rates%20in%20real%20terms%20for%20male%20non%20farm%20labourers%20in%20rural%20India.JPG" title="https://im4change.org/upload/files/State%20wise%20growth%20in%20average%20daily%20wage%20rates%20in%20real%20terms%20for%20male%20non%20farm%20labourers%20in%20rural%20India.JPG">rates in real terms</a> for more than two years between 2015-16 and 2020-21. For example, <a href="https://im4change.org/upload/files/State%20wise%20growth%20in%20average%20daily%20wage%20rates%20in%20real%20terms%20for%20male%20non%20farm%20labourers%20in%20rural%20India.JPG" title="https://im4change.org/upload/files/State%20wise%20growth%20in%20average%20daily%20wage%20rates%20in%20real%20terms%20for%20male%20non%20farm%20labourers%20in%20rural%20India.JPG">Haryana</a> experienced negative <a href="https://im4change.org/upload/files/State%20wise%20growth%20in%20average%20daily%20wage%20rates%20in%20real%20terms%20for%20male%20non%20farm%20labourers%20in%20rural%20India.JPG" title="https://im4change.org/upload/files/State%20wise%20growth%20in%20average%20daily%20wage%20rates%20in%20real%20terms%20for%20male%20non%20farm%20labourers%20in%20rural%20India.JPG">growth in wage rates</a> <a href="https://im4change.org/upload/files/State%20wise%20growth%20in%20average%20daily%20wage%20rates%20in%20real%20terms%20for%20male%20non%20farm%20labourers%20in%20rural%20India.JPG" title="https://im4change.org/upload/files/State%20wise%20growth%20in%20average%20daily%20wage%20rates%20in%20real%20terms%20for%20male%20non%20farm%20labourers%20in%20rural%20India.JPG">(in real terms)</a> during 2016-17, 2017-18, 2018-19, 2019-20, and 2020-21. Likewise, <a href="https://im4change.org/upload/files/State%20wise%20growth%20in%20average%20daily%20wage%20rates%20in%20real%20terms%20for%20male%20non%20farm%20labourers%20in%20rural%20India.JPG" title="https://im4change.org/upload/files/State%20wise%20growth%20in%20average%20daily%20wage%20rates%20in%20real%20terms%20for%20male%20non%20farm%20labourers%20in%20rural%20India.JPG">Kerala</a> faced negative growth rates in 2015-16, 2016-17, 2017-18, 2019-20, and 2020-21. &nbsp;</p><p style="text-align:justify">At the national level, the&nbsp;<a href="https://im4change.org/upload/files/State%20wise%20growth%20in%20average%20daily%20wage%20rates%20in%20real%20terms%20for%20male%20non%20farm%20labourers%20in%20rural%20India.JPG" title="https://im4change.org/upload/files/State%20wise%20growth%20in%20average%20daily%20wage%20rates%20in%20real%20terms%20for%20male%20non%20farm%20labourers%20in%20rural%20India.JPG">non-agricultural labourers&rsquo;</a> <a href="https://im4change.org/upload/files/State%20wise%20growth%20in%20average%20daily%20wage%20rates%20in%20real%20terms%20for%20male%20non%20farm%20labourers%20in%20rural%20India.JPG" title="https://im4change.org/upload/files/State%20wise%20growth%20in%20average%20daily%20wage%20rates%20in%20real%20terms%20for%20male%20non%20farm%20labourers%20in%20rural%20India.JPG">wage rates in real terms</a> on average grew by just 0.3 percent annually during the period from 2015-16 to 2020-21.&nbsp;</p><p style="text-align:justify">Please <a href="https://docs.google.com/spreadsheets/d/1avu0-WtaKV2RHXtz2eiP7iS8znGVBdKC/edit?usp=sharing&amp;ouid=112233925171588304692&amp;rtpof=true&amp;sd=true" title="https://docs.google.com/spreadsheets/d/1avu0-WtaKV2RHXtz2eiP7iS8znGVBdKC/edit?usp=sharing&amp;ouid=112233925171588304692&amp;rtpof=true&amp;sd=true">click here</a> to access the spreadsheet in order to look at the <a href="/upload/files/State%20wise%20average%20daily%20nominal%20wage%20rates%20in%20rural%20india%20men%20non%20farm%20labourers.JPG" title="/upload/files/State%20wise%20average%20daily%20nominal%20wage%20rates%20in%20rural%20india%20men%20non%20farm%20labourers.JPG">trends in nominal wage rates</a>, <a href="/upload/files/State%20wise%20growth%20in%20average%20daily%20nominal%20wage%20rates%20in%20rural%20india%20men%20non%20farm%20labourers.JPG" title="/upload/files/State%20wise%20growth%20in%20average%20daily%20nominal%20wage%20rates%20in%20rural%20india%20men%20non%20farm%20labourers.JPG">annual growth in nominal wage rates</a>, and <a href="/upload/files/State%20wise%20growth%20in%20average%20daily%20wage%20rates%20in%20real%20terms%20for%20male%20non%20farm%20labourers%20in%20rural%20India.JPG" title="/upload/files/State%20wise%20growth%20in%20average%20daily%20wage%20rates%20in%20real%20terms%20for%20male%20non%20farm%20labourers%20in%20rural%20India.JPG">annual growth in real wage rates</a> for non-farm labourers in rural areas.&nbsp;</p><p style="text-align:justify"><strong>Construction sector wages in rural areas</strong></p><p style="text-align:justify">The <a href="https://im4change.org/upload/files/State%20wise%20average%20daily%20nominal%20wage%20rates%20in%20rural%20india%20men%20construction%20workers.JPG" title="https://im4change.org/upload/files/State%20wise%20average%20daily%20nominal%20wage%20rates%20in%20rural%20india%20men%20construction%20workers.JPG">highest average daily nominal wage rates</a> <a href="https://im4change.org/upload/files/State%20wise%20average%20daily%20nominal%20wage%20rates%20in%20rural%20india%20men%20construction%20workers.JPG" title="https://im4change.org/upload/files/State%20wise%20average%20daily%20nominal%20wage%20rates%20in%20rural%20india%20men%20construction%20workers.JPG">for male construction workers in rural India</a> during the period from 2014-15 to 2020-21 was detected in Kerala <em>(Rs. 810.3)</em>, followed by Jammu and Kashmir <em>(Rs. 445.1)</em>, Tamil Nadu <em>(Rs. 424.1)</em>, Haryana <em>(Rs. 379.9)</em>, Himachal Pradesh <em>(Rs. 368.7)</em>, Rajasthan <em>(Rs. 347.7)</em>, and Punjab <em>(Rs. 339.1)</em>. Kindly see chart-1.&nbsp;</p><p style="text-align:justify">The <a href="https://im4change.org/upload/files/State%20wise%20average%20daily%20nominal%20wage%20rates%20in%20rural%20india%20men%20construction%20workers.JPG" title="https://im4change.org/upload/files/State%20wise%20average%20daily%20nominal%20wage%20rates%20in%20rural%20india%20men%20construction%20workers.JPG">lowest average daily nominal wage rates</a> <a href="https://im4change.org/upload/files/State%20wise%20average%20daily%20nominal%20wage%20rates%20in%20rural%20india%20men%20construction%20workers.JPG" title="https://im4change.org/upload/files/State%20wise%20average%20daily%20nominal%20wage%20rates%20in%20rural%20india%20men%20construction%20workers.JPG">for male construction workers in rural areas</a> during the period from 2014-15 to 2020-21 was found in Madhya Pradesh <em>(Rs. 212.4)</em>, followed by Tripura <em>(Rs. 230.4)</em>, Meghalaya <em>(Rs. 231.7)</em>, Odisha <em>(Rs. 247.1)</em>, Gujarat <em>(Rs. 251.8)</em>, Uttar Pradesh <em>(Rs. 267.4)</em>, Bihar <em>(Rs. 270.8)</em>, and West Bengal <em>(Rs. 274.0)</em>. The related national level figure was Rs. 316.9 during the period from 2014-15 to 2020-21. Kindly consult chart-1.</p><p style="text-align:justify">The <a href="https://im4change.org/upload/files/State%20wise%20growth%20in%20average%20daily%20nominal%20wage%20rates%20in%20rural%20india%20men%20construction%20workers.JPG" title="https://im4change.org/upload/files/State%20wise%20growth%20in%20average%20daily%20nominal%20wage%20rates%20in%20rural%20india%20men%20construction%20workers.JPG">highest average annual growth rates in</a> <a href="https://im4change.org/upload/files/State%20wise%20growth%20in%20average%20daily%20nominal%20wage%20rates%20in%20rural%20india%20men%20construction%20workers.JPG" title="https://im4change.org/upload/files/State%20wise%20growth%20in%20average%20daily%20nominal%20wage%20rates%20in%20rural%20india%20men%20construction%20workers.JPG">nominal wage rates</a> during the period from 2015-16 to 2020-21 was noticed in Meghalaya <em>(20.9 percent)</em>, followed by Madhya Pradesh <em>(7.4 percent)</em>, Odisha and Andhra Pradesh <em>(6.8 percent each)</em>, Uttar Pradesh <em>(6.4 percent)</em>, and Bihar <em>(6.2 percent)</em>. Please see chart-2.&nbsp;</p><p style="text-align:justify">The <a href="https://im4change.org/upload/files/State%20wise%20growth%20in%20average%20daily%20nominal%20wage%20rates%20in%20rural%20india%20men%20construction%20workers.JPG" title="https://im4change.org/upload/files/State%20wise%20growth%20in%20average%20daily%20nominal%20wage%20rates%20in%20rural%20india%20men%20construction%20workers.JPG">lowest average annual growth rates in</a> <a href="https://im4change.org/upload/files/State%20wise%20growth%20in%20average%20daily%20nominal%20wage%20rates%20in%20rural%20india%20men%20construction%20workers.JPG" title="https://im4change.org/upload/files/State%20wise%20growth%20in%20average%20daily%20nominal%20wage%20rates%20in%20rural%20india%20men%20construction%20workers.JPG">nominal wage rates</a> during the same period was observed in Kerala <em>(0.9 percent)</em>, followed by Manipur <em>(2.0 percent)</em>, Haryana <em>(2.1 percent)</em>, Jammu and Kashmir <em>(3.0 percent)</em>, Rajasthan <em>(3.2 percent)</em>, and Gujarat <em>(3.6 percent)</em>. Please see chart-2.</p><p style="text-align:justify">The <a href="https://im4change.org/upload/files/State%20wise%20growth%20in%20average%20daily%20wage%20rates%20in%20real%20terms%20for%20male%20construction%20workers%20in%20rural%20India%281%29.JPG" title="https://im4change.org/upload/files/State%20wise%20growth%20in%20average%20daily%20wage%20rates%20in%20real%20terms%20for%20male%20construction%20workers%20in%20rural%20India%281%29.JPG">average annual growth of construction workers&rsquo;</a> <a href="https://im4change.org/upload/files/State%20wise%20growth%20in%20average%20daily%20wage%20rates%20in%20real%20terms%20for%20male%20construction%20workers%20in%20rural%20India%281%29.JPG" title="https://im4change.org/upload/files/State%20wise%20growth%20in%20average%20daily%20wage%20rates%20in%20real%20terms%20for%20male%20construction%20workers%20in%20rural%20India%281%29.JPG">wage rates in real terms</a> during the period from 2015-16 to 2020-21 was negative in Assam <em>(-1.2 percent)</em>, Haryana <em>(-2.1 percent)</em>, Jammu and Kashmir <em>(-2.7 percent)</em>, Karnataka <em>(-0.6 percent)</em>, Kerala <em>(-4.4 percent)</em>, Manipur <em>(-6.3 percent)</em>, Rajasthan <em>(-1.2 percent)</em>, Tamil Nadu <em>(-0.9 percent)</em>, and Tripura <em>(-1.1 percent)</em>. Please note that the <a href="https://im4change.org/upload/files/State-wise%20Average%20Inflation%20CPI%20-%20Inflation.PDF" title="https://im4change.org/upload/files/State-wise%20Average%20Inflation%20CPI%20-%20Inflation.PDF">rate of inflation</a> in <a href="https://im4change.org/upload/files/State-wise%20Average%20Inflation%20CPI%20-%20Inflation.PDF" title="https://im4change.org/upload/files/State-wise%20Average%20Inflation%20CPI%20-%20Inflation.PDF">CPI-General</a> has been used to get the average annual growth of construction workers&rsquo; wage rates in real terms. Kindly have a look at table-1. &nbsp;&nbsp;</p><p style="text-align:justify">In the case of Meghalaya, the <a href="https://im4change.org/upload/files/State%20wise%20average%20daily%20nominal%20wage%20rates%20in%20rural%20india%20men%20construction%20workers.JPG" title="https://im4change.org/upload/files/State%20wise%20average%20daily%20nominal%20wage%20rates%20in%20rural%20india%20men%20construction%20workers.JPG">nominal daily wage rate of male construction</a> <a href="https://im4change.org/upload/files/State%20wise%20average%20daily%20nominal%20wage%20rates%20in%20rural%20india%20men%20construction%20workers.JPG" title="https://im4change.org/upload/files/State%20wise%20average%20daily%20nominal%20wage%20rates%20in%20rural%20india%20men%20construction%20workers.JPG">workers</a> fell from Rs. 186.0 in 2016-17 to Rs. 100.0 in 2017-18 i.e., a decline&nbsp;by -46.2 percent over previous year. However, the same bounced back to Rs. 273.2 in 2018-19 i.e., an increase by 173.2 percent over previous year. In <a href="https://im4change.org/upload/files/State%20wise%20growth%20in%20average%20daily%20wage%20rates%20in%20real%20terms%20for%20male%20construction%20workers%20in%20rural%20India%281%29.JPG" title="https://im4change.org/upload/files/State%20wise%20growth%20in%20average%20daily%20wage%20rates%20in%20real%20terms%20for%20male%20construction%20workers%20in%20rural%20India%281%29.JPG">real terms, the construction sector</a> <a href="https://im4change.org/upload/files/State%20wise%20growth%20in%20average%20daily%20wage%20rates%20in%20real%20terms%20for%20male%20construction%20workers%20in%20rural%20India%281%29.JPG" title="https://im4change.org/upload/files/State%20wise%20growth%20in%20average%20daily%20wage%20rates%20in%20real%20terms%20for%20male%20construction%20workers%20in%20rural%20India%281%29.JPG">wage rate in Meghalaya</a> grew by -47.7 percent in 2017-18 <em>(over previous year)</em> and 171.0 percent in 2018-19 <em>(over previous year)</em>.</p><p style="text-align:justify">Some states experienced negative <a href="https://im4change.org/upload/files/State%20wise%20growth%20in%20average%20daily%20wage%20rates%20in%20real%20terms%20for%20male%20construction%20workers%20in%20rural%20India%281%29.JPG" title="https://im4change.org/upload/files/State%20wise%20growth%20in%20average%20daily%20wage%20rates%20in%20real%20terms%20for%20male%20construction%20workers%20in%20rural%20India%281%29.JPG">growth in construction workers&rsquo;</a> <a href="https://im4change.org/upload/files/State%20wise%20growth%20in%20average%20daily%20wage%20rates%20in%20real%20terms%20for%20male%20construction%20workers%20in%20rural%20India%281%29.JPG" title="https://im4change.org/upload/files/State%20wise%20growth%20in%20average%20daily%20wage%20rates%20in%20real%20terms%20for%20male%20construction%20workers%20in%20rural%20India%281%29.JPG">wage rates in real terms</a> for more than two years between 2015-16 and 2020-21. For example, <a href="https://im4change.org/upload/files/State%20wise%20growth%20in%20average%20daily%20wage%20rates%20in%20real%20terms%20for%20male%20construction%20workers%20in%20rural%20India%281%29.JPG" title="https://im4change.org/upload/files/State%20wise%20growth%20in%20average%20daily%20wage%20rates%20in%20real%20terms%20for%20male%20construction%20workers%20in%20rural%20India%281%29.JPG">Assam</a> experienced negative growth in wage rates <em>(in real terms)</em> during 2017-18, 2018-19, 2019-20, and 2020-21. &nbsp;</p><p style="text-align:justify">At the national level, the&nbsp;<a href="https://im4change.org/upload/files/State%20wise%20growth%20in%20average%20daily%20wage%20rates%20in%20real%20terms%20for%20male%20construction%20workers%20in%20rural%20India%281%29.JPG" title="https://im4change.org/upload/files/State%20wise%20growth%20in%20average%20daily%20wage%20rates%20in%20real%20terms%20for%20male%20construction%20workers%20in%20rural%20India%281%29.JPG">construction workers&rsquo; wage rates in real terms</a> on average grew by just 0.1 percent annually during the period from 2015-16 to 2020-21.</p><p style="text-align:justify">Kindly <a href="https://docs.google.com/spreadsheets/d/1avu0-WtaKV2RHXtz2eiP7iS8znGVBdKC/edit?usp=sharing&amp;ouid=112233925171588304692&amp;rtpof=true&amp;sd=true" title="https://docs.google.com/spreadsheets/d/1avu0-WtaKV2RHXtz2eiP7iS8znGVBdKC/edit?usp=sharing&amp;ouid=112233925171588304692&amp;rtpof=true&amp;sd=true">click here</a> to access the spreadsheet in order to look at the <a href="/upload/files/State%20wise%20average%20daily%20nominal%20wage%20rates%20in%20rural%20india%20men%20construction%20workers.JPG" title="/upload/files/State%20wise%20average%20daily%20nominal%20wage%20rates%20in%20rural%20india%20men%20construction%20workers.JPG">trends in nominal wage rates</a>, <a href="/upload/files/State%20wise%20growth%20in%20average%20daily%20nominal%20wage%20rates%20in%20rural%20india%20men%20construction%20workers.JPG" title="/upload/files/State%20wise%20growth%20in%20average%20daily%20nominal%20wage%20rates%20in%20rural%20india%20men%20construction%20workers.JPG">annual growth in nominal wage rates</a>, and <a href="/upload/files/State%20wise%20growth%20in%20average%20daily%20wage%20rates%20in%20real%20terms%20for%20male%20construction%20workers%20in%20rural%20India%281%29.JPG" title="/upload/files/State%20wise%20growth%20in%20average%20daily%20wage%20rates%20in%20real%20terms%20for%20male%20construction%20workers%20in%20rural%20India%281%29.JPG">annual growth in real wage rates</a> for construction workers in rural areas.&nbsp;</p><p style="text-align:justify"><strong>Data collection methodology</strong></p><p style="text-align:justify">As a part of Rural Labour Enquiry, the&nbsp;<a href="https://im4change.org/upload/files/ilj_feb_2013.pdf" title="https://im4change.org/upload/files/ilj_feb_2013.pdf">daily wage rates</a> in respect of eighteen agricultural and non-agricultural occupations are being collected along with rural retail price data by the Field Operations Division of the National Sample Survey Organisation since 1986-87, according to a February 2013 <a href="https://im4change.org/upload/files/ilj_feb_2013.pdf" title="https://im4change.org/upload/files/ilj_feb_2013.pdf">edition of the Indian Labour Journal</a>.&nbsp;On the recommendations of the Governing Council of the National Sample Survey Organisation in its 61st meeting,&nbsp;the <a href="https://im4change.org/upload/files/ilj_feb_2013.pdf" title="https://im4change.org/upload/files/ilj_feb_2013.pdf">Labour Bureau</a> started the compilation and analysis of wage rate data with effect from April, 1998.&nbsp;</p><p style="text-align:justify">The Field Operations Division of the National Sample Survey Organisation has been entrusted with the work of <a href="https://im4change.org/upload/files/METHOLOGY%20FOR%20COMPILATION%20OF%20THE%20WAGE%20RATE%20DATA.pdf" title="https://im4change.org/upload/files/METHOLOGY%20FOR%20COMPILATION%20OF%20THE%20WAGE%20RATE%20DATA.pdf">data collection</a>. The <a href="https://im4change.org/upload/files/METHOLOGY%20FOR%20COMPILATION%20OF%20THE%20WAGE%20RATE%20DATA.pdf" title="https://im4change.org/upload/files/METHOLOGY%20FOR%20COMPILATION%20OF%20THE%20WAGE%20RATE%20DATA.pdf">wage rate data</a> are being collected along with rural retail prices from 600 sample villages spread over 66 NSS regions of 20 States by canvassing Block-5 <em>(Annexure-I)</em> of Schedule 3.01(R). The data collection from these sample villages is staggered over the four weeks of a month with one-fourth of them being covered every week. The days of canvassing of Schedule 3.01(R) are fixed. The village functionaries like the Panchayat Secretary, Progress Assistant, Patwari and other Village or Block Officials are the primary informants for collection of data on wage rates. The data on normal working hours and the prevailing wage rates in cash and kind for the reported working hours are collected sex-wise for each of the 18 selected occupations in 20 states, indicates an old&nbsp;<a href="https://im4change.org/upload/files/METHOLOGY%20FOR%20COMPILATION%20OF%20THE%20WAGE%20RATE%20DATA.pdf" title="https://im4change.org/upload/files/METHOLOGY%20FOR%20COMPILATION%20OF%20THE%20WAGE%20RATE%20DATA.pdf">document</a> of the Labour Bureau. &nbsp;&nbsp;</p><p style="text-align:justify">The wage rates are sometimes reported for a duration that is less/more than the normal working hours. In such cases, they are <a href="https://im4change.org/upload/files/METHOLOGY%20FOR%20COMPILATION%20OF%20THE%20WAGE%20RATE%20DATA.pdf" title="https://im4change.org/upload/files/METHOLOGY%20FOR%20COMPILATION%20OF%20THE%20WAGE%20RATE%20DATA.pdf">first normalised for eight hours</a> working day. As regards the mode of payment of wages, it is made in both ways i.e., in cash and/or in kind. The payments made in kind are very common in rural areas, which include foodgrains, cooked food, tea, fuel, cigarette, beedi, fodder, etc.&nbsp;The wages reported in kind are evaluated at local retail prices. Thereafter, the data is thoroughly scrutinised and discrepant points are referred back to the field for clarification. In the next stage, the simple arithmetic average of these normalised daily wage rates is worked out occupation-wise and sex-wise for each state.</p><p style="text-align:justify"><a href="http://ras.org.in/methodology_of_data_collection_unsuited_to_changing_rural_reality" title="http://ras.org.in/methodology_of_data_collection_unsuited_to_changing_rural_reality">Up to June 2000</a>, the average wage rates at the national level were derived by taking the simple average of state figures; since July 2000, the averages have been obtained by dividing the sum total of wages of all 20 states by the number of centres or villages from which data were collected. The state-wise averages are restricted only to those occupations where the number of centres is five or more to avoid abnormal fluctuations and inconsistency in wages paid to different categories of workers on account of varying numbers of centres. However, in order to calculate the all-India averages, all neglected centres are taken into account to arrive at the total number of centres at the national level.</p><p style="text-align:justify">The <a href="/upload/files/RBI%20note%20Average%20Daily%20Wage%20rate%20Methodology.pdf" title="/upload/files/RBI%20note%20Average%20Daily%20Wage%20rate%20Methodology.pdf">Reserve Bank of India</a>&nbsp;<em>(whose data we have used in writing this news alert)</em> has collated and is releasing monthly time series data on rural wage rates based on the data published by the Labour Bureau, Government of India. Starting from November 2013 the Labour Bureau is collecting the rural wage data in respect of 12 agricultural and 13 non-agricultural occupations across 20 major states, namely, Andhra Pradesh, Assam, Bihar, Gujarat, Haryana, Himachal Pradesh, Jammu &amp; Kashmir, Karnataka, Kerala, Madhya Pradesh, Maharashtra, Manipur, Meghalaya, Orissa, Punjab, Rajasthan, Tamil Nadu, Tripura, Uttar Pradesh and West Bengal. The occupations for which the daily wage rates are collected every month are: <u>(A) Agricultural occupations</u> &ndash; (1) &nbsp;Ploughing/ Tilling workers, (2) Sowing <em>(including planting/ Transplanting/ Weeding)</em> workers, (3) Harvesting/ Winnowing/ Threshing workers, (4) Picking workers <em>(including Tea, Cotton, Tobacco and other commercial crops)</em>, (5) Horticulture workers <em>(including nursery growers)</em>, (6) Fishermen-inland, (7) Fishermen coastal/deep-sea, (8) Loggers and wood cutters, (9) Animal husbandry workers <em>(including poultry workers, dairy workers and herdsman)</em>, (10) Packaging labourers, agriculture, (11) General agricultural labourers <em>(including watering/ irrigation workers, etc.)</em>, (12) Plant protection workers <em>(applying pesticides, treating seeds, etc.)</em>; and <u>(B) Non-agricultural occupations</u> &ndash; (13) Carpenter, (14) Blacksmith, (15) Mason, (16) Weavers, (17) Beedi makers, (18) Bamboo, cane basket weavers, (19) Handicraft workers, (20) Plumbers, (21) Electrician, (22) Construction workers <em>(for roads, dams, industrial &amp; project construction work and Well diggers)</em>, (23) LMV &amp; Tractor drivers, (24) Non-agricultural labourers <em>(including porters, loaders)</em>, and (25) Sweeping/cleaning workers.&nbsp;</p><p style="text-align:justify"><strong><em>References&nbsp;</em></strong></p><p style="text-align:justify">Handbook of Statistics on Indian States 2020-21, released in November 2021, please <a href="https://m.rbi.org.in/scripts/AnnualPublications.aspx?head=Handbook%20of%20Statistics%20on%20Indian%20States" title="https://m.rbi.org.in/scripts/AnnualPublications.aspx?head=Handbook%20of%20Statistics%20on%20Indian%20States">click here</a> to access</p><p style="text-align:justify">State-wise Average Daily Wage Rates in Rural India (Men - General Agricultural Labourers), RBI Handbook of Statistics on Indian States 2020-21, released in November 2021, please <a href="/upload/files/State-wise%20Average%20Daily%20Wage%20Rates%20in%20Rural%20India%20Men%20-%20General%20Agricultural%20Labourers.PDF" title="/upload/files/State-wise%20Average%20Daily%20Wage%20Rates%20in%20Rural%20India%20Men%20-%20General%20Agricultural%20Labourers.PDF">click here</a> to access&nbsp;</p><p style="text-align:justify">State-wise Average Daily Wage Rates in Rural India (Men - Non-Agricultural Labourers), RBI Handbook of Statistics on Indian States 2020-21, released in November 2021, please <a href="/upload/files/State-wise%20Average%20Daily%20Wage%20Rates%20in%20Rural%20India%20Men%20-%20Non%20Agricultural%20Labourers.PDF" title="/upload/files/State-wise%20Average%20Daily%20Wage%20Rates%20in%20Rural%20India%20Men%20-%20Non%20Agricultural%20Labourers.PDF">click here</a> to access&nbsp;</p><p style="text-align:justify">State-wise Average Daily Wage Rates in Rural India (Men - Construction Workers), RBI Handbook of Statistics on Indian States 2020-21, released in November 2021, please <a href="/upload/files/State-wise%20Average%20Daily%20Wage%20Rates%20in%20Rural%20India%20Men%20-%20Construction%20Workers.PDF" title="/upload/files/State-wise%20Average%20Daily%20Wage%20Rates%20in%20Rural%20India%20Men%20-%20Construction%20Workers.PDF">click here</a> to access&nbsp;</p><p style="text-align:justify">State-wise Average Inflation (CPI) - Inflation, RBI Handbook of Statistics on Indian States 2020-21, released in November 2021, please <a href="/upload/files/State-wise%20Average%20Inflation%20CPI%20-%20Inflation.PDF" title="/upload/files/State-wise%20Average%20Inflation%20CPI%20-%20Inflation.PDF">click here</a> to access&nbsp;</p><p style="text-align:justify">Indian Labour Journal, February 2013, please <a href="/upload/files/ilj_feb_2013.pdf" title="/upload/files/ilj_feb_2013.pdf">click here</a> to access &nbsp;</p><p style="text-align:justify">Wage Rates in Rural India 2003-04: Methodology for Compilation of the Wage Rate Data, Labour Bureau, please <a href="/upload/files/METHOLOGY%20FOR%20COMPILATION%20OF%20THE%20WAGE%20RATE%20DATA.pdf" title="/upload/files/METHOLOGY%20FOR%20COMPILATION%20OF%20THE%20WAGE%20RATE%20DATA.pdf">click here</a> to access&nbsp; &nbsp;&nbsp;</p><p style="text-align:justify">Average Daily Wage Rates in Rural India: Methodology and coverage (From November 2013), Reserve Bank of India, please <a href="https://dbie.rbi.org.in" title="https://dbie.rbi.org.in">click here</a>&nbsp;and <a href="/upload/files/RBI%20note%20Average%20Daily%20Wage%20rate%20Methodology%281%29.pdf" title="/upload/files/RBI%20note%20Average%20Daily%20Wage%20rate%20Methodology%281%29.pdf">here</a> to access&nbsp;</p><p style="text-align:justify">Consumer Price Index Numbers on Base 2012=100 for Rural, Urban and Combined for the month of January 2022, Ministry of Statistics and Programme Implementation (MoSPI), National Statistical Office (NSO), released on 14th February 2022, please <a href="/upload/files/CPI%20Press%20Release%20January%202022%281%29.pdf" title="/upload/files/CPI%20Press%20Release%20January%202022%281%29.pdf">click here</a> to access&nbsp;</p><p style="text-align:justify">Methodology of Data Collection Unsuited to Changing Rural Reality: A Study of Agricultural Wage Data in India -Yoshifumi Usami, Arindam Das, and Madhura Swaminathan, Review of Agrarian Studies, Vol. 10, No. 2, July-December, 2020, please <a href="http://ras.org.in/methodology_of_data_collection_unsuited_to_changing_rural_reality" title="http://ras.org.in/methodology_of_data_collection_unsuited_to_changing_rural_reality">click here</a> to access</p><p>Russia-ukraine crisis to push up fertiliser prices, govt subsidies, IANS/ Business Standard, 4 March, 2022, please <a href="https://www.business-standard.com/article/economy-policy/russia-ukraine-crisis-to-push-up-fertiliser-prices-govt-subsidies-122030400560_1.html" title="https://www.business-standard.com/article/economy-policy/russia-ukraine-crisis-to-push-up-fertiliser-prices-govt-subsidies-122030400560_1.html">click here</a> to access &nbsp;</p><p>Cooking oil prices spike in India due to Russia-ukraine crisis -B Krishna Mohan, TelanganaToday.com, 3 March, 2022, please <a href="https://telanganatoday.com/cooking-oil-prices-spike-in-india-due-to-russia-ukraine-crisis" title="https://telanganatoday.com/cooking-oil-prices-spike-in-india-due-to-russia-ukraine-crisis">click here</a> to access &nbsp;</p><p>Govt reviews cooking oil imports as ukraine crisis disrupts supplies, prices shoot up -Amiti Sen and Prabhudutta Mishra, The Hindu Business Line, 4 March, 2022, please <a href="https://www.thehindubusinessline.com/markets/commodities/govt-reviews-cooking-oil-imports-as-ukraine-crisis-disrupts-supplies-prices-shoot-up/article65190879.ece" title="https://www.thehindubusinessline.com/markets/commodities/govt-reviews-cooking-oil-imports-as-ukraine-crisis-disrupts-supplies-prices-shoot-up/article65190879.ece">click here</a> to access &nbsp;</p><p>India&#39;s Economy Faces A Potential Stagflation Risk From Ukraine War -Sunil Prabhu, NDTV.com, 1 March, 2022, please <a href="https://www.ndtv.com/business/indias-economy-faces-a-potential-stagflation-risk-from-ukraine-war-2796624" title="https://www.ndtv.com/business/indias-economy-faces-a-potential-stagflation-risk-from-ukraine-war-2796624">click here</a> to access</p><p>India to be one of Asia&rsquo;s &lsquo;biggest losers&rsquo; from the Ukraine war as Russia slammed by global sanctions -Paran Balakrishnan, The Telegraph, 1 March, 2022, please <a href="https://www.telegraphindia.com/business/russia-ukraine-crisis-india-to-be-one-of-asias-biggest-losers-from-the-ukraine-war-as-russia-slammed-by-global-sanctions/cid/1854032" title="https://www.telegraphindia.com/business/russia-ukraine-crisis-india-to-be-one-of-asias-biggest-losers-from-the-ukraine-war-as-russia-slammed-by-global-sanctions/cid/1854032">click here</a> to access</p><p>Crude Oil Prices Rise, Tracking Russia-Ukraine Conflict -Rahul Karunakar, NDTV.com <em>(with inputs from Agencies)</em>, 1 March, 2022, please <a href="https://www.ndtv.com/business/crude-oil-prices-rise-on-tuesday-tracking-russia-ukraine-conflict-2796187" title="https://www.ndtv.com/business/crude-oil-prices-rise-on-tuesday-tracking-russia-ukraine-conflict-2796187">click here</a> to access</p><p>Cooking Oil May Become Costlier Due to Russia-ukraine War. Know Why, News18.com, 27 February, 2022, please <a href="https://www.news18.com/news/business/markets/cooking-oil-may-become-costlier-due-to-russia-ukraine-war-know-why-4812740.html" title="https://www.news18.com/news/business/markets/cooking-oil-may-become-costlier-due-to-russia-ukraine-war-know-why-4812740.html">click here</a> to access &nbsp;</p><p style="text-align:justify"><strong>Image Courtesy: Inclusive Media for Change/ Shambhu Ghatak</strong></p>',
'lang' => 'English',
'SITE_URL' => 'https://im4change.in/',
'site_title' => 'im4change',
'adminprix' => 'admin'
]
$article_current = object(App\Model\Entity\Article) {
'id' => (int) 62349,
'title' => 'Real wage rates of the rural workers hardly increased during the last 6 years',
'subheading' => null,
'description' => '<p style="text-align:justify">In the absence of income or expenditure-based headcount ratio, the growth in the real wages <em>(i.e., nominal wages adjusted against retail inflation)</em> of the manual workers is considered to be a good proxy to assess the trends in poverty. This is because the manual, unskilled/ semi-skilled labourers exist at the bottom of the pyramid or economic hierarchy, and most of them belong to the social categories Scheduled Castes (SCs) and Scheduled Tribes (STs). A positive growth in their real wages <em>(or real wage rates) </em>is anticipated to improve their purchasing power <em>(i.e., income or consumption expenditure)</em> and lift them out of the poverty trap. &nbsp;</p>
<p style="text-align:justify">Clearly, there exists inter-state differences in nominal wage rates, growth in nominal wage rates and growth in real wage rates, which we will see in this news alert.&nbsp;</p>
<p style="text-align:justify">Against the backdrop of the <a href="https://www.thehindubusinessline.com/markets/commodities/govt-reviews-cooking-oil-imports-as-ukraine-crisis-disrupts-supplies-prices-shoot-up/article65190879.ece">Russia-Ukraine conflict</a>, which is anticipated to cause both <a href="https://www.ndtv.com/business/indias-economy-faces-a-potential-stagflation-risk-from-ukraine-war-2796624">food and fuel retail inflation</a> in India in the coming times, it is even more important to look at the past trends in wage rate growth of the rural workers. It should be noted that the <a href="https://public.flourish.studio/visualisation/8706137">year-on-year inflation</a> in <a href="https://public.flourish.studio/visualisation/8706137">Consumer</a> <a href="https://public.flourish.studio/visualisation/8706137">Price Index Rural</a> exceeded the <a href="https://public.flourish.studio/visualisation/8706137">year-on-year inflation</a> in <a href="https://public.flourish.studio/visualisation/8706137">CPI Urban</a> during January 2022 at the national level. Even before the beginning of Russia-Ukraine conflict <em>(i.e., during January 2022)</em>, in rural areas, <a href="https://im4change.org/upload/files/CPI%20Press%20Release%20January%202022%281%29.pdf">retail inflation rate of 20.6 percent</a> was noticed for &#39;oils and fats&#39;, aside from&nbsp;<a href="https://im4change.org/upload/files/CPI%20Press%20Release%20January%202022%281%29.pdf">8.44 percent retail inflation for &#39;fuel and light&#39;</a>, <a href="https://im4change.org/upload/files/CPI%20Press%20Release%20January%202022%281%29.pdf">8.27 percent</a> for &#39;transport and communication&#39;, and <a href="https://im4change.org/upload/files/CPI%20Press%20Release%20January%202022%281%29.pdf">9.65 percent for &#39;clothing and footwear&#39;</a>.&nbsp; &nbsp;&nbsp;</p>
<p style="text-align:justify">At the national level, the average daily nominal wage rate&nbsp;for male construction workers in rural areas during the period from 2014-15 to 2020-21 was Rs. 316.9, which was greater than that of the male non-farm workers in rural areas. The average daily nominal wage rate&nbsp;for male non-agricultural labourers in rural areas during the period from 2014-15 to 2020-21 was Rs. 273.8, which exceeded the average daily nominal wage rates for male farm labourers in rural areas <em>(i.e., Rs. 265.1)</em>. However, in Andhra Pradesh, Haryana, Himachal Pradesh, Jammu and Kashmir,&nbsp;Karnataka, Kerala, Meghalaya, Punjab, and Tripura, the average daily nominal wage rates for male agricultural labourers in rural areas during the period from 2014-15 to 2020-21 exceeded the average daily nominal wage rates for male non-farm labourers in rural areas. Please see chart-1.</p>
<p style="text-align:justify"><img alt="" src="/upload/images/Chart%201.png" style="height:670px; width:1000px" /></p>
<p style="text-align:justify"><em><strong>Notes:</strong> The average (i.e., arithmetic mean) daily nominal wage rates for various categories of workers in rural India in the period from 2014-15 to 2020-21 has been calculated by the Inclusive Media for Change staff</em></p>
<p style="text-align:justify"><em>Please <a href="https://docs.google.com/spreadsheets/d/1avu0-WtaKV2RHXtz2eiP7iS8znGVBdKC/edit?usp=sharing&amp;ouid=112233925171588304692&amp;rtpof=true&amp;sd=true">click here</a> to access the data in spreadsheet format</em></p>
<p style="text-align:justify"><em><strong>Source:&nbsp;</strong>Handbook of Statistics on Indian States 2020-21, released in November 2021, please <a href="https://m.rbi.org.in/scripts/AnnualPublications.aspx?head=Handbook%20of%20Statistics%20on%20Indian%20States">click here</a> to access</em></p>
<p style="text-align:justify"><em>State-wise Average Daily Wage Rates in Rural India (Men - General Agricultural Labourers), RBI Handbook of Statistics on Indian States 2020-21, released in November 2021, please <a href="/upload/files/State-wise%20Average%20Daily%20Wage%20Rates%20in%20Rural%20India%20Men%20-%20General%20Agricultural%20Labourers.PDF">click here</a> to access&nbsp;</em></p>
<p style="text-align:justify"><em>State-wise Average Daily Wage Rates in Rural India (Men - Non-Agricultural Labourers), RBI Handbook of Statistics on Indian States 2020-21, released in November 2021, please <a href="/upload/files/State-wise%20Average%20Daily%20Wage%20Rates%20in%20Rural%20India%20Men%20-%20Non%20Agricultural%20Labourers.PDF">click here</a> to access&nbsp;</em></p>
<p style="text-align:justify"><em>State-wise Average Daily Wage Rates in Rural India (Men - Construction Workers), RBI Handbook of Statistics on Indian States 2020-21, released in November 2021, please <a href="/upload/files/State-wise%20Average%20Daily%20Wage%20Rates%20in%20Rural%20India%20Men%20-%20Construction%20Workers.PDF">click here</a> to access&nbsp;</em></p>
<p style="text-align:justify"><em>State-wise Average Inflation (CPI) - Inflation, RBI Handbook of Statistics on Indian States 2020-21, released in November 2021, please <a href="/upload/files/State-wise%20Average%20Inflation%20CPI%20-%20Inflation.PDF">click here</a> to access&nbsp;</em></p>
<p style="text-align:justify"><strong>---</strong></p>
<p style="text-align:justify">At the national level, the agricultural nominal wage rate&nbsp;grew faster than the non-farm wage&nbsp;rate&nbsp;on average for male labourers in rural areas during the period from 2015-16 to 2020-21. However, in states like Assam, Bihar, Haryana, Madhya Pradesh, Odisha, Punjab, and West Bengal, the non-farm nominal wage rates grew faster than the farm wage rates on average for male workers in rural areas during the period from 2015-16 to 2020-21. Please see chart-2.&nbsp;</p>
<p style="text-align:justify"><img alt="" src="/upload/images/Chart%202.png" style="height:653px; width:1000px" /></p>
<p style="text-align:justify"><em><strong>Notes: </strong>The average growth in daily nominal wage rates for various categories of workers in rural India in the period from 2015-16 to 2020-21 has been calculated by the Inclusive Media for Change staff</em></p>
<p style="text-align:justify"><em>Please <a href="https://docs.google.com/spreadsheets/d/1avu0-WtaKV2RHXtz2eiP7iS8znGVBdKC/edit?usp=sharing&amp;ouid=112233925171588304692&amp;rtpof=true&amp;sd=true">click here</a> to access the data in spreadsheet format</em></p>
<p style="text-align:justify"><em><strong>Source: </strong>Same as above</em><br />
<strong>---</strong></p>
<p style="text-align:justify">At the national level, the construction sector nominal wage rate&nbsp;grew slower than the non-agricultural wage&nbsp;rate&nbsp;on average for male labourers in rural areas during the period from 2015-16 to 2020-21. However, in states like Andhra Pradesh, Bihar, Himachal Pradesh, Maharashtra, Meghalaya, Punjab,&nbsp;Tamil Nadu, and Uttar Pradesh, the construction sector nominal wage rates grew faster than the non-farm wage rates on average for male workers in rural areas during the period from 2015-16 to 2020-21. Please take a look at chart-2. &nbsp;</p>
<p style="text-align:justify">At the national level, the agricultural wage rate&nbsp;in real terms grew faster than the non-farm wage rate&nbsp;on average for male labourers in rural areas during the period from 2015-16 to 2020-21. However, in states like Assam, Bihar, Haryana, Madhya Pradesh, Odisha, Punjab, and West Bengal, the non-farm wage rates in real terms grew faster than the farm wage rates on average for male workers in rural areas during the period from 2015-16 to 2020-21. Please see table-1.</p>
<p style="text-align:justify"><strong>Table 1: State-wise Growth in Average Daily Wage Rates in Real terms for Male Agricultural Labourers, Male Non-Agricultural Labourers, and Male Construction Workers in Rural India, in %</strong><br />
<img alt="" src="/upload/images/Table%201%20State-wise%20Growth%20in%20Average%20Daily%20Wage%20Rates%20in%20Real%20terms%20for%20Male%20Agricultural%20Labourers%20Male%20Non-Agricultural%20Labourers%20and%20Male%20Construction%20Workers%20in%20Rural%20India%20in%20percent.png" style="height:539px; width:750px" /></p>
<p style="text-align:justify"><em><strong>Notes: </strong>The average growth in daily wage rates in real terms for various categories of workers in rural India in the period from 2015-16 to 2020-21 has been calculated by the Inclusive Media for Change staff</em></p>
<p style="text-align:justify"><em>Please <a href="https://docs.google.com/spreadsheets/d/1avu0-WtaKV2RHXtz2eiP7iS8znGVBdKC/edit?usp=sharing&amp;ouid=112233925171588304692&amp;rtpof=true&amp;sd=true">click here</a> to access the data in spreadsheet format</em></p>
<p style="text-align:justify"><em><strong>Source: </strong>Same as above</em><br />
<strong>---</strong></p>
<p style="text-align:justify">At the national level, the construction sector wage rate&nbsp;in real terms grew slower than the non-agricultural wage rate&nbsp;on average for male labourers in rural areas during the period from 2015-16 to 2020-21. However, in states like Andhra Pradesh, Bihar, Himachal Pradesh, Maharashtra, Meghalaya, Punjab, Tamil Nadu, and Uttar Pradesh, the construction sector wage rates in real terms grew faster than the non-farm wage rates on average for male workers in rural areas during the period from 2015-16 to 2020-21. Please take a look at table-1. &nbsp;</p>
<p style="text-align:justify">In the following paragraphs, we have discussed the trends in agricultural wage rates, non-farm wage rates, and construction sector wage rates <em>(in rural areas)</em> in detail.&nbsp;</p>
<p style="text-align:justify"><strong>Agricultural wages in rural areas</strong></p>
<p style="text-align:justify">The highest <a href="https://im4change.org/upload/files/State%20wise%20average%20daily%20nominal%20wage%20rates%20in%20rural%20india%20men%20farm%20labourers.JPG">average daily nominal wage rate</a> <a href="https://im4change.org/upload/files/State%20wise%20average%20daily%20nominal%20wage%20rates%20in%20rural%20india%20men%20farm%20labourers.JPG">for male agricultural labourers</a> in rural India during the period from 2014-15 to 2020-21 was found in Kerala <em>(Rs. 653.93)</em>, followed by Jammu and Kashmir <em>(Rs. 429.19)</em>, Tamil Nadu <em>(Rs. 385.6)</em>, Haryana <em>(Rs. 368.53)</em>, Himachal Pradesh <em>(Rs. 366.23)</em>, and Punjab <em>(Rs. 325.31)</em>. Please have a look at chart-1.</p>
<p style="text-align:justify">The lowest <a href="https://im4change.org/upload/files/State%20wise%20average%20daily%20nominal%20wage%20rates%20in%20rural%20india%20men%20farm%20labourers.JPG">average daily nominal wage rate</a> <a href="https://im4change.org/upload/files/State%20wise%20average%20daily%20nominal%20wage%20rates%20in%20rural%20india%20men%20farm%20labourers.JPG">for male agricultural labourers</a> in rural India during the period from 2014-15 to 2020-21 was observed in Madhya Pradesh <em>(Rs. 183.97)</em>, followed by Gujarat <em>(Rs. 190.07)</em>, Maharashtra <em>(Rs. 215.71)</em>, Odisha <em>(Rs. 216.87)</em>, Meghalaya <em>(Rs. 219.93)</em>, Bihar <em>(Rs. 230.43)</em>, Uttar Pradesh <em>(Rs. 230.5)</em>, and Assam <em>(Rs. 237.3)</em>. The related national level figure was Rs. 265.09 during the period from 2014-15 to 2020-21. Please consult chart-1.&nbsp;</p>
<p style="text-align:justify">The highest <a href="https://im4change.org/upload/files/State%20wise%20growth%20in%20average%20daily%20nominal%20wage%20rates%20in%20rural%20india%20men%20farm%20labourers.JPG">average annual growth rate in</a> <a href="https://im4change.org/upload/files/State%20wise%20growth%20in%20average%20daily%20nominal%20wage%20rates%20in%20rural%20india%20men%20farm%20labourers.JPG">nominal wage rates</a> during the period from 2015-16 to 2020-21 was found in Karnataka <em>(7.3 percent)</em>, followed by Andhra Pradesh <em>(6.8 percent)</em>, Madhya Pradesh <em>(6.4 percent)</em>, Uttar Pradesh <em>(6.2 percent)</em>, Odisha <em>(6.1 percent)</em>, and Meghalaya <em>(6.0 percent)</em>. Please see chart-2.</p>
<p style="text-align:justify">The lowest <a href="https://im4change.org/upload/files/State%20wise%20growth%20in%20average%20daily%20nominal%20wage%20rates%20in%20rural%20india%20men%20farm%20labourers.JPG">average annual growth rate</a> <a href="https://im4change.org/upload/files/State%20wise%20growth%20in%20average%20daily%20nominal%20wage%20rates%20in%20rural%20india%20men%20farm%20labourers.JPG">in nominal wage rates</a> during the same period was noticed in Haryana <em>(2.1 percent)</em>, followed by Rajasthan <em>(3.3 percent)</em>, Kerala <em>(3.5 percent)</em>, Punjab <em>(3.9 percent)</em>, and Tamil Nadu <em>(4.5 percent)</em>. Please consult chart-2.</p>
<p style="text-align:justify">The average annual <a href="https://im4change.org/upload/files/State%20wise%20growth%20in%20average%20daily%20wage%20rates%20in%20real%20terms%20for%20male%20farm%20labourers%20in%20rural%20India.JPG">growth of agricultural labourers&rsquo;</a> <a href="https://im4change.org/upload/files/State%20wise%20growth%20in%20average%20daily%20wage%20rates%20in%20real%20terms%20for%20male%20farm%20labourers%20in%20rural%20India.JPG">wage rates in real terms</a> during the period from 2015-16 to 2020-21 were negative in Haryana <em>(-2.1 percent)</em>, Jammu and Kashmir <em>(-0.3 percent)</em>, Kerala <em>(-1.7 percent)</em>, Punjab <em>(-0.4 percent)</em>, Rajasthan <em>(-1.1 percent)</em>, Tamil Nadu <em>(-0.8 percent)</em>, Tripura <em>(-0.5 percent)</em>, and West Bengal <em>(-0.1 percent)</em>. It should be noted that the <a href="https://im4change.org/upload/files/State-wise%20Average%20Inflation%20CPI%20-%20Inflation.PDF">rate of inflation</a> in <a href="https://im4change.org/upload/files/State-wise%20Average%20Inflation%20CPI%20-%20Inflation.PDF">Consumer Price Index-General</a> has been used to get the average annual growth of agricultural labourers&rsquo; wage rates in real terms. Kindly consult table-1. &nbsp;</p>
<p style="text-align:justify">Some states witnessed negative <a href="https://im4change.org/upload/files/State%20wise%20growth%20in%20average%20daily%20wage%20rates%20in%20real%20terms%20for%20male%20farm%20labourers%20in%20rural%20India.JPG">growth in agricultural labourers&rsquo;</a> <a href="https://im4change.org/upload/files/State%20wise%20growth%20in%20average%20daily%20wage%20rates%20in%20real%20terms%20for%20male%20farm%20labourers%20in%20rural%20India.JPG">wage rates in real terms</a> for more than two years between 2015-16 and 2020-21. For example, <a href="https://im4change.org/upload/files/State%20wise%20growth%20in%20average%20daily%20wage%20rates%20in%20real%20terms%20for%20male%20farm%20labourers%20in%20rural%20India.JPG">Haryana</a> experienced negative growth in 2015-16, 2016-17, 2017-18, 2019-20, and 2020-21. Likewise, <a href="https://im4change.org/upload/files/State%20wise%20growth%20in%20average%20daily%20wage%20rates%20in%20real%20terms%20for%20male%20farm%20labourers%20in%20rural%20India.JPG">Kerala</a> faced negative growth in 2017-18, 2018-19, 2019-20, and 2020-21. &nbsp;</p>
<p style="text-align:justify">At the national level, the <a href="https://im4change.org/upload/files/State%20wise%20growth%20in%20average%20daily%20wage%20rates%20in%20real%20terms%20for%20male%20farm%20labourers%20in%20rural%20India.JPG">agricultural labourers&rsquo;</a> <a href="https://im4change.org/upload/files/State%20wise%20growth%20in%20average%20daily%20wage%20rates%20in%20real%20terms%20for%20male%20farm%20labourers%20in%20rural%20India.JPG">wage rates in real terms</a> on average grew by 1.0 percent annually during the period from 2015-16 to 2020-21.</p>
<p style="text-align:justify">Please <a href="https://docs.google.com/spreadsheets/d/1avu0-WtaKV2RHXtz2eiP7iS8znGVBdKC/edit?usp=sharing&amp;ouid=112233925171588304692&amp;rtpof=true&amp;sd=true">click here</a> to access the spreadsheet in order to look at the trends in <a href="/upload/files/State%20wise%20average%20daily%20nominal%20wage%20rates%20in%20rural%20india%20men%20farm%20labourers.JPG">nominal wage rates</a>, <a href="/upload/files/State%20wise%20growth%20in%20average%20daily%20nominal%20wage%20rates%20in%20rural%20india%20men%20farm%20labourers.JPG">annual growth in nominal wage rates</a> and <a href="/upload/files/State%20wise%20growth%20in%20average%20daily%20wage%20rates%20in%20real%20terms%20for%20male%20farm%20labourers%20in%20rural%20India.JPG">annual growth in real wage rates</a> for farm labourers in rural areas.&nbsp;</p>
<p style="text-align:justify"><strong>Non-agricultural wages in rural areas</strong></p>
<p style="text-align:justify">The rural economy is not just about farming any longer. That is why we have looked at the wage growth in the non-farm sector too.&nbsp;The highest <a href="https://im4change.org/upload/files/State%20wise%20average%20daily%20nominal%20wage%20rates%20in%20rural%20india%20men%20non%20farm%20labourers.JPG">average daily nominal wage rate for male</a> <a href="https://im4change.org/upload/files/State%20wise%20average%20daily%20nominal%20wage%20rates%20in%20rural%20india%20men%20non%20farm%20labourers.JPG">non-agricultural labourers</a> in rural India during the period from 2014-15 to 2020-21 was detected in Kerala <em>(Rs. 639.01)</em>, followed by Jammu and Kashmir <em>(Rs. 426.37)</em>, Tamil Nadu <em>(Rs. 405.77)</em>, Haryana <em>(Rs. 359.24)</em>, Himachal Pradesh <em>(Rs. 311.10)</em>, and Punjab <em>(Rs. 309.09)</em>. Please see chart-1.</p>
<p style="text-align:justify">The lowest average <a href="https://im4change.org/upload/files/State%20wise%20average%20daily%20nominal%20wage%20rates%20in%20rural%20india%20men%20non%20farm%20labourers.JPG">daily nominal wage rate for male</a> <a href="https://im4change.org/upload/files/State%20wise%20average%20daily%20nominal%20wage%20rates%20in%20rural%20india%20men%20non%20farm%20labourers.JPG">non-agricultural labourers in rural India</a> during the period from 2014-15 to 2020-21 was found in Madhya Pradesh <em>(Rs. 191.47)</em>, followed by Meghalaya <em>(Rs. 210.26)</em>, Gujarat <em>(Rs. 213.51)</em>, Odisha <em>(Rs. 218.06)</em>, Maharashtra <em>(Rs. 226.70)</em>, Tripura <em>(Rs. 230.36)</em>, Bihar <em>(Rs. 243.51)</em>, and Uttar Pradesh <em>(Rs. 243.97)</em>. The related national level figure was Rs. 273.79 during the period from 2014-15 to 2020-21. Please see chart-1.</p>
<p style="text-align:justify">The highest <a href="https://im4change.org/upload/files/State%20wise%20growth%20in%20average%20daily%20nominal%20wage%20rates%20in%20rural%20india%20men%20non%20farm%20labourers.JPG">average annual growth rate in</a> <a href="https://im4change.org/upload/files/State%20wise%20growth%20in%20average%20daily%20nominal%20wage%20rates%20in%20rural%20india%20men%20non%20farm%20labourers.JPG">nominal wage rates</a> during the period from 2015-16 to 2020-21 was noticed in Odisha <em>(8.0 percent)</em>, followed by Madhya Pradesh <em>(7.6 percent)</em>, Assam <em>(6.6 percent)</em>, West Bengal <em>(5.9 percent)</em>, Uttar Pradesh and Andhra Pradesh <em>(5.6 percent each)</em>, and Bihar <em>(5.5 percent)</em>. Kindly consult chart-2.</p>
<p style="text-align:justify">The lowest <a href="https://im4change.org/upload/files/State%20wise%20growth%20in%20average%20daily%20nominal%20wage%20rates%20in%20rural%20india%20men%20non%20farm%20labourers.JPG">average annual growth rate</a> <a href="https://im4change.org/upload/files/State%20wise%20growth%20in%20average%20daily%20nominal%20wage%20rates%20in%20rural%20india%20men%20non%20farm%20labourers.JPG">in nominal wage rates</a> during the same period was observed in Kerala <em>(1.8 percent)</em>, followed by Haryana <em>(2.4 percent)</em>, Meghalaya <em>(2.8 percent)</em>, Tamil Nadu and Rajasthan <em>(3.2 percent each)</em>, Tripura and Jammu and Kashmir <em>(4.0 percent each),</em> and Maharashtra and Punjab <em>(4.2 percent each)</em>. Kindly consult chart-2.&nbsp;</p>
<p style="text-align:justify">The average annual <a href="https://im4change.org/upload/files/State%20wise%20growth%20in%20average%20daily%20wage%20rates%20in%20real%20terms%20for%20male%20non%20farm%20labourers%20in%20rural%20India.JPG">growth of non-agricultural labourers&rsquo;</a> <a href="https://im4change.org/upload/files/State%20wise%20growth%20in%20average%20daily%20wage%20rates%20in%20real%20terms%20for%20male%20non%20farm%20labourers%20in%20rural%20India.JPG">wage rates in real terms</a> during the period from 2015-16 to 2020-21 were negative in Haryana <em>(-1.9 percent)</em>, Jammu and Kashmir <em>(-1.7 percent)</em>, Kerala <em>(-3.5 percent)</em>, Maharashtra <em>(-0.3 percent)</em>, Meghalaya <em>(-1.2 percent)</em>, Punjab <em>(-0.1 percent)</em>, Rajasthan <em>(-1.2 percent)</em>, Tamil Nadu <em>(-2.1 percent)</em>, and Tripura <em>(-1.1 percent)</em>. It should be noted that the <a href="https://im4change.org/upload/files/State-wise%20Average%20Inflation%20CPI%20-%20Inflation.PDF">rate of inflation</a> in <a href="https://im4change.org/upload/files/State-wise%20Average%20Inflation%20CPI%20-%20Inflation.PDF">CPI-General</a> has been used to get the average annual growth of non-agricultural labourers&rsquo; wage rates in real terms. Kindly have a look at table-1. &nbsp;&nbsp;</p>
<p style="text-align:justify">Some states experienced negative growth in <a href="https://im4change.org/upload/files/State%20wise%20growth%20in%20average%20daily%20wage%20rates%20in%20real%20terms%20for%20male%20non%20farm%20labourers%20in%20rural%20India.JPG">non-agricultural labourers&rsquo; wage</a> <a href="https://im4change.org/upload/files/State%20wise%20growth%20in%20average%20daily%20wage%20rates%20in%20real%20terms%20for%20male%20non%20farm%20labourers%20in%20rural%20India.JPG">rates in real terms</a> for more than two years between 2015-16 and 2020-21. For example, <a href="https://im4change.org/upload/files/State%20wise%20growth%20in%20average%20daily%20wage%20rates%20in%20real%20terms%20for%20male%20non%20farm%20labourers%20in%20rural%20India.JPG">Haryana</a> experienced negative <a href="https://im4change.org/upload/files/State%20wise%20growth%20in%20average%20daily%20wage%20rates%20in%20real%20terms%20for%20male%20non%20farm%20labourers%20in%20rural%20India.JPG">growth in wage rates</a> <a href="https://im4change.org/upload/files/State%20wise%20growth%20in%20average%20daily%20wage%20rates%20in%20real%20terms%20for%20male%20non%20farm%20labourers%20in%20rural%20India.JPG"><em>(in real terms)</em></a> during 2016-17, 2017-18, 2018-19, 2019-20, and 2020-21. Likewise, <a href="https://im4change.org/upload/files/State%20wise%20growth%20in%20average%20daily%20wage%20rates%20in%20real%20terms%20for%20male%20non%20farm%20labourers%20in%20rural%20India.JPG">Kerala</a> faced negative growth rates in 2015-16, 2016-17, 2017-18, 2019-20, and 2020-21. &nbsp;</p>
<p style="text-align:justify">At the national level, the&nbsp;<a href="https://im4change.org/upload/files/State%20wise%20growth%20in%20average%20daily%20wage%20rates%20in%20real%20terms%20for%20male%20non%20farm%20labourers%20in%20rural%20India.JPG">non-agricultural labourers&rsquo;</a> <a href="https://im4change.org/upload/files/State%20wise%20growth%20in%20average%20daily%20wage%20rates%20in%20real%20terms%20for%20male%20non%20farm%20labourers%20in%20rural%20India.JPG">wage rates in real terms</a> on average grew by just 0.3 percent annually during the period from 2015-16 to 2020-21.&nbsp;</p>
<p style="text-align:justify">Please <a href="https://docs.google.com/spreadsheets/d/1avu0-WtaKV2RHXtz2eiP7iS8znGVBdKC/edit?usp=sharing&amp;ouid=112233925171588304692&amp;rtpof=true&amp;sd=true">click here</a> to access the spreadsheet in order to look at the <a href="/upload/files/State%20wise%20average%20daily%20nominal%20wage%20rates%20in%20rural%20india%20men%20non%20farm%20labourers.JPG">trends in nominal wage rates</a>, <a href="/upload/files/State%20wise%20growth%20in%20average%20daily%20nominal%20wage%20rates%20in%20rural%20india%20men%20non%20farm%20labourers.JPG">annual growth in nominal wage rates</a>, and <a href="/upload/files/State%20wise%20growth%20in%20average%20daily%20wage%20rates%20in%20real%20terms%20for%20male%20non%20farm%20labourers%20in%20rural%20India.JPG">annual growth in real wage rates</a> for non-farm labourers in rural areas.&nbsp;</p>
<p style="text-align:justify"><strong>Construction sector wages in rural areas</strong></p>
<p style="text-align:justify">The <a href="https://im4change.org/upload/files/State%20wise%20average%20daily%20nominal%20wage%20rates%20in%20rural%20india%20men%20construction%20workers.JPG">highest average daily nominal wage rates</a> <a href="https://im4change.org/upload/files/State%20wise%20average%20daily%20nominal%20wage%20rates%20in%20rural%20india%20men%20construction%20workers.JPG">for male construction workers in rural India</a> during the period from 2014-15 to 2020-21 was detected in Kerala <em>(Rs. 810.3)</em>, followed by Jammu and Kashmir <em>(Rs. 445.1)</em>, Tamil Nadu <em>(Rs. 424.1)</em>, Haryana <em>(Rs. 379.9)</em>, Himachal Pradesh <em>(Rs. 368.7)</em>, Rajasthan <em>(Rs. 347.7)</em>, and Punjab <em>(Rs. 339.1)</em>. Kindly see chart-1.&nbsp;</p>
<p style="text-align:justify">The <a href="https://im4change.org/upload/files/State%20wise%20average%20daily%20nominal%20wage%20rates%20in%20rural%20india%20men%20construction%20workers.JPG">lowest average daily nominal wage rates</a> <a href="https://im4change.org/upload/files/State%20wise%20average%20daily%20nominal%20wage%20rates%20in%20rural%20india%20men%20construction%20workers.JPG">for male construction workers in rural areas</a> during the period from 2014-15 to 2020-21 was found in Madhya Pradesh <em>(Rs. 212.4)</em>, followed by Tripura <em>(Rs. 230.4)</em>, Meghalaya <em>(Rs. 231.7)</em>, Odisha <em>(Rs. 247.1)</em>, Gujarat <em>(Rs. 251.8)</em>, Uttar Pradesh <em>(Rs. 267.4)</em>, Bihar <em>(Rs. 270.8)</em>, and West Bengal <em>(Rs. 274.0)</em>. The related national level figure was Rs. 316.9 during the period from 2014-15 to 2020-21. Kindly consult chart-1.</p>
<p style="text-align:justify">The <a href="https://im4change.org/upload/files/State%20wise%20growth%20in%20average%20daily%20nominal%20wage%20rates%20in%20rural%20india%20men%20construction%20workers.JPG">highest average annual growth rates in</a> <a href="https://im4change.org/upload/files/State%20wise%20growth%20in%20average%20daily%20nominal%20wage%20rates%20in%20rural%20india%20men%20construction%20workers.JPG">nominal wage rates</a> during the period from 2015-16 to 2020-21 was noticed in Meghalaya <em>(20.9 percent)</em>, followed by Madhya Pradesh <em>(7.4 percent)</em>, Odisha and Andhra Pradesh <em>(6.8 percent each)</em>, Uttar Pradesh <em>(6.4 percent)</em>, and Bihar <em>(6.2 percent)</em>. Please see chart-2.&nbsp;</p>
<p style="text-align:justify">The <a href="https://im4change.org/upload/files/State%20wise%20growth%20in%20average%20daily%20nominal%20wage%20rates%20in%20rural%20india%20men%20construction%20workers.JPG">lowest average annual growth rates in</a> <a href="https://im4change.org/upload/files/State%20wise%20growth%20in%20average%20daily%20nominal%20wage%20rates%20in%20rural%20india%20men%20construction%20workers.JPG">nominal wage rates</a> during the same period was observed in Kerala <em>(0.9 percent)</em>, followed by Manipur <em>(2.0 percent)</em>, Haryana <em>(2.1 percent)</em>, Jammu and Kashmir <em>(3.0 percent)</em>, Rajasthan <em>(3.2 percent)</em>, and Gujarat <em>(3.6 percent)</em>. Please see chart-2.</p>
<p style="text-align:justify">The <a href="https://im4change.org/upload/files/State%20wise%20growth%20in%20average%20daily%20wage%20rates%20in%20real%20terms%20for%20male%20construction%20workers%20in%20rural%20India%281%29.JPG">average annual growth of construction workers&rsquo;</a> <a href="https://im4change.org/upload/files/State%20wise%20growth%20in%20average%20daily%20wage%20rates%20in%20real%20terms%20for%20male%20construction%20workers%20in%20rural%20India%281%29.JPG">wage rates in real terms</a> during the period from 2015-16 to 2020-21 was negative in Assam <em>(-1.2 percent)</em>, Haryana <em>(-2.1 percent)</em>, Jammu and Kashmir <em>(-2.7 percent)</em>, Karnataka <em>(-0.6 percent)</em>, Kerala <em>(-4.4 percent)</em>, Manipur <em>(-6.3 percent)</em>, Rajasthan <em>(-1.2 percent)</em>, Tamil Nadu <em>(-0.9 percent)</em>, and Tripura <em>(-1.1 percent)</em>. Please note that the <a href="https://im4change.org/upload/files/State-wise%20Average%20Inflation%20CPI%20-%20Inflation.PDF">rate of inflation</a> in <a href="https://im4change.org/upload/files/State-wise%20Average%20Inflation%20CPI%20-%20Inflation.PDF">CPI-General</a> has been used to get the average annual growth of construction workers&rsquo; wage rates in real terms. Kindly have a look at table-1. &nbsp;&nbsp;</p>
<p style="text-align:justify">In the case of Meghalaya, the <a href="https://im4change.org/upload/files/State%20wise%20average%20daily%20nominal%20wage%20rates%20in%20rural%20india%20men%20construction%20workers.JPG">nominal daily wage rate of male construction</a> <a href="https://im4change.org/upload/files/State%20wise%20average%20daily%20nominal%20wage%20rates%20in%20rural%20india%20men%20construction%20workers.JPG">workers</a> fell from Rs. 186.0 in 2016-17 to Rs. 100.0 in 2017-18 i.e., a decline&nbsp;by -46.2 percent over previous year. However, the same bounced back to Rs. 273.2 in 2018-19 i.e., an increase by 173.2 percent over previous year. In <a href="https://im4change.org/upload/files/State%20wise%20growth%20in%20average%20daily%20wage%20rates%20in%20real%20terms%20for%20male%20construction%20workers%20in%20rural%20India%281%29.JPG">real terms, the construction sector</a> <a href="https://im4change.org/upload/files/State%20wise%20growth%20in%20average%20daily%20wage%20rates%20in%20real%20terms%20for%20male%20construction%20workers%20in%20rural%20India%281%29.JPG">wage rate in Meghalaya</a> grew by -47.7 percent in 2017-18 <em>(over previous year)</em> and 171.0 percent in 2018-19 <em>(over previous year)</em>.</p>
<p style="text-align:justify">Some states experienced negative <a href="https://im4change.org/upload/files/State%20wise%20growth%20in%20average%20daily%20wage%20rates%20in%20real%20terms%20for%20male%20construction%20workers%20in%20rural%20India%281%29.JPG">growth in construction workers&rsquo;</a> <a href="https://im4change.org/upload/files/State%20wise%20growth%20in%20average%20daily%20wage%20rates%20in%20real%20terms%20for%20male%20construction%20workers%20in%20rural%20India%281%29.JPG">wage rates in real terms</a> for more than two years between 2015-16 and 2020-21. For example, <a href="https://im4change.org/upload/files/State%20wise%20growth%20in%20average%20daily%20wage%20rates%20in%20real%20terms%20for%20male%20construction%20workers%20in%20rural%20India%281%29.JPG">Assam</a> experienced negative growth in wage rates <em>(in real terms)</em> during 2017-18, 2018-19, 2019-20, and 2020-21. &nbsp;</p>
<p style="text-align:justify">At the national level, the&nbsp;<a href="https://im4change.org/upload/files/State%20wise%20growth%20in%20average%20daily%20wage%20rates%20in%20real%20terms%20for%20male%20construction%20workers%20in%20rural%20India%281%29.JPG">construction workers&rsquo; wage rates in real terms</a> on average grew by just 0.1 percent annually during the period from 2015-16 to 2020-21.</p>
<p style="text-align:justify">Kindly <a href="https://docs.google.com/spreadsheets/d/1avu0-WtaKV2RHXtz2eiP7iS8znGVBdKC/edit?usp=sharing&amp;ouid=112233925171588304692&amp;rtpof=true&amp;sd=true">click here</a> to access the spreadsheet in order to look at the <a href="/upload/files/State%20wise%20average%20daily%20nominal%20wage%20rates%20in%20rural%20india%20men%20construction%20workers.JPG">trends in nominal wage rates</a>, <a href="/upload/files/State%20wise%20growth%20in%20average%20daily%20nominal%20wage%20rates%20in%20rural%20india%20men%20construction%20workers.JPG">annual growth in nominal wage rates</a>, and <a href="/upload/files/State%20wise%20growth%20in%20average%20daily%20wage%20rates%20in%20real%20terms%20for%20male%20construction%20workers%20in%20rural%20India%281%29.JPG">annual growth in real wage rates</a> for construction workers in rural areas.&nbsp;</p>
<p style="text-align:justify"><strong>Data collection methodology</strong></p>
<p style="text-align:justify">As a part of Rural Labour Enquiry, the&nbsp;<a href="https://im4change.org/upload/files/ilj_feb_2013.pdf">daily wage rates</a> in respect of eighteen agricultural and non-agricultural occupations are being collected along with rural retail price data by the Field Operations Division of the National Sample Survey Organisation since 1986-87, according to a February 2013 <a href="https://im4change.org/upload/files/ilj_feb_2013.pdf">edition of the Indian Labour Journal</a>.&nbsp;On the recommendations of the Governing Council of the National Sample Survey Organisation in its 61st meeting,&nbsp;the <a href="https://im4change.org/upload/files/ilj_feb_2013.pdf">Labour Bureau</a> started the compilation and analysis of wage rate data with effect from April, 1998.&nbsp;</p>
<p style="text-align:justify">The Field Operations Division of the National Sample Survey Organisation has been entrusted with the work of <a href="https://im4change.org/upload/files/METHOLOGY%20FOR%20COMPILATION%20OF%20THE%20WAGE%20RATE%20DATA.pdf">data collection</a>. The <a href="https://im4change.org/upload/files/METHOLOGY%20FOR%20COMPILATION%20OF%20THE%20WAGE%20RATE%20DATA.pdf">wage rate data</a> are being collected along with rural retail prices from 600 sample villages spread over 66 NSS regions of 20 States by canvassing Block-5 <em>(Annexure-I)</em> of Schedule 3.01(R). The data collection from these sample villages is staggered over the four weeks of a month with one-fourth of them being covered every week. The days of canvassing of Schedule 3.01(R) are fixed. The village functionaries like the Panchayat Secretary, Progress Assistant, Patwari and other Village or Block Officials are the primary informants for collection of data on wage rates. The data on normal working hours and the prevailing wage rates in cash and kind for the reported working hours are collected sex-wise for each of the 18 selected occupations in 20 states, indicates an old&nbsp;<a href="https://im4change.org/upload/files/METHOLOGY%20FOR%20COMPILATION%20OF%20THE%20WAGE%20RATE%20DATA.pdf">document</a> of the Labour Bureau. &nbsp;&nbsp;</p>
<p style="text-align:justify">The wage rates are sometimes reported for a duration that is less/more than the normal working hours. In such cases, they are <a href="https://im4change.org/upload/files/METHOLOGY%20FOR%20COMPILATION%20OF%20THE%20WAGE%20RATE%20DATA.pdf">first normalised for eight hours</a> working day. As regards the mode of payment of wages, it is made in both ways i.e., in cash and/or in kind. The payments made in kind are very common in rural areas, which include foodgrains, cooked food, tea, fuel, cigarette, beedi, fodder, etc.&nbsp;The wages reported in kind are evaluated at local retail prices. Thereafter, the data is thoroughly scrutinised and discrepant points are referred back to the field for clarification. In the next stage, the simple arithmetic average of these normalised daily wage rates is worked out occupation-wise and sex-wise for each state.</p>
<p style="text-align:justify"><a href="http://ras.org.in/methodology_of_data_collection_unsuited_to_changing_rural_reality">Up to June 2000</a>, the average wage rates at the national level were derived by taking the simple average of state figures; since July 2000, the averages have been obtained by dividing the sum total of wages of all 20 states by the number of centres or villages from which data were collected. The state-wise averages are restricted only to those occupations where the number of centres is five or more to avoid abnormal fluctuations and inconsistency in wages paid to different categories of workers on account of varying numbers of centres. However, in order to calculate the all-India averages, all neglected centres are taken into account to arrive at the total number of centres at the national level.</p>
<p style="text-align:justify">The <a href="/upload/files/RBI%20note%20Average%20Daily%20Wage%20rate%20Methodology.pdf">Reserve Bank of India</a>&nbsp;<em>(whose data we have used in writing this news alert)</em> has collated and is releasing monthly time series data on rural wage rates based on the data published by the Labour Bureau, Government of India. Starting from November 2013 the Labour Bureau is collecting the rural wage data in respect of 12 agricultural and 13 non-agricultural occupations across 20 major states, namely, Andhra Pradesh, Assam, Bihar, Gujarat, Haryana, Himachal Pradesh, Jammu &amp; Kashmir, Karnataka, Kerala, Madhya Pradesh, Maharashtra, Manipur, Meghalaya, Orissa, Punjab, Rajasthan, Tamil Nadu, Tripura, Uttar Pradesh and West Bengal. The occupations for which the daily wage rates are collected every month are: <u>(A) Agricultural occupations</u> &ndash; (1) &nbsp;Ploughing/ Tilling workers, (2) Sowing <em>(including planting/ Transplanting/ Weeding)</em> workers, (3) Harvesting/ Winnowing/ Threshing workers, (4) Picking workers <em>(including Tea, Cotton, Tobacco and other commercial crops)</em>, (5) Horticulture workers <em>(including nursery growers)</em>, (6) Fishermen-inland, (7) Fishermen coastal/deep-sea, (8) Loggers and wood cutters, (9) Animal husbandry workers <em>(including poultry workers, dairy workers and herdsman)</em>, (10) Packaging labourers, agriculture, (11) General agricultural labourers <em>(including watering/ irrigation workers, etc.)</em>, (12) Plant protection workers <em>(applying pesticides, treating seeds, etc.)</em>; and <u>(B) Non-agricultural occupations</u> &ndash; (13) Carpenter, (14) Blacksmith, (15) Mason, (16) Weavers, (17) Beedi makers, (18) Bamboo, cane basket weavers, (19) Handicraft workers, (20) Plumbers, (21) Electrician, (22) Construction workers <em>(for roads, dams, industrial &amp; project construction work and Well diggers)</em>, (23) LMV &amp; Tractor drivers, (24) Non-agricultural labourers <em>(including porters, loaders)</em>, and (25) Sweeping/cleaning workers.&nbsp;</p>
<p style="text-align:justify"><strong><em>References&nbsp;</em></strong></p>
<p style="text-align:justify">Handbook of Statistics on Indian States 2020-21, released in November 2021, please <a href="https://m.rbi.org.in/scripts/AnnualPublications.aspx?head=Handbook%20of%20Statistics%20on%20Indian%20States">click here</a> to access</p>
<p style="text-align:justify">State-wise Average Daily Wage Rates in Rural India (Men - General Agricultural Labourers), RBI Handbook of Statistics on Indian States 2020-21, released in November 2021, please <a href="/upload/files/State-wise%20Average%20Daily%20Wage%20Rates%20in%20Rural%20India%20Men%20-%20General%20Agricultural%20Labourers.PDF">click here</a> to access&nbsp;</p>
<p style="text-align:justify">State-wise Average Daily Wage Rates in Rural India (Men - Non-Agricultural Labourers), RBI Handbook of Statistics on Indian States 2020-21, released in November 2021, please <a href="/upload/files/State-wise%20Average%20Daily%20Wage%20Rates%20in%20Rural%20India%20Men%20-%20Non%20Agricultural%20Labourers.PDF">click here</a> to access&nbsp;</p>
<p style="text-align:justify">State-wise Average Daily Wage Rates in Rural India (Men - Construction Workers), RBI Handbook of Statistics on Indian States 2020-21, released in November 2021, please <a href="/upload/files/State-wise%20Average%20Daily%20Wage%20Rates%20in%20Rural%20India%20Men%20-%20Construction%20Workers.PDF">click here</a> to access&nbsp;</p>
<p style="text-align:justify">State-wise Average Inflation (CPI) - Inflation, RBI Handbook of Statistics on Indian States 2020-21, released in November 2021, please <a href="/upload/files/State-wise%20Average%20Inflation%20CPI%20-%20Inflation.PDF">click here</a> to access&nbsp;</p>
<p style="text-align:justify">Indian Labour Journal, February 2013, please <a href="/upload/files/ilj_feb_2013.pdf">click here</a> to access &nbsp;</p>
<p style="text-align:justify">Wage Rates in Rural India 2003-04: Methodology for Compilation of the Wage Rate Data, Labour Bureau, please <a href="/upload/files/METHOLOGY%20FOR%20COMPILATION%20OF%20THE%20WAGE%20RATE%20DATA.pdf">click here</a> to access&nbsp; &nbsp;&nbsp;</p>
<p style="text-align:justify">Average Daily Wage Rates in Rural India: Methodology and coverage (From November 2013), Reserve Bank of India, please <a href="https://dbie.rbi.org.in">click here</a>&nbsp;and <a href="/upload/files/RBI%20note%20Average%20Daily%20Wage%20rate%20Methodology%281%29.pdf">here</a> to access&nbsp;</p>
<p style="text-align:justify">Consumer Price Index Numbers on Base 2012=100 for Rural, Urban and Combined for the month of January 2022, Ministry of Statistics and Programme Implementation (MoSPI), National Statistical Office (NSO), released on 14th February 2022, please <a href="/upload/files/CPI%20Press%20Release%20January%202022%281%29.pdf">click here</a> to access&nbsp;</p>
<p style="text-align:justify">Methodology of Data Collection Unsuited to Changing Rural Reality: A Study of Agricultural Wage Data in India -Yoshifumi Usami, Arindam Das, and Madhura Swaminathan, Review of Agrarian Studies, Vol. 10, No. 2, July-December, 2020, please <a href="http://ras.org.in/methodology_of_data_collection_unsuited_to_changing_rural_reality">click here</a> to access</p>
<p>Russia-ukraine crisis to push up fertiliser prices, govt subsidies, IANS/ Business Standard, 4 March, 2022, please <a href="https://www.business-standard.com/article/economy-policy/russia-ukraine-crisis-to-push-up-fertiliser-prices-govt-subsidies-122030400560_1.html">click here</a> to access &nbsp;</p>
<p>Cooking oil prices spike in India due to Russia-ukraine crisis -B Krishna Mohan, TelanganaToday.com, 3 March, 2022, please <a href="https://telanganatoday.com/cooking-oil-prices-spike-in-india-due-to-russia-ukraine-crisis">click here</a> to access &nbsp;</p>
<p>Govt reviews cooking oil imports as ukraine crisis disrupts supplies, prices shoot up -Amiti Sen and Prabhudutta Mishra, The Hindu Business Line, 4 March, 2022, please <a href="https://www.thehindubusinessline.com/markets/commodities/govt-reviews-cooking-oil-imports-as-ukraine-crisis-disrupts-supplies-prices-shoot-up/article65190879.ece">click here</a> to access &nbsp;</p>
<p>India&#39;s Economy Faces A Potential Stagflation Risk From Ukraine War -Sunil Prabhu, NDTV.com, 1 March, 2022, please <a href="https://www.ndtv.com/business/indias-economy-faces-a-potential-stagflation-risk-from-ukraine-war-2796624">click here</a> to access</p>
<p>India to be one of Asia&rsquo;s &lsquo;biggest losers&rsquo; from the Ukraine war as Russia slammed by global sanctions -Paran Balakrishnan, The Telegraph, 1 March, 2022, please <a href="https://www.telegraphindia.com/business/russia-ukraine-crisis-india-to-be-one-of-asias-biggest-losers-from-the-ukraine-war-as-russia-slammed-by-global-sanctions/cid/1854032">click here</a> to access</p>
<p>Crude Oil Prices Rise, Tracking Russia-Ukraine Conflict -Rahul Karunakar, NDTV.com <em>(with inputs from Agencies)</em>, 1 March, 2022, please <a href="https://www.ndtv.com/business/crude-oil-prices-rise-on-tuesday-tracking-russia-ukraine-conflict-2796187">click here</a> to access</p>
<p>Cooking Oil May Become Costlier Due to Russia-ukraine War. Know Why, News18.com, 27 February, 2022, please <a href="https://www.news18.com/news/business/markets/cooking-oil-may-become-costlier-due-to-russia-ukraine-war-know-why-4812740.html">click here</a> to access &nbsp;</p>
<p style="text-align:justify"><strong>Image Courtesy: Inclusive Media for Change/ Shambhu Ghatak</strong></p>
',
'credit_writer' => '',
'article_img' => 'Image construction worker 11 Mar 2022.jpg',
'article_img_thumb' => 'Image construction worker 11 Mar 2022.jpg',
'status' => (int) 1,
'show_on_home' => (int) 1,
'lang' => 'EN',
'category_id' => (int) 4,
'tag_keyword' => '',
'seo_url' => 'real-wage-rates-of-the-rural-workers-hardly-increased-during-the-past-6-years',
'meta_title' => '',
'meta_keywords' => '',
'meta_description' => '',
'noindex' => (int) 1,
'publish_date' => object(Cake\I18n\FrozenDate) {},
'most_visit_section_id' => null,
'article_big_img' => null,
'liveid' => null,
'created' => object(Cake\I18n\FrozenTime) {},
'modified' => object(Cake\I18n\FrozenTime) {},
'edate' => '',
'tags' => [
(int) 0 => object(Cake\ORM\Entity) {},
(int) 1 => object(Cake\ORM\Entity) {},
(int) 2 => object(Cake\ORM\Entity) {},
(int) 3 => object(Cake\ORM\Entity) {},
(int) 4 => object(Cake\ORM\Entity) {},
(int) 5 => object(Cake\ORM\Entity) {},
(int) 6 => object(Cake\ORM\Entity) {},
(int) 7 => object(Cake\ORM\Entity) {},
(int) 8 => object(Cake\ORM\Entity) {},
(int) 9 => object(Cake\ORM\Entity) {},
(int) 10 => object(Cake\ORM\Entity) {},
(int) 11 => object(Cake\ORM\Entity) {},
(int) 12 => object(Cake\ORM\Entity) {},
(int) 13 => object(Cake\ORM\Entity) {},
(int) 14 => object(Cake\ORM\Entity) {},
(int) 15 => object(Cake\ORM\Entity) {},
(int) 16 => object(Cake\ORM\Entity) {}
],
'category' => object(App\Model\Entity\Category) {},
'[new]' => false,
'[accessible]' => [
'*' => true,
'id' => false
],
'[dirty]' => [],
'[original]' => [],
'[virtual]' => [],
'[hasErrors]' => false,
'[errors]' => [],
'[invalid]' => [],
'[repository]' => 'Articles'
}
$articleid = (int) 62349
$metaTitle = 'NEWS ALERTS | Real wage rates of the rural workers hardly increased during the last 6 years'
$metaKeywords = 'Construction Workers,Consumer Price Index,CPI Rural,CPI Urban,Farm Labourers,Farm Workers,Food Inflation,Food Prices,Fuel Inflation,Fuel Prices,Nominal Wage Rate,Non-Farm Labourers,Non-Farm Workers,Real Wage Growth,Real Wages,Retail Inflation,Rural Workers'
$metaDesc = 'In the absence of income or expenditure-based headcount ratio, the growth in the real wages (i.e., nominal wages adjusted against retail inflation) of the manual workers is considered to be a good proxy to assess the trends in poverty. This...'
$disp = '<p style="text-align:justify">In the absence of income or expenditure-based headcount ratio, the growth in the real wages <em>(i.e., nominal wages adjusted against retail inflation)</em> of the manual workers is considered to be a good proxy to assess the trends in poverty. This is because the manual, unskilled/ semi-skilled labourers exist at the bottom of the pyramid or economic hierarchy, and most of them belong to the social categories Scheduled Castes (SCs) and Scheduled Tribes (STs). A positive growth in their real wages <em>(or real wage rates) </em>is anticipated to improve their purchasing power <em>(i.e., income or consumption expenditure)</em> and lift them out of the poverty trap. &nbsp;</p><p style="text-align:justify">Clearly, there exists inter-state differences in nominal wage rates, growth in nominal wage rates and growth in real wage rates, which we will see in this news alert.&nbsp;</p><p style="text-align:justify">Against the backdrop of the <a href="https://www.thehindubusinessline.com/markets/commodities/govt-reviews-cooking-oil-imports-as-ukraine-crisis-disrupts-supplies-prices-shoot-up/article65190879.ece" title="https://www.thehindubusinessline.com/markets/commodities/govt-reviews-cooking-oil-imports-as-ukraine-crisis-disrupts-supplies-prices-shoot-up/article65190879.ece">Russia-Ukraine conflict</a>, which is anticipated to cause both <a href="https://www.ndtv.com/business/indias-economy-faces-a-potential-stagflation-risk-from-ukraine-war-2796624" title="https://www.ndtv.com/business/indias-economy-faces-a-potential-stagflation-risk-from-ukraine-war-2796624">food and fuel retail inflation</a> in India in the coming times, it is even more important to look at the past trends in wage rate growth of the rural workers. It should be noted that the <a href="https://public.flourish.studio/visualisation/8706137" title="https://public.flourish.studio/visualisation/8706137">year-on-year inflation</a> in <a href="https://public.flourish.studio/visualisation/8706137" title="https://public.flourish.studio/visualisation/8706137">Consumer</a> <a href="https://public.flourish.studio/visualisation/8706137" title="https://public.flourish.studio/visualisation/8706137">Price Index Rural</a> exceeded the <a href="https://public.flourish.studio/visualisation/8706137" title="https://public.flourish.studio/visualisation/8706137">year-on-year inflation</a> in <a href="https://public.flourish.studio/visualisation/8706137" title="https://public.flourish.studio/visualisation/8706137">CPI Urban</a> during January 2022 at the national level. Even before the beginning of Russia-Ukraine conflict <em>(i.e., during January 2022)</em>, in rural areas, <a href="https://im4change.org/upload/files/CPI%20Press%20Release%20January%202022%281%29.pdf" title="https://im4change.org/upload/files/CPI%20Press%20Release%20January%202022%281%29.pdf">retail inflation rate of 20.6 percent</a> was noticed for &#39;oils and fats&#39;, aside from&nbsp;<a href="https://im4change.org/upload/files/CPI%20Press%20Release%20January%202022%281%29.pdf" title="https://im4change.org/upload/files/CPI%20Press%20Release%20January%202022%281%29.pdf">8.44 percent retail inflation for &#39;fuel and light&#39;</a>, <a href="https://im4change.org/upload/files/CPI%20Press%20Release%20January%202022%281%29.pdf" title="https://im4change.org/upload/files/CPI%20Press%20Release%20January%202022%281%29.pdf">8.27 percent</a> for &#39;transport and communication&#39;, and <a href="https://im4change.org/upload/files/CPI%20Press%20Release%20January%202022%281%29.pdf" title="https://im4change.org/upload/files/CPI%20Press%20Release%20January%202022%281%29.pdf">9.65 percent for &#39;clothing and footwear&#39;</a>.&nbsp; &nbsp;&nbsp;</p><p style="text-align:justify">At the national level, the average daily nominal wage rate&nbsp;for male construction workers in rural areas during the period from 2014-15 to 2020-21 was Rs. 316.9, which was greater than that of the male non-farm workers in rural areas. The average daily nominal wage rate&nbsp;for male non-agricultural labourers in rural areas during the period from 2014-15 to 2020-21 was Rs. 273.8, which exceeded the average daily nominal wage rates for male farm labourers in rural areas <em>(i.e., Rs. 265.1)</em>. However, in Andhra Pradesh, Haryana, Himachal Pradesh, Jammu and Kashmir,&nbsp;Karnataka, Kerala, Meghalaya, Punjab, and Tripura, the average daily nominal wage rates for male agricultural labourers in rural areas during the period from 2014-15 to 2020-21 exceeded the average daily nominal wage rates for male non-farm labourers in rural areas. Please see chart-1.</p><p style="text-align:justify"><img alt="" src="/upload/images/Chart%201.png" style="height:670px; width:1000px" /></p><p style="text-align:justify"><em><strong>Notes:</strong> The average (i.e., arithmetic mean) daily nominal wage rates for various categories of workers in rural India in the period from 2014-15 to 2020-21 has been calculated by the Inclusive Media for Change staff</em></p><p style="text-align:justify"><em>Please <a href="https://docs.google.com/spreadsheets/d/1avu0-WtaKV2RHXtz2eiP7iS8znGVBdKC/edit?usp=sharing&amp;ouid=112233925171588304692&amp;rtpof=true&amp;sd=true" title="https://docs.google.com/spreadsheets/d/1avu0-WtaKV2RHXtz2eiP7iS8znGVBdKC/edit?usp=sharing&amp;ouid=112233925171588304692&amp;rtpof=true&amp;sd=true">click here</a> to access the data in spreadsheet format</em></p><p style="text-align:justify"><em><strong>Source:&nbsp;</strong>Handbook of Statistics on Indian States 2020-21, released in November 2021, please <a href="https://m.rbi.org.in/scripts/AnnualPublications.aspx?head=Handbook%20of%20Statistics%20on%20Indian%20States" title="https://m.rbi.org.in/scripts/AnnualPublications.aspx?head=Handbook%20of%20Statistics%20on%20Indian%20States">click here</a> to access</em></p><p style="text-align:justify"><em>State-wise Average Daily Wage Rates in Rural India (Men - General Agricultural Labourers), RBI Handbook of Statistics on Indian States 2020-21, released in November 2021, please <a href="/upload/files/State-wise%20Average%20Daily%20Wage%20Rates%20in%20Rural%20India%20Men%20-%20General%20Agricultural%20Labourers.PDF" title="/upload/files/State-wise%20Average%20Daily%20Wage%20Rates%20in%20Rural%20India%20Men%20-%20General%20Agricultural%20Labourers.PDF">click here</a> to access&nbsp;</em></p><p style="text-align:justify"><em>State-wise Average Daily Wage Rates in Rural India (Men - Non-Agricultural Labourers), RBI Handbook of Statistics on Indian States 2020-21, released in November 2021, please <a href="/upload/files/State-wise%20Average%20Daily%20Wage%20Rates%20in%20Rural%20India%20Men%20-%20Non%20Agricultural%20Labourers.PDF" title="/upload/files/State-wise%20Average%20Daily%20Wage%20Rates%20in%20Rural%20India%20Men%20-%20Non%20Agricultural%20Labourers.PDF">click here</a> to access&nbsp;</em></p><p style="text-align:justify"><em>State-wise Average Daily Wage Rates in Rural India (Men - Construction Workers), RBI Handbook of Statistics on Indian States 2020-21, released in November 2021, please <a href="/upload/files/State-wise%20Average%20Daily%20Wage%20Rates%20in%20Rural%20India%20Men%20-%20Construction%20Workers.PDF" title="/upload/files/State-wise%20Average%20Daily%20Wage%20Rates%20in%20Rural%20India%20Men%20-%20Construction%20Workers.PDF">click here</a> to access&nbsp;</em></p><p style="text-align:justify"><em>State-wise Average Inflation (CPI) - Inflation, RBI Handbook of Statistics on Indian States 2020-21, released in November 2021, please <a href="/upload/files/State-wise%20Average%20Inflation%20CPI%20-%20Inflation.PDF" title="/upload/files/State-wise%20Average%20Inflation%20CPI%20-%20Inflation.PDF">click here</a> to access&nbsp;</em></p><p style="text-align:justify"><strong>---</strong></p><p style="text-align:justify">At the national level, the agricultural nominal wage rate&nbsp;grew faster than the non-farm wage&nbsp;rate&nbsp;on average for male labourers in rural areas during the period from 2015-16 to 2020-21. However, in states like Assam, Bihar, Haryana, Madhya Pradesh, Odisha, Punjab, and West Bengal, the non-farm nominal wage rates grew faster than the farm wage rates on average for male workers in rural areas during the period from 2015-16 to 2020-21. Please see chart-2.&nbsp;</p><p style="text-align:justify"><img alt="" src="/upload/images/Chart%202.png" style="height:653px; width:1000px" /></p><p style="text-align:justify"><em><strong>Notes: </strong>The average growth in daily nominal wage rates for various categories of workers in rural India in the period from 2015-16 to 2020-21 has been calculated by the Inclusive Media for Change staff</em></p><p style="text-align:justify"><em>Please <a href="https://docs.google.com/spreadsheets/d/1avu0-WtaKV2RHXtz2eiP7iS8znGVBdKC/edit?usp=sharing&amp;ouid=112233925171588304692&amp;rtpof=true&amp;sd=true" title="https://docs.google.com/spreadsheets/d/1avu0-WtaKV2RHXtz2eiP7iS8znGVBdKC/edit?usp=sharing&amp;ouid=112233925171588304692&amp;rtpof=true&amp;sd=true">click here</a> to access the data in spreadsheet format</em></p><p style="text-align:justify"><em><strong>Source: </strong>Same as above</em><br /><strong>---</strong></p><p style="text-align:justify">At the national level, the construction sector nominal wage rate&nbsp;grew slower than the non-agricultural wage&nbsp;rate&nbsp;on average for male labourers in rural areas during the period from 2015-16 to 2020-21. However, in states like Andhra Pradesh, Bihar, Himachal Pradesh, Maharashtra, Meghalaya, Punjab,&nbsp;Tamil Nadu, and Uttar Pradesh, the construction sector nominal wage rates grew faster than the non-farm wage rates on average for male workers in rural areas during the period from 2015-16 to 2020-21. Please take a look at chart-2. &nbsp;</p><p style="text-align:justify">At the national level, the agricultural wage rate&nbsp;in real terms grew faster than the non-farm wage rate&nbsp;on average for male labourers in rural areas during the period from 2015-16 to 2020-21. However, in states like Assam, Bihar, Haryana, Madhya Pradesh, Odisha, Punjab, and West Bengal, the non-farm wage rates in real terms grew faster than the farm wage rates on average for male workers in rural areas during the period from 2015-16 to 2020-21. Please see table-1.</p><p style="text-align:justify"><strong>Table 1: State-wise Growth in Average Daily Wage Rates in Real terms for Male Agricultural Labourers, Male Non-Agricultural Labourers, and Male Construction Workers in Rural India, in %</strong><br /><img alt="" src="/upload/images/Table%201%20State-wise%20Growth%20in%20Average%20Daily%20Wage%20Rates%20in%20Real%20terms%20for%20Male%20Agricultural%20Labourers%20Male%20Non-Agricultural%20Labourers%20and%20Male%20Construction%20Workers%20in%20Rural%20India%20in%20percent.png" style="height:539px; width:750px" /></p><p style="text-align:justify"><em><strong>Notes: </strong>The average growth in daily wage rates in real terms for various categories of workers in rural India in the period from 2015-16 to 2020-21 has been calculated by the Inclusive Media for Change staff</em></p><p style="text-align:justify"><em>Please <a href="https://docs.google.com/spreadsheets/d/1avu0-WtaKV2RHXtz2eiP7iS8znGVBdKC/edit?usp=sharing&amp;ouid=112233925171588304692&amp;rtpof=true&amp;sd=true" title="https://docs.google.com/spreadsheets/d/1avu0-WtaKV2RHXtz2eiP7iS8znGVBdKC/edit?usp=sharing&amp;ouid=112233925171588304692&amp;rtpof=true&amp;sd=true">click here</a> to access the data in spreadsheet format</em></p><p style="text-align:justify"><em><strong>Source: </strong>Same as above</em><br /><strong>---</strong></p><p style="text-align:justify">At the national level, the construction sector wage rate&nbsp;in real terms grew slower than the non-agricultural wage rate&nbsp;on average for male labourers in rural areas during the period from 2015-16 to 2020-21. However, in states like Andhra Pradesh, Bihar, Himachal Pradesh, Maharashtra, Meghalaya, Punjab, Tamil Nadu, and Uttar Pradesh, the construction sector wage rates in real terms grew faster than the non-farm wage rates on average for male workers in rural areas during the period from 2015-16 to 2020-21. Please take a look at table-1. &nbsp;</p><p style="text-align:justify">In the following paragraphs, we have discussed the trends in agricultural wage rates, non-farm wage rates, and construction sector wage rates <em>(in rural areas)</em> in detail.&nbsp;</p><p style="text-align:justify"><strong>Agricultural wages in rural areas</strong></p><p style="text-align:justify">The highest <a href="https://im4change.org/upload/files/State%20wise%20average%20daily%20nominal%20wage%20rates%20in%20rural%20india%20men%20farm%20labourers.JPG" title="https://im4change.org/upload/files/State%20wise%20average%20daily%20nominal%20wage%20rates%20in%20rural%20india%20men%20farm%20labourers.JPG">average daily nominal wage rate</a> <a href="https://im4change.org/upload/files/State%20wise%20average%20daily%20nominal%20wage%20rates%20in%20rural%20india%20men%20farm%20labourers.JPG" title="https://im4change.org/upload/files/State%20wise%20average%20daily%20nominal%20wage%20rates%20in%20rural%20india%20men%20farm%20labourers.JPG">for male agricultural labourers</a> in rural India during the period from 2014-15 to 2020-21 was found in Kerala <em>(Rs. 653.93)</em>, followed by Jammu and Kashmir <em>(Rs. 429.19)</em>, Tamil Nadu <em>(Rs. 385.6)</em>, Haryana <em>(Rs. 368.53)</em>, Himachal Pradesh <em>(Rs. 366.23)</em>, and Punjab <em>(Rs. 325.31)</em>. Please have a look at chart-1.</p><p style="text-align:justify">The lowest <a href="https://im4change.org/upload/files/State%20wise%20average%20daily%20nominal%20wage%20rates%20in%20rural%20india%20men%20farm%20labourers.JPG" title="https://im4change.org/upload/files/State%20wise%20average%20daily%20nominal%20wage%20rates%20in%20rural%20india%20men%20farm%20labourers.JPG">average daily nominal wage rate</a> <a href="https://im4change.org/upload/files/State%20wise%20average%20daily%20nominal%20wage%20rates%20in%20rural%20india%20men%20farm%20labourers.JPG" title="https://im4change.org/upload/files/State%20wise%20average%20daily%20nominal%20wage%20rates%20in%20rural%20india%20men%20farm%20labourers.JPG">for male agricultural labourers</a> in rural India during the period from 2014-15 to 2020-21 was observed in Madhya Pradesh <em>(Rs. 183.97)</em>, followed by Gujarat <em>(Rs. 190.07)</em>, Maharashtra <em>(Rs. 215.71)</em>, Odisha <em>(Rs. 216.87)</em>, Meghalaya <em>(Rs. 219.93)</em>, Bihar <em>(Rs. 230.43)</em>, Uttar Pradesh <em>(Rs. 230.5)</em>, and Assam <em>(Rs. 237.3)</em>. The related national level figure was Rs. 265.09 during the period from 2014-15 to 2020-21. Please consult chart-1.&nbsp;</p><p style="text-align:justify">The highest <a href="https://im4change.org/upload/files/State%20wise%20growth%20in%20average%20daily%20nominal%20wage%20rates%20in%20rural%20india%20men%20farm%20labourers.JPG" title="https://im4change.org/upload/files/State%20wise%20growth%20in%20average%20daily%20nominal%20wage%20rates%20in%20rural%20india%20men%20farm%20labourers.JPG">average annual growth rate in</a> <a href="https://im4change.org/upload/files/State%20wise%20growth%20in%20average%20daily%20nominal%20wage%20rates%20in%20rural%20india%20men%20farm%20labourers.JPG" title="https://im4change.org/upload/files/State%20wise%20growth%20in%20average%20daily%20nominal%20wage%20rates%20in%20rural%20india%20men%20farm%20labourers.JPG">nominal wage rates</a> during the period from 2015-16 to 2020-21 was found in Karnataka <em>(7.3 percent)</em>, followed by Andhra Pradesh <em>(6.8 percent)</em>, Madhya Pradesh <em>(6.4 percent)</em>, Uttar Pradesh <em>(6.2 percent)</em>, Odisha <em>(6.1 percent)</em>, and Meghalaya <em>(6.0 percent)</em>. Please see chart-2.</p><p style="text-align:justify">The lowest <a href="https://im4change.org/upload/files/State%20wise%20growth%20in%20average%20daily%20nominal%20wage%20rates%20in%20rural%20india%20men%20farm%20labourers.JPG" title="https://im4change.org/upload/files/State%20wise%20growth%20in%20average%20daily%20nominal%20wage%20rates%20in%20rural%20india%20men%20farm%20labourers.JPG">average annual growth rate</a> <a href="https://im4change.org/upload/files/State%20wise%20growth%20in%20average%20daily%20nominal%20wage%20rates%20in%20rural%20india%20men%20farm%20labourers.JPG" title="https://im4change.org/upload/files/State%20wise%20growth%20in%20average%20daily%20nominal%20wage%20rates%20in%20rural%20india%20men%20farm%20labourers.JPG">in nominal wage rates</a> during the same period was noticed in Haryana <em>(2.1 percent)</em>, followed by Rajasthan <em>(3.3 percent)</em>, Kerala <em>(3.5 percent)</em>, Punjab <em>(3.9 percent)</em>, and Tamil Nadu <em>(4.5 percent)</em>. Please consult chart-2.</p><p style="text-align:justify">The average annual <a href="https://im4change.org/upload/files/State%20wise%20growth%20in%20average%20daily%20wage%20rates%20in%20real%20terms%20for%20male%20farm%20labourers%20in%20rural%20India.JPG" title="https://im4change.org/upload/files/State%20wise%20growth%20in%20average%20daily%20wage%20rates%20in%20real%20terms%20for%20male%20farm%20labourers%20in%20rural%20India.JPG">growth of agricultural labourers&rsquo;</a> <a href="https://im4change.org/upload/files/State%20wise%20growth%20in%20average%20daily%20wage%20rates%20in%20real%20terms%20for%20male%20farm%20labourers%20in%20rural%20India.JPG" title="https://im4change.org/upload/files/State%20wise%20growth%20in%20average%20daily%20wage%20rates%20in%20real%20terms%20for%20male%20farm%20labourers%20in%20rural%20India.JPG">wage rates in real terms</a> during the period from 2015-16 to 2020-21 were negative in Haryana <em>(-2.1 percent)</em>, Jammu and Kashmir <em>(-0.3 percent)</em>, Kerala <em>(-1.7 percent)</em>, Punjab <em>(-0.4 percent)</em>, Rajasthan <em>(-1.1 percent)</em>, Tamil Nadu <em>(-0.8 percent)</em>, Tripura <em>(-0.5 percent)</em>, and West Bengal <em>(-0.1 percent)</em>. It should be noted that the <a href="https://im4change.org/upload/files/State-wise%20Average%20Inflation%20CPI%20-%20Inflation.PDF" title="https://im4change.org/upload/files/State-wise%20Average%20Inflation%20CPI%20-%20Inflation.PDF">rate of inflation</a> in <a href="https://im4change.org/upload/files/State-wise%20Average%20Inflation%20CPI%20-%20Inflation.PDF" title="https://im4change.org/upload/files/State-wise%20Average%20Inflation%20CPI%20-%20Inflation.PDF">Consumer Price Index-General</a> has been used to get the average annual growth of agricultural labourers&rsquo; wage rates in real terms. Kindly consult table-1. &nbsp;</p><p style="text-align:justify">Some states witnessed negative <a href="https://im4change.org/upload/files/State%20wise%20growth%20in%20average%20daily%20wage%20rates%20in%20real%20terms%20for%20male%20farm%20labourers%20in%20rural%20India.JPG" title="https://im4change.org/upload/files/State%20wise%20growth%20in%20average%20daily%20wage%20rates%20in%20real%20terms%20for%20male%20farm%20labourers%20in%20rural%20India.JPG">growth in agricultural labourers&rsquo;</a> <a href="https://im4change.org/upload/files/State%20wise%20growth%20in%20average%20daily%20wage%20rates%20in%20real%20terms%20for%20male%20farm%20labourers%20in%20rural%20India.JPG" title="https://im4change.org/upload/files/State%20wise%20growth%20in%20average%20daily%20wage%20rates%20in%20real%20terms%20for%20male%20farm%20labourers%20in%20rural%20India.JPG">wage rates in real terms</a> for more than two years between 2015-16 and 2020-21. For example, <a href="https://im4change.org/upload/files/State%20wise%20growth%20in%20average%20daily%20wage%20rates%20in%20real%20terms%20for%20male%20farm%20labourers%20in%20rural%20India.JPG" title="https://im4change.org/upload/files/State%20wise%20growth%20in%20average%20daily%20wage%20rates%20in%20real%20terms%20for%20male%20farm%20labourers%20in%20rural%20India.JPG">Haryana</a> experienced negative growth in 2015-16, 2016-17, 2017-18, 2019-20, and 2020-21. Likewise, <a href="https://im4change.org/upload/files/State%20wise%20growth%20in%20average%20daily%20wage%20rates%20in%20real%20terms%20for%20male%20farm%20labourers%20in%20rural%20India.JPG" title="https://im4change.org/upload/files/State%20wise%20growth%20in%20average%20daily%20wage%20rates%20in%20real%20terms%20for%20male%20farm%20labourers%20in%20rural%20India.JPG">Kerala</a> faced negative growth in 2017-18, 2018-19, 2019-20, and 2020-21. &nbsp;</p><p style="text-align:justify">At the national level, the <a href="https://im4change.org/upload/files/State%20wise%20growth%20in%20average%20daily%20wage%20rates%20in%20real%20terms%20for%20male%20farm%20labourers%20in%20rural%20India.JPG" title="https://im4change.org/upload/files/State%20wise%20growth%20in%20average%20daily%20wage%20rates%20in%20real%20terms%20for%20male%20farm%20labourers%20in%20rural%20India.JPG">agricultural labourers&rsquo;</a> <a href="https://im4change.org/upload/files/State%20wise%20growth%20in%20average%20daily%20wage%20rates%20in%20real%20terms%20for%20male%20farm%20labourers%20in%20rural%20India.JPG" title="https://im4change.org/upload/files/State%20wise%20growth%20in%20average%20daily%20wage%20rates%20in%20real%20terms%20for%20male%20farm%20labourers%20in%20rural%20India.JPG">wage rates in real terms</a> on average grew by 1.0 percent annually during the period from 2015-16 to 2020-21.</p><p style="text-align:justify">Please <a href="https://docs.google.com/spreadsheets/d/1avu0-WtaKV2RHXtz2eiP7iS8znGVBdKC/edit?usp=sharing&amp;ouid=112233925171588304692&amp;rtpof=true&amp;sd=true" title="https://docs.google.com/spreadsheets/d/1avu0-WtaKV2RHXtz2eiP7iS8znGVBdKC/edit?usp=sharing&amp;ouid=112233925171588304692&amp;rtpof=true&amp;sd=true">click here</a> to access the spreadsheet in order to look at the trends in <a href="/upload/files/State%20wise%20average%20daily%20nominal%20wage%20rates%20in%20rural%20india%20men%20farm%20labourers.JPG" title="/upload/files/State%20wise%20average%20daily%20nominal%20wage%20rates%20in%20rural%20india%20men%20farm%20labourers.JPG">nominal wage rates</a>, <a href="/upload/files/State%20wise%20growth%20in%20average%20daily%20nominal%20wage%20rates%20in%20rural%20india%20men%20farm%20labourers.JPG" title="/upload/files/State%20wise%20growth%20in%20average%20daily%20nominal%20wage%20rates%20in%20rural%20india%20men%20farm%20labourers.JPG">annual growth in nominal wage rates</a> and <a href="/upload/files/State%20wise%20growth%20in%20average%20daily%20wage%20rates%20in%20real%20terms%20for%20male%20farm%20labourers%20in%20rural%20India.JPG" title="/upload/files/State%20wise%20growth%20in%20average%20daily%20wage%20rates%20in%20real%20terms%20for%20male%20farm%20labourers%20in%20rural%20India.JPG">annual growth in real wage rates</a> for farm labourers in rural areas.&nbsp;</p><p style="text-align:justify"><strong>Non-agricultural wages in rural areas</strong></p><p style="text-align:justify">The rural economy is not just about farming any longer. That is why we have looked at the wage growth in the non-farm sector too.&nbsp;The highest <a href="https://im4change.org/upload/files/State%20wise%20average%20daily%20nominal%20wage%20rates%20in%20rural%20india%20men%20non%20farm%20labourers.JPG" title="https://im4change.org/upload/files/State%20wise%20average%20daily%20nominal%20wage%20rates%20in%20rural%20india%20men%20non%20farm%20labourers.JPG">average daily nominal wage rate for male</a> <a href="https://im4change.org/upload/files/State%20wise%20average%20daily%20nominal%20wage%20rates%20in%20rural%20india%20men%20non%20farm%20labourers.JPG" title="https://im4change.org/upload/files/State%20wise%20average%20daily%20nominal%20wage%20rates%20in%20rural%20india%20men%20non%20farm%20labourers.JPG">non-agricultural labourers</a> in rural India during the period from 2014-15 to 2020-21 was detected in Kerala <em>(Rs. 639.01)</em>, followed by Jammu and Kashmir <em>(Rs. 426.37)</em>, Tamil Nadu <em>(Rs. 405.77)</em>, Haryana <em>(Rs. 359.24)</em>, Himachal Pradesh <em>(Rs. 311.10)</em>, and Punjab <em>(Rs. 309.09)</em>. Please see chart-1.</p><p style="text-align:justify">The lowest average <a href="https://im4change.org/upload/files/State%20wise%20average%20daily%20nominal%20wage%20rates%20in%20rural%20india%20men%20non%20farm%20labourers.JPG" title="https://im4change.org/upload/files/State%20wise%20average%20daily%20nominal%20wage%20rates%20in%20rural%20india%20men%20non%20farm%20labourers.JPG">daily nominal wage rate for male</a> <a href="https://im4change.org/upload/files/State%20wise%20average%20daily%20nominal%20wage%20rates%20in%20rural%20india%20men%20non%20farm%20labourers.JPG" title="https://im4change.org/upload/files/State%20wise%20average%20daily%20nominal%20wage%20rates%20in%20rural%20india%20men%20non%20farm%20labourers.JPG">non-agricultural labourers in rural India</a> during the period from 2014-15 to 2020-21 was found in Madhya Pradesh <em>(Rs. 191.47)</em>, followed by Meghalaya <em>(Rs. 210.26)</em>, Gujarat <em>(Rs. 213.51)</em>, Odisha <em>(Rs. 218.06)</em>, Maharashtra <em>(Rs. 226.70)</em>, Tripura <em>(Rs. 230.36)</em>, Bihar <em>(Rs. 243.51)</em>, and Uttar Pradesh <em>(Rs. 243.97)</em>. The related national level figure was Rs. 273.79 during the period from 2014-15 to 2020-21. Please see chart-1.</p><p style="text-align:justify">The highest <a href="https://im4change.org/upload/files/State%20wise%20growth%20in%20average%20daily%20nominal%20wage%20rates%20in%20rural%20india%20men%20non%20farm%20labourers.JPG" title="https://im4change.org/upload/files/State%20wise%20growth%20in%20average%20daily%20nominal%20wage%20rates%20in%20rural%20india%20men%20non%20farm%20labourers.JPG">average annual growth rate in</a> <a href="https://im4change.org/upload/files/State%20wise%20growth%20in%20average%20daily%20nominal%20wage%20rates%20in%20rural%20india%20men%20non%20farm%20labourers.JPG" title="https://im4change.org/upload/files/State%20wise%20growth%20in%20average%20daily%20nominal%20wage%20rates%20in%20rural%20india%20men%20non%20farm%20labourers.JPG">nominal wage rates</a> during the period from 2015-16 to 2020-21 was noticed in Odisha <em>(8.0 percent)</em>, followed by Madhya Pradesh <em>(7.6 percent)</em>, Assam <em>(6.6 percent)</em>, West Bengal <em>(5.9 percent)</em>, Uttar Pradesh and Andhra Pradesh <em>(5.6 percent each)</em>, and Bihar <em>(5.5 percent)</em>. Kindly consult chart-2.</p><p style="text-align:justify">The lowest <a href="https://im4change.org/upload/files/State%20wise%20growth%20in%20average%20daily%20nominal%20wage%20rates%20in%20rural%20india%20men%20non%20farm%20labourers.JPG" title="https://im4change.org/upload/files/State%20wise%20growth%20in%20average%20daily%20nominal%20wage%20rates%20in%20rural%20india%20men%20non%20farm%20labourers.JPG">average annual growth rate</a> <a href="https://im4change.org/upload/files/State%20wise%20growth%20in%20average%20daily%20nominal%20wage%20rates%20in%20rural%20india%20men%20non%20farm%20labourers.JPG" title="https://im4change.org/upload/files/State%20wise%20growth%20in%20average%20daily%20nominal%20wage%20rates%20in%20rural%20india%20men%20non%20farm%20labourers.JPG">in nominal wage rates</a> during the same period was observed in Kerala <em>(1.8 percent)</em>, followed by Haryana <em>(2.4 percent)</em>, Meghalaya <em>(2.8 percent)</em>, Tamil Nadu and Rajasthan <em>(3.2 percent each)</em>, Tripura and Jammu and Kashmir <em>(4.0 percent each),</em> and Maharashtra and Punjab <em>(4.2 percent each)</em>. Kindly consult chart-2.&nbsp;</p><p style="text-align:justify">The average annual <a href="https://im4change.org/upload/files/State%20wise%20growth%20in%20average%20daily%20wage%20rates%20in%20real%20terms%20for%20male%20non%20farm%20labourers%20in%20rural%20India.JPG" title="https://im4change.org/upload/files/State%20wise%20growth%20in%20average%20daily%20wage%20rates%20in%20real%20terms%20for%20male%20non%20farm%20labourers%20in%20rural%20India.JPG">growth of non-agricultural labourers&rsquo;</a> <a href="https://im4change.org/upload/files/State%20wise%20growth%20in%20average%20daily%20wage%20rates%20in%20real%20terms%20for%20male%20non%20farm%20labourers%20in%20rural%20India.JPG" title="https://im4change.org/upload/files/State%20wise%20growth%20in%20average%20daily%20wage%20rates%20in%20real%20terms%20for%20male%20non%20farm%20labourers%20in%20rural%20India.JPG">wage rates in real terms</a> during the period from 2015-16 to 2020-21 were negative in Haryana <em>(-1.9 percent)</em>, Jammu and Kashmir <em>(-1.7 percent)</em>, Kerala <em>(-3.5 percent)</em>, Maharashtra <em>(-0.3 percent)</em>, Meghalaya <em>(-1.2 percent)</em>, Punjab <em>(-0.1 percent)</em>, Rajasthan <em>(-1.2 percent)</em>, Tamil Nadu <em>(-2.1 percent)</em>, and Tripura <em>(-1.1 percent)</em>. It should be noted that the <a href="https://im4change.org/upload/files/State-wise%20Average%20Inflation%20CPI%20-%20Inflation.PDF" title="https://im4change.org/upload/files/State-wise%20Average%20Inflation%20CPI%20-%20Inflation.PDF">rate of inflation</a> in <a href="https://im4change.org/upload/files/State-wise%20Average%20Inflation%20CPI%20-%20Inflation.PDF" title="https://im4change.org/upload/files/State-wise%20Average%20Inflation%20CPI%20-%20Inflation.PDF">CPI-General</a> has been used to get the average annual growth of non-agricultural labourers&rsquo; wage rates in real terms. Kindly have a look at table-1. &nbsp;&nbsp;</p><p style="text-align:justify">Some states experienced negative growth in <a href="https://im4change.org/upload/files/State%20wise%20growth%20in%20average%20daily%20wage%20rates%20in%20real%20terms%20for%20male%20non%20farm%20labourers%20in%20rural%20India.JPG" title="https://im4change.org/upload/files/State%20wise%20growth%20in%20average%20daily%20wage%20rates%20in%20real%20terms%20for%20male%20non%20farm%20labourers%20in%20rural%20India.JPG">non-agricultural labourers&rsquo; wage</a> <a href="https://im4change.org/upload/files/State%20wise%20growth%20in%20average%20daily%20wage%20rates%20in%20real%20terms%20for%20male%20non%20farm%20labourers%20in%20rural%20India.JPG" title="https://im4change.org/upload/files/State%20wise%20growth%20in%20average%20daily%20wage%20rates%20in%20real%20terms%20for%20male%20non%20farm%20labourers%20in%20rural%20India.JPG">rates in real terms</a> for more than two years between 2015-16 and 2020-21. For example, <a href="https://im4change.org/upload/files/State%20wise%20growth%20in%20average%20daily%20wage%20rates%20in%20real%20terms%20for%20male%20non%20farm%20labourers%20in%20rural%20India.JPG" title="https://im4change.org/upload/files/State%20wise%20growth%20in%20average%20daily%20wage%20rates%20in%20real%20terms%20for%20male%20non%20farm%20labourers%20in%20rural%20India.JPG">Haryana</a> experienced negative <a href="https://im4change.org/upload/files/State%20wise%20growth%20in%20average%20daily%20wage%20rates%20in%20real%20terms%20for%20male%20non%20farm%20labourers%20in%20rural%20India.JPG" title="https://im4change.org/upload/files/State%20wise%20growth%20in%20average%20daily%20wage%20rates%20in%20real%20terms%20for%20male%20non%20farm%20labourers%20in%20rural%20India.JPG">growth in wage rates</a> <a href="https://im4change.org/upload/files/State%20wise%20growth%20in%20average%20daily%20wage%20rates%20in%20real%20terms%20for%20male%20non%20farm%20labourers%20in%20rural%20India.JPG" title="https://im4change.org/upload/files/State%20wise%20growth%20in%20average%20daily%20wage%20rates%20in%20real%20terms%20for%20male%20non%20farm%20labourers%20in%20rural%20India.JPG">(in real terms)</a> during 2016-17, 2017-18, 2018-19, 2019-20, and 2020-21. Likewise, <a href="https://im4change.org/upload/files/State%20wise%20growth%20in%20average%20daily%20wage%20rates%20in%20real%20terms%20for%20male%20non%20farm%20labourers%20in%20rural%20India.JPG" title="https://im4change.org/upload/files/State%20wise%20growth%20in%20average%20daily%20wage%20rates%20in%20real%20terms%20for%20male%20non%20farm%20labourers%20in%20rural%20India.JPG">Kerala</a> faced negative growth rates in 2015-16, 2016-17, 2017-18, 2019-20, and 2020-21. &nbsp;</p><p style="text-align:justify">At the national level, the&nbsp;<a href="https://im4change.org/upload/files/State%20wise%20growth%20in%20average%20daily%20wage%20rates%20in%20real%20terms%20for%20male%20non%20farm%20labourers%20in%20rural%20India.JPG" title="https://im4change.org/upload/files/State%20wise%20growth%20in%20average%20daily%20wage%20rates%20in%20real%20terms%20for%20male%20non%20farm%20labourers%20in%20rural%20India.JPG">non-agricultural labourers&rsquo;</a> <a href="https://im4change.org/upload/files/State%20wise%20growth%20in%20average%20daily%20wage%20rates%20in%20real%20terms%20for%20male%20non%20farm%20labourers%20in%20rural%20India.JPG" title="https://im4change.org/upload/files/State%20wise%20growth%20in%20average%20daily%20wage%20rates%20in%20real%20terms%20for%20male%20non%20farm%20labourers%20in%20rural%20India.JPG">wage rates in real terms</a> on average grew by just 0.3 percent annually during the period from 2015-16 to 2020-21.&nbsp;</p><p style="text-align:justify">Please <a href="https://docs.google.com/spreadsheets/d/1avu0-WtaKV2RHXtz2eiP7iS8znGVBdKC/edit?usp=sharing&amp;ouid=112233925171588304692&amp;rtpof=true&amp;sd=true" title="https://docs.google.com/spreadsheets/d/1avu0-WtaKV2RHXtz2eiP7iS8znGVBdKC/edit?usp=sharing&amp;ouid=112233925171588304692&amp;rtpof=true&amp;sd=true">click here</a> to access the spreadsheet in order to look at the <a href="/upload/files/State%20wise%20average%20daily%20nominal%20wage%20rates%20in%20rural%20india%20men%20non%20farm%20labourers.JPG" title="/upload/files/State%20wise%20average%20daily%20nominal%20wage%20rates%20in%20rural%20india%20men%20non%20farm%20labourers.JPG">trends in nominal wage rates</a>, <a href="/upload/files/State%20wise%20growth%20in%20average%20daily%20nominal%20wage%20rates%20in%20rural%20india%20men%20non%20farm%20labourers.JPG" title="/upload/files/State%20wise%20growth%20in%20average%20daily%20nominal%20wage%20rates%20in%20rural%20india%20men%20non%20farm%20labourers.JPG">annual growth in nominal wage rates</a>, and <a href="/upload/files/State%20wise%20growth%20in%20average%20daily%20wage%20rates%20in%20real%20terms%20for%20male%20non%20farm%20labourers%20in%20rural%20India.JPG" title="/upload/files/State%20wise%20growth%20in%20average%20daily%20wage%20rates%20in%20real%20terms%20for%20male%20non%20farm%20labourers%20in%20rural%20India.JPG">annual growth in real wage rates</a> for non-farm labourers in rural areas.&nbsp;</p><p style="text-align:justify"><strong>Construction sector wages in rural areas</strong></p><p style="text-align:justify">The <a href="https://im4change.org/upload/files/State%20wise%20average%20daily%20nominal%20wage%20rates%20in%20rural%20india%20men%20construction%20workers.JPG" title="https://im4change.org/upload/files/State%20wise%20average%20daily%20nominal%20wage%20rates%20in%20rural%20india%20men%20construction%20workers.JPG">highest average daily nominal wage rates</a> <a href="https://im4change.org/upload/files/State%20wise%20average%20daily%20nominal%20wage%20rates%20in%20rural%20india%20men%20construction%20workers.JPG" title="https://im4change.org/upload/files/State%20wise%20average%20daily%20nominal%20wage%20rates%20in%20rural%20india%20men%20construction%20workers.JPG">for male construction workers in rural India</a> during the period from 2014-15 to 2020-21 was detected in Kerala <em>(Rs. 810.3)</em>, followed by Jammu and Kashmir <em>(Rs. 445.1)</em>, Tamil Nadu <em>(Rs. 424.1)</em>, Haryana <em>(Rs. 379.9)</em>, Himachal Pradesh <em>(Rs. 368.7)</em>, Rajasthan <em>(Rs. 347.7)</em>, and Punjab <em>(Rs. 339.1)</em>. Kindly see chart-1.&nbsp;</p><p style="text-align:justify">The <a href="https://im4change.org/upload/files/State%20wise%20average%20daily%20nominal%20wage%20rates%20in%20rural%20india%20men%20construction%20workers.JPG" title="https://im4change.org/upload/files/State%20wise%20average%20daily%20nominal%20wage%20rates%20in%20rural%20india%20men%20construction%20workers.JPG">lowest average daily nominal wage rates</a> <a href="https://im4change.org/upload/files/State%20wise%20average%20daily%20nominal%20wage%20rates%20in%20rural%20india%20men%20construction%20workers.JPG" title="https://im4change.org/upload/files/State%20wise%20average%20daily%20nominal%20wage%20rates%20in%20rural%20india%20men%20construction%20workers.JPG">for male construction workers in rural areas</a> during the period from 2014-15 to 2020-21 was found in Madhya Pradesh <em>(Rs. 212.4)</em>, followed by Tripura <em>(Rs. 230.4)</em>, Meghalaya <em>(Rs. 231.7)</em>, Odisha <em>(Rs. 247.1)</em>, Gujarat <em>(Rs. 251.8)</em>, Uttar Pradesh <em>(Rs. 267.4)</em>, Bihar <em>(Rs. 270.8)</em>, and West Bengal <em>(Rs. 274.0)</em>. The related national level figure was Rs. 316.9 during the period from 2014-15 to 2020-21. Kindly consult chart-1.</p><p style="text-align:justify">The <a href="https://im4change.org/upload/files/State%20wise%20growth%20in%20average%20daily%20nominal%20wage%20rates%20in%20rural%20india%20men%20construction%20workers.JPG" title="https://im4change.org/upload/files/State%20wise%20growth%20in%20average%20daily%20nominal%20wage%20rates%20in%20rural%20india%20men%20construction%20workers.JPG">highest average annual growth rates in</a> <a href="https://im4change.org/upload/files/State%20wise%20growth%20in%20average%20daily%20nominal%20wage%20rates%20in%20rural%20india%20men%20construction%20workers.JPG" title="https://im4change.org/upload/files/State%20wise%20growth%20in%20average%20daily%20nominal%20wage%20rates%20in%20rural%20india%20men%20construction%20workers.JPG">nominal wage rates</a> during the period from 2015-16 to 2020-21 was noticed in Meghalaya <em>(20.9 percent)</em>, followed by Madhya Pradesh <em>(7.4 percent)</em>, Odisha and Andhra Pradesh <em>(6.8 percent each)</em>, Uttar Pradesh <em>(6.4 percent)</em>, and Bihar <em>(6.2 percent)</em>. Please see chart-2.&nbsp;</p><p style="text-align:justify">The <a href="https://im4change.org/upload/files/State%20wise%20growth%20in%20average%20daily%20nominal%20wage%20rates%20in%20rural%20india%20men%20construction%20workers.JPG" title="https://im4change.org/upload/files/State%20wise%20growth%20in%20average%20daily%20nominal%20wage%20rates%20in%20rural%20india%20men%20construction%20workers.JPG">lowest average annual growth rates in</a> <a href="https://im4change.org/upload/files/State%20wise%20growth%20in%20average%20daily%20nominal%20wage%20rates%20in%20rural%20india%20men%20construction%20workers.JPG" title="https://im4change.org/upload/files/State%20wise%20growth%20in%20average%20daily%20nominal%20wage%20rates%20in%20rural%20india%20men%20construction%20workers.JPG">nominal wage rates</a> during the same period was observed in Kerala <em>(0.9 percent)</em>, followed by Manipur <em>(2.0 percent)</em>, Haryana <em>(2.1 percent)</em>, Jammu and Kashmir <em>(3.0 percent)</em>, Rajasthan <em>(3.2 percent)</em>, and Gujarat <em>(3.6 percent)</em>. Please see chart-2.</p><p style="text-align:justify">The <a href="https://im4change.org/upload/files/State%20wise%20growth%20in%20average%20daily%20wage%20rates%20in%20real%20terms%20for%20male%20construction%20workers%20in%20rural%20India%281%29.JPG" title="https://im4change.org/upload/files/State%20wise%20growth%20in%20average%20daily%20wage%20rates%20in%20real%20terms%20for%20male%20construction%20workers%20in%20rural%20India%281%29.JPG">average annual growth of construction workers&rsquo;</a> <a href="https://im4change.org/upload/files/State%20wise%20growth%20in%20average%20daily%20wage%20rates%20in%20real%20terms%20for%20male%20construction%20workers%20in%20rural%20India%281%29.JPG" title="https://im4change.org/upload/files/State%20wise%20growth%20in%20average%20daily%20wage%20rates%20in%20real%20terms%20for%20male%20construction%20workers%20in%20rural%20India%281%29.JPG">wage rates in real terms</a> during the period from 2015-16 to 2020-21 was negative in Assam <em>(-1.2 percent)</em>, Haryana <em>(-2.1 percent)</em>, Jammu and Kashmir <em>(-2.7 percent)</em>, Karnataka <em>(-0.6 percent)</em>, Kerala <em>(-4.4 percent)</em>, Manipur <em>(-6.3 percent)</em>, Rajasthan <em>(-1.2 percent)</em>, Tamil Nadu <em>(-0.9 percent)</em>, and Tripura <em>(-1.1 percent)</em>. Please note that the <a href="https://im4change.org/upload/files/State-wise%20Average%20Inflation%20CPI%20-%20Inflation.PDF" title="https://im4change.org/upload/files/State-wise%20Average%20Inflation%20CPI%20-%20Inflation.PDF">rate of inflation</a> in <a href="https://im4change.org/upload/files/State-wise%20Average%20Inflation%20CPI%20-%20Inflation.PDF" title="https://im4change.org/upload/files/State-wise%20Average%20Inflation%20CPI%20-%20Inflation.PDF">CPI-General</a> has been used to get the average annual growth of construction workers&rsquo; wage rates in real terms. Kindly have a look at table-1. &nbsp;&nbsp;</p><p style="text-align:justify">In the case of Meghalaya, the <a href="https://im4change.org/upload/files/State%20wise%20average%20daily%20nominal%20wage%20rates%20in%20rural%20india%20men%20construction%20workers.JPG" title="https://im4change.org/upload/files/State%20wise%20average%20daily%20nominal%20wage%20rates%20in%20rural%20india%20men%20construction%20workers.JPG">nominal daily wage rate of male construction</a> <a href="https://im4change.org/upload/files/State%20wise%20average%20daily%20nominal%20wage%20rates%20in%20rural%20india%20men%20construction%20workers.JPG" title="https://im4change.org/upload/files/State%20wise%20average%20daily%20nominal%20wage%20rates%20in%20rural%20india%20men%20construction%20workers.JPG">workers</a> fell from Rs. 186.0 in 2016-17 to Rs. 100.0 in 2017-18 i.e., a decline&nbsp;by -46.2 percent over previous year. However, the same bounced back to Rs. 273.2 in 2018-19 i.e., an increase by 173.2 percent over previous year. In <a href="https://im4change.org/upload/files/State%20wise%20growth%20in%20average%20daily%20wage%20rates%20in%20real%20terms%20for%20male%20construction%20workers%20in%20rural%20India%281%29.JPG" title="https://im4change.org/upload/files/State%20wise%20growth%20in%20average%20daily%20wage%20rates%20in%20real%20terms%20for%20male%20construction%20workers%20in%20rural%20India%281%29.JPG">real terms, the construction sector</a> <a href="https://im4change.org/upload/files/State%20wise%20growth%20in%20average%20daily%20wage%20rates%20in%20real%20terms%20for%20male%20construction%20workers%20in%20rural%20India%281%29.JPG" title="https://im4change.org/upload/files/State%20wise%20growth%20in%20average%20daily%20wage%20rates%20in%20real%20terms%20for%20male%20construction%20workers%20in%20rural%20India%281%29.JPG">wage rate in Meghalaya</a> grew by -47.7 percent in 2017-18 <em>(over previous year)</em> and 171.0 percent in 2018-19 <em>(over previous year)</em>.</p><p style="text-align:justify">Some states experienced negative <a href="https://im4change.org/upload/files/State%20wise%20growth%20in%20average%20daily%20wage%20rates%20in%20real%20terms%20for%20male%20construction%20workers%20in%20rural%20India%281%29.JPG" title="https://im4change.org/upload/files/State%20wise%20growth%20in%20average%20daily%20wage%20rates%20in%20real%20terms%20for%20male%20construction%20workers%20in%20rural%20India%281%29.JPG">growth in construction workers&rsquo;</a> <a href="https://im4change.org/upload/files/State%20wise%20growth%20in%20average%20daily%20wage%20rates%20in%20real%20terms%20for%20male%20construction%20workers%20in%20rural%20India%281%29.JPG" title="https://im4change.org/upload/files/State%20wise%20growth%20in%20average%20daily%20wage%20rates%20in%20real%20terms%20for%20male%20construction%20workers%20in%20rural%20India%281%29.JPG">wage rates in real terms</a> for more than two years between 2015-16 and 2020-21. For example, <a href="https://im4change.org/upload/files/State%20wise%20growth%20in%20average%20daily%20wage%20rates%20in%20real%20terms%20for%20male%20construction%20workers%20in%20rural%20India%281%29.JPG" title="https://im4change.org/upload/files/State%20wise%20growth%20in%20average%20daily%20wage%20rates%20in%20real%20terms%20for%20male%20construction%20workers%20in%20rural%20India%281%29.JPG">Assam</a> experienced negative growth in wage rates <em>(in real terms)</em> during 2017-18, 2018-19, 2019-20, and 2020-21. &nbsp;</p><p style="text-align:justify">At the national level, the&nbsp;<a href="https://im4change.org/upload/files/State%20wise%20growth%20in%20average%20daily%20wage%20rates%20in%20real%20terms%20for%20male%20construction%20workers%20in%20rural%20India%281%29.JPG" title="https://im4change.org/upload/files/State%20wise%20growth%20in%20average%20daily%20wage%20rates%20in%20real%20terms%20for%20male%20construction%20workers%20in%20rural%20India%281%29.JPG">construction workers&rsquo; wage rates in real terms</a> on average grew by just 0.1 percent annually during the period from 2015-16 to 2020-21.</p><p style="text-align:justify">Kindly <a href="https://docs.google.com/spreadsheets/d/1avu0-WtaKV2RHXtz2eiP7iS8znGVBdKC/edit?usp=sharing&amp;ouid=112233925171588304692&amp;rtpof=true&amp;sd=true" title="https://docs.google.com/spreadsheets/d/1avu0-WtaKV2RHXtz2eiP7iS8znGVBdKC/edit?usp=sharing&amp;ouid=112233925171588304692&amp;rtpof=true&amp;sd=true">click here</a> to access the spreadsheet in order to look at the <a href="/upload/files/State%20wise%20average%20daily%20nominal%20wage%20rates%20in%20rural%20india%20men%20construction%20workers.JPG" title="/upload/files/State%20wise%20average%20daily%20nominal%20wage%20rates%20in%20rural%20india%20men%20construction%20workers.JPG">trends in nominal wage rates</a>, <a href="/upload/files/State%20wise%20growth%20in%20average%20daily%20nominal%20wage%20rates%20in%20rural%20india%20men%20construction%20workers.JPG" title="/upload/files/State%20wise%20growth%20in%20average%20daily%20nominal%20wage%20rates%20in%20rural%20india%20men%20construction%20workers.JPG">annual growth in nominal wage rates</a>, and <a href="/upload/files/State%20wise%20growth%20in%20average%20daily%20wage%20rates%20in%20real%20terms%20for%20male%20construction%20workers%20in%20rural%20India%281%29.JPG" title="/upload/files/State%20wise%20growth%20in%20average%20daily%20wage%20rates%20in%20real%20terms%20for%20male%20construction%20workers%20in%20rural%20India%281%29.JPG">annual growth in real wage rates</a> for construction workers in rural areas.&nbsp;</p><p style="text-align:justify"><strong>Data collection methodology</strong></p><p style="text-align:justify">As a part of Rural Labour Enquiry, the&nbsp;<a href="https://im4change.org/upload/files/ilj_feb_2013.pdf" title="https://im4change.org/upload/files/ilj_feb_2013.pdf">daily wage rates</a> in respect of eighteen agricultural and non-agricultural occupations are being collected along with rural retail price data by the Field Operations Division of the National Sample Survey Organisation since 1986-87, according to a February 2013 <a href="https://im4change.org/upload/files/ilj_feb_2013.pdf" title="https://im4change.org/upload/files/ilj_feb_2013.pdf">edition of the Indian Labour Journal</a>.&nbsp;On the recommendations of the Governing Council of the National Sample Survey Organisation in its 61st meeting,&nbsp;the <a href="https://im4change.org/upload/files/ilj_feb_2013.pdf" title="https://im4change.org/upload/files/ilj_feb_2013.pdf">Labour Bureau</a> started the compilation and analysis of wage rate data with effect from April, 1998.&nbsp;</p><p style="text-align:justify">The Field Operations Division of the National Sample Survey Organisation has been entrusted with the work of <a href="https://im4change.org/upload/files/METHOLOGY%20FOR%20COMPILATION%20OF%20THE%20WAGE%20RATE%20DATA.pdf" title="https://im4change.org/upload/files/METHOLOGY%20FOR%20COMPILATION%20OF%20THE%20WAGE%20RATE%20DATA.pdf">data collection</a>. The <a href="https://im4change.org/upload/files/METHOLOGY%20FOR%20COMPILATION%20OF%20THE%20WAGE%20RATE%20DATA.pdf" title="https://im4change.org/upload/files/METHOLOGY%20FOR%20COMPILATION%20OF%20THE%20WAGE%20RATE%20DATA.pdf">wage rate data</a> are being collected along with rural retail prices from 600 sample villages spread over 66 NSS regions of 20 States by canvassing Block-5 <em>(Annexure-I)</em> of Schedule 3.01(R). The data collection from these sample villages is staggered over the four weeks of a month with one-fourth of them being covered every week. The days of canvassing of Schedule 3.01(R) are fixed. The village functionaries like the Panchayat Secretary, Progress Assistant, Patwari and other Village or Block Officials are the primary informants for collection of data on wage rates. The data on normal working hours and the prevailing wage rates in cash and kind for the reported working hours are collected sex-wise for each of the 18 selected occupations in 20 states, indicates an old&nbsp;<a href="https://im4change.org/upload/files/METHOLOGY%20FOR%20COMPILATION%20OF%20THE%20WAGE%20RATE%20DATA.pdf" title="https://im4change.org/upload/files/METHOLOGY%20FOR%20COMPILATION%20OF%20THE%20WAGE%20RATE%20DATA.pdf">document</a> of the Labour Bureau. &nbsp;&nbsp;</p><p style="text-align:justify">The wage rates are sometimes reported for a duration that is less/more than the normal working hours. In such cases, they are <a href="https://im4change.org/upload/files/METHOLOGY%20FOR%20COMPILATION%20OF%20THE%20WAGE%20RATE%20DATA.pdf" title="https://im4change.org/upload/files/METHOLOGY%20FOR%20COMPILATION%20OF%20THE%20WAGE%20RATE%20DATA.pdf">first normalised for eight hours</a> working day. As regards the mode of payment of wages, it is made in both ways i.e., in cash and/or in kind. The payments made in kind are very common in rural areas, which include foodgrains, cooked food, tea, fuel, cigarette, beedi, fodder, etc.&nbsp;The wages reported in kind are evaluated at local retail prices. Thereafter, the data is thoroughly scrutinised and discrepant points are referred back to the field for clarification. In the next stage, the simple arithmetic average of these normalised daily wage rates is worked out occupation-wise and sex-wise for each state.</p><p style="text-align:justify"><a href="http://ras.org.in/methodology_of_data_collection_unsuited_to_changing_rural_reality" title="http://ras.org.in/methodology_of_data_collection_unsuited_to_changing_rural_reality">Up to June 2000</a>, the average wage rates at the national level were derived by taking the simple average of state figures; since July 2000, the averages have been obtained by dividing the sum total of wages of all 20 states by the number of centres or villages from which data were collected. The state-wise averages are restricted only to those occupations where the number of centres is five or more to avoid abnormal fluctuations and inconsistency in wages paid to different categories of workers on account of varying numbers of centres. However, in order to calculate the all-India averages, all neglected centres are taken into account to arrive at the total number of centres at the national level.</p><p style="text-align:justify">The <a href="/upload/files/RBI%20note%20Average%20Daily%20Wage%20rate%20Methodology.pdf" title="/upload/files/RBI%20note%20Average%20Daily%20Wage%20rate%20Methodology.pdf">Reserve Bank of India</a>&nbsp;<em>(whose data we have used in writing this news alert)</em> has collated and is releasing monthly time series data on rural wage rates based on the data published by the Labour Bureau, Government of India. Starting from November 2013 the Labour Bureau is collecting the rural wage data in respect of 12 agricultural and 13 non-agricultural occupations across 20 major states, namely, Andhra Pradesh, Assam, Bihar, Gujarat, Haryana, Himachal Pradesh, Jammu &amp; Kashmir, Karnataka, Kerala, Madhya Pradesh, Maharashtra, Manipur, Meghalaya, Orissa, Punjab, Rajasthan, Tamil Nadu, Tripura, Uttar Pradesh and West Bengal. The occupations for which the daily wage rates are collected every month are: <u>(A) Agricultural occupations</u> &ndash; (1) &nbsp;Ploughing/ Tilling workers, (2) Sowing <em>(including planting/ Transplanting/ Weeding)</em> workers, (3) Harvesting/ Winnowing/ Threshing workers, (4) Picking workers <em>(including Tea, Cotton, Tobacco and other commercial crops)</em>, (5) Horticulture workers <em>(including nursery growers)</em>, (6) Fishermen-inland, (7) Fishermen coastal/deep-sea, (8) Loggers and wood cutters, (9) Animal husbandry workers <em>(including poultry workers, dairy workers and herdsman)</em>, (10) Packaging labourers, agriculture, (11) General agricultural labourers <em>(including watering/ irrigation workers, etc.)</em>, (12) Plant protection workers <em>(applying pesticides, treating seeds, etc.)</em>; and <u>(B) Non-agricultural occupations</u> &ndash; (13) Carpenter, (14) Blacksmith, (15) Mason, (16) Weavers, (17) Beedi makers, (18) Bamboo, cane basket weavers, (19) Handicraft workers, (20) Plumbers, (21) Electrician, (22) Construction workers <em>(for roads, dams, industrial &amp; project construction work and Well diggers)</em>, (23) LMV &amp; Tractor drivers, (24) Non-agricultural labourers <em>(including porters, loaders)</em>, and (25) Sweeping/cleaning workers.&nbsp;</p><p style="text-align:justify"><strong><em>References&nbsp;</em></strong></p><p style="text-align:justify">Handbook of Statistics on Indian States 2020-21, released in November 2021, please <a href="https://m.rbi.org.in/scripts/AnnualPublications.aspx?head=Handbook%20of%20Statistics%20on%20Indian%20States" title="https://m.rbi.org.in/scripts/AnnualPublications.aspx?head=Handbook%20of%20Statistics%20on%20Indian%20States">click here</a> to access</p><p style="text-align:justify">State-wise Average Daily Wage Rates in Rural India (Men - General Agricultural Labourers), RBI Handbook of Statistics on Indian States 2020-21, released in November 2021, please <a href="/upload/files/State-wise%20Average%20Daily%20Wage%20Rates%20in%20Rural%20India%20Men%20-%20General%20Agricultural%20Labourers.PDF" title="/upload/files/State-wise%20Average%20Daily%20Wage%20Rates%20in%20Rural%20India%20Men%20-%20General%20Agricultural%20Labourers.PDF">click here</a> to access&nbsp;</p><p style="text-align:justify">State-wise Average Daily Wage Rates in Rural India (Men - Non-Agricultural Labourers), RBI Handbook of Statistics on Indian States 2020-21, released in November 2021, please <a href="/upload/files/State-wise%20Average%20Daily%20Wage%20Rates%20in%20Rural%20India%20Men%20-%20Non%20Agricultural%20Labourers.PDF" title="/upload/files/State-wise%20Average%20Daily%20Wage%20Rates%20in%20Rural%20India%20Men%20-%20Non%20Agricultural%20Labourers.PDF">click here</a> to access&nbsp;</p><p style="text-align:justify">State-wise Average Daily Wage Rates in Rural India (Men - Construction Workers), RBI Handbook of Statistics on Indian States 2020-21, released in November 2021, please <a href="/upload/files/State-wise%20Average%20Daily%20Wage%20Rates%20in%20Rural%20India%20Men%20-%20Construction%20Workers.PDF" title="/upload/files/State-wise%20Average%20Daily%20Wage%20Rates%20in%20Rural%20India%20Men%20-%20Construction%20Workers.PDF">click here</a> to access&nbsp;</p><p style="text-align:justify">State-wise Average Inflation (CPI) - Inflation, RBI Handbook of Statistics on Indian States 2020-21, released in November 2021, please <a href="/upload/files/State-wise%20Average%20Inflation%20CPI%20-%20Inflation.PDF" title="/upload/files/State-wise%20Average%20Inflation%20CPI%20-%20Inflation.PDF">click here</a> to access&nbsp;</p><p style="text-align:justify">Indian Labour Journal, February 2013, please <a href="/upload/files/ilj_feb_2013.pdf" title="/upload/files/ilj_feb_2013.pdf">click here</a> to access &nbsp;</p><p style="text-align:justify">Wage Rates in Rural India 2003-04: Methodology for Compilation of the Wage Rate Data, Labour Bureau, please <a href="/upload/files/METHOLOGY%20FOR%20COMPILATION%20OF%20THE%20WAGE%20RATE%20DATA.pdf" title="/upload/files/METHOLOGY%20FOR%20COMPILATION%20OF%20THE%20WAGE%20RATE%20DATA.pdf">click here</a> to access&nbsp; &nbsp;&nbsp;</p><p style="text-align:justify">Average Daily Wage Rates in Rural India: Methodology and coverage (From November 2013), Reserve Bank of India, please <a href="https://dbie.rbi.org.in" title="https://dbie.rbi.org.in">click here</a>&nbsp;and <a href="/upload/files/RBI%20note%20Average%20Daily%20Wage%20rate%20Methodology%281%29.pdf" title="/upload/files/RBI%20note%20Average%20Daily%20Wage%20rate%20Methodology%281%29.pdf">here</a> to access&nbsp;</p><p style="text-align:justify">Consumer Price Index Numbers on Base 2012=100 for Rural, Urban and Combined for the month of January 2022, Ministry of Statistics and Programme Implementation (MoSPI), National Statistical Office (NSO), released on 14th February 2022, please <a href="/upload/files/CPI%20Press%20Release%20January%202022%281%29.pdf" title="/upload/files/CPI%20Press%20Release%20January%202022%281%29.pdf">click here</a> to access&nbsp;</p><p style="text-align:justify">Methodology of Data Collection Unsuited to Changing Rural Reality: A Study of Agricultural Wage Data in India -Yoshifumi Usami, Arindam Das, and Madhura Swaminathan, Review of Agrarian Studies, Vol. 10, No. 2, July-December, 2020, please <a href="http://ras.org.in/methodology_of_data_collection_unsuited_to_changing_rural_reality" title="http://ras.org.in/methodology_of_data_collection_unsuited_to_changing_rural_reality">click here</a> to access</p><p>Russia-ukraine crisis to push up fertiliser prices, govt subsidies, IANS/ Business Standard, 4 March, 2022, please <a href="https://www.business-standard.com/article/economy-policy/russia-ukraine-crisis-to-push-up-fertiliser-prices-govt-subsidies-122030400560_1.html" title="https://www.business-standard.com/article/economy-policy/russia-ukraine-crisis-to-push-up-fertiliser-prices-govt-subsidies-122030400560_1.html">click here</a> to access &nbsp;</p><p>Cooking oil prices spike in India due to Russia-ukraine crisis -B Krishna Mohan, TelanganaToday.com, 3 March, 2022, please <a href="https://telanganatoday.com/cooking-oil-prices-spike-in-india-due-to-russia-ukraine-crisis" title="https://telanganatoday.com/cooking-oil-prices-spike-in-india-due-to-russia-ukraine-crisis">click here</a> to access &nbsp;</p><p>Govt reviews cooking oil imports as ukraine crisis disrupts supplies, prices shoot up -Amiti Sen and Prabhudutta Mishra, The Hindu Business Line, 4 March, 2022, please <a href="https://www.thehindubusinessline.com/markets/commodities/govt-reviews-cooking-oil-imports-as-ukraine-crisis-disrupts-supplies-prices-shoot-up/article65190879.ece" title="https://www.thehindubusinessline.com/markets/commodities/govt-reviews-cooking-oil-imports-as-ukraine-crisis-disrupts-supplies-prices-shoot-up/article65190879.ece">click here</a> to access &nbsp;</p><p>India&#39;s Economy Faces A Potential Stagflation Risk From Ukraine War -Sunil Prabhu, NDTV.com, 1 March, 2022, please <a href="https://www.ndtv.com/business/indias-economy-faces-a-potential-stagflation-risk-from-ukraine-war-2796624" title="https://www.ndtv.com/business/indias-economy-faces-a-potential-stagflation-risk-from-ukraine-war-2796624">click here</a> to access</p><p>India to be one of Asia&rsquo;s &lsquo;biggest losers&rsquo; from the Ukraine war as Russia slammed by global sanctions -Paran Balakrishnan, The Telegraph, 1 March, 2022, please <a href="https://www.telegraphindia.com/business/russia-ukraine-crisis-india-to-be-one-of-asias-biggest-losers-from-the-ukraine-war-as-russia-slammed-by-global-sanctions/cid/1854032" title="https://www.telegraphindia.com/business/russia-ukraine-crisis-india-to-be-one-of-asias-biggest-losers-from-the-ukraine-war-as-russia-slammed-by-global-sanctions/cid/1854032">click here</a> to access</p><p>Crude Oil Prices Rise, Tracking Russia-Ukraine Conflict -Rahul Karunakar, NDTV.com <em>(with inputs from Agencies)</em>, 1 March, 2022, please <a href="https://www.ndtv.com/business/crude-oil-prices-rise-on-tuesday-tracking-russia-ukraine-conflict-2796187" title="https://www.ndtv.com/business/crude-oil-prices-rise-on-tuesday-tracking-russia-ukraine-conflict-2796187">click here</a> to access</p><p>Cooking Oil May Become Costlier Due to Russia-ukraine War. Know Why, News18.com, 27 February, 2022, please <a href="https://www.news18.com/news/business/markets/cooking-oil-may-become-costlier-due-to-russia-ukraine-war-know-why-4812740.html" title="https://www.news18.com/news/business/markets/cooking-oil-may-become-costlier-due-to-russia-ukraine-war-know-why-4812740.html">click here</a> to access &nbsp;</p><p style="text-align:justify"><strong>Image Courtesy: Inclusive Media for Change/ Shambhu Ghatak</strong></p>'
$lang = 'English'
$SITE_URL = 'https://im4change.in/'
$site_title = 'im4change'
$adminprix = 'admin'</pre><pre class="stack-trace">include - APP/Template/Layout/printlayout.ctp, line 8
Cake\View\View::_evaluate() - CORE/src/View/View.php, line 1413
Cake\View\View::_render() - CORE/src/View/View.php, line 1374
Cake\View\View::renderLayout() - CORE/src/View/View.php, line 927
Cake\View\View::render() - CORE/src/View/View.php, line 885
Cake\Controller\Controller::render() - CORE/src/Controller/Controller.php, line 791
Cake\Http\ActionDispatcher::_invoke() - CORE/src/Http/ActionDispatcher.php, line 126
Cake\Http\ActionDispatcher::dispatch() - CORE/src/Http/ActionDispatcher.php, line 94
Cake\Http\BaseApplication::__invoke() - CORE/src/Http/BaseApplication.php, line 235
Cake\Http\Runner::__invoke() - CORE/src/Http/Runner.php, line 65
Cake\Routing\Middleware\RoutingMiddleware::__invoke() - CORE/src/Routing/Middleware/RoutingMiddleware.php, line 162
Cake\Http\Runner::__invoke() - CORE/src/Http/Runner.php, line 65
Cake\Routing\Middleware\AssetMiddleware::__invoke() - CORE/src/Routing/Middleware/AssetMiddleware.php, line 88
Cake\Http\Runner::__invoke() - CORE/src/Http/Runner.php, line 65
Cake\Error\Middleware\ErrorHandlerMiddleware::__invoke() - CORE/src/Error/Middleware/ErrorHandlerMiddleware.php, line 96
Cake\Http\Runner::__invoke() - CORE/src/Http/Runner.php, line 65
Cake\Http\Runner::run() - CORE/src/Http/Runner.php, line 51</pre></div></pre>news-alerts-57/real-wage-rates-of-the-rural-workers-hardly-increased-during-the-past-6-years.html"/>
<meta http-equiv="Content-Type" content="text/html; charset=utf-8"/>
<link href="https://im4change.in/css/control.css" rel="stylesheet" type="text/css"
media="all"/>
<title>NEWS ALERTS | Real wage rates of the rural workers hardly increased during the last 6 years | Im4change.org</title>
<meta name="description" content="In the absence of income or expenditure-based headcount ratio, the growth in the real wages (i.e., nominal wages adjusted against retail inflation) of the manual workers is considered to be a good proxy to assess the trends in poverty. This..."/>
<script src="https://im4change.in/js/jquery-1.10.2.js"></script>
<script type="text/javascript" src="https://im4change.in/js/jquery-migrate.min.js"></script>
<script language="javascript" type="text/javascript">
$(document).ready(function () {
var img = $("img")[0]; // Get my img elem
var pic_real_width, pic_real_height;
$("<img/>") // Make in memory copy of image to avoid css issues
.attr("src", $(img).attr("src"))
.load(function () {
pic_real_width = this.width; // Note: $(this).width() will not
pic_real_height = this.height; // work for in memory images.
});
});
</script>
<style type="text/css">
@media screen {
div.divFooter {
display: block;
}
}
@media print {
.printbutton {
display: none !important;
}
}
</style>
</head>
<body>
<table cellpadding="0" cellspacing="0" border="0" width="98%" align="center">
<tr>
<td class="top_bg">
<div class="divFooter">
<img src="https://im4change.in/images/logo1.jpg" height="59" border="0"
alt="Resource centre on India's rural distress" style="padding-top:14px;"/>
</div>
</td>
</tr>
<tr>
<td id="topspace"> </td>
</tr>
<tr id="topspace">
<td> </td>
</tr>
<tr>
<td height="50" style="border-bottom:1px solid #000; padding-top:10px;" class="printbutton">
<form><input type="button" value=" Print this page "
onclick="window.print();return false;"/></form>
</td>
</tr>
<tr>
<td width="100%">
<h1 class="news_headlines" style="font-style:normal">
<strong>Real wage rates of the rural workers hardly increased during the last 6 years</strong></h1>
</td>
</tr>
<tr>
<td width="100%" style="font-family:Arial, 'Segoe Script', 'Segoe UI', sans-serif, serif"><font size="3">
<p style="text-align:justify">In the absence of income or expenditure-based headcount ratio, the growth in the real wages <em>(i.e., nominal wages adjusted against retail inflation)</em> of the manual workers is considered to be a good proxy to assess the trends in poverty. This is because the manual, unskilled/ semi-skilled labourers exist at the bottom of the pyramid or economic hierarchy, and most of them belong to the social categories Scheduled Castes (SCs) and Scheduled Tribes (STs). A positive growth in their real wages <em>(or real wage rates) </em>is anticipated to improve their purchasing power <em>(i.e., income or consumption expenditure)</em> and lift them out of the poverty trap. </p><p style="text-align:justify">Clearly, there exists inter-state differences in nominal wage rates, growth in nominal wage rates and growth in real wage rates, which we will see in this news alert. </p><p style="text-align:justify">Against the backdrop of the <a href="https://www.thehindubusinessline.com/markets/commodities/govt-reviews-cooking-oil-imports-as-ukraine-crisis-disrupts-supplies-prices-shoot-up/article65190879.ece" title="https://www.thehindubusinessline.com/markets/commodities/govt-reviews-cooking-oil-imports-as-ukraine-crisis-disrupts-supplies-prices-shoot-up/article65190879.ece">Russia-Ukraine conflict</a>, which is anticipated to cause both <a href="https://www.ndtv.com/business/indias-economy-faces-a-potential-stagflation-risk-from-ukraine-war-2796624" title="https://www.ndtv.com/business/indias-economy-faces-a-potential-stagflation-risk-from-ukraine-war-2796624">food and fuel retail inflation</a> in India in the coming times, it is even more important to look at the past trends in wage rate growth of the rural workers. It should be noted that the <a href="https://public.flourish.studio/visualisation/8706137" title="https://public.flourish.studio/visualisation/8706137">year-on-year inflation</a> in <a href="https://public.flourish.studio/visualisation/8706137" title="https://public.flourish.studio/visualisation/8706137">Consumer</a> <a href="https://public.flourish.studio/visualisation/8706137" title="https://public.flourish.studio/visualisation/8706137">Price Index Rural</a> exceeded the <a href="https://public.flourish.studio/visualisation/8706137" title="https://public.flourish.studio/visualisation/8706137">year-on-year inflation</a> in <a href="https://public.flourish.studio/visualisation/8706137" title="https://public.flourish.studio/visualisation/8706137">CPI Urban</a> during January 2022 at the national level. Even before the beginning of Russia-Ukraine conflict <em>(i.e., during January 2022)</em>, in rural areas, <a href="https://im4change.org/upload/files/CPI%20Press%20Release%20January%202022%281%29.pdf" title="https://im4change.org/upload/files/CPI%20Press%20Release%20January%202022%281%29.pdf">retail inflation rate of 20.6 percent</a> was noticed for 'oils and fats', aside from <a href="https://im4change.org/upload/files/CPI%20Press%20Release%20January%202022%281%29.pdf" title="https://im4change.org/upload/files/CPI%20Press%20Release%20January%202022%281%29.pdf">8.44 percent retail inflation for 'fuel and light'</a>, <a href="https://im4change.org/upload/files/CPI%20Press%20Release%20January%202022%281%29.pdf" title="https://im4change.org/upload/files/CPI%20Press%20Release%20January%202022%281%29.pdf">8.27 percent</a> for 'transport and communication', and <a href="https://im4change.org/upload/files/CPI%20Press%20Release%20January%202022%281%29.pdf" title="https://im4change.org/upload/files/CPI%20Press%20Release%20January%202022%281%29.pdf">9.65 percent for 'clothing and footwear'</a>. </p><p style="text-align:justify">At the national level, the average daily nominal wage rate for male construction workers in rural areas during the period from 2014-15 to 2020-21 was Rs. 316.9, which was greater than that of the male non-farm workers in rural areas. The average daily nominal wage rate for male non-agricultural labourers in rural areas during the period from 2014-15 to 2020-21 was Rs. 273.8, which exceeded the average daily nominal wage rates for male farm labourers in rural areas <em>(i.e., Rs. 265.1)</em>. However, in Andhra Pradesh, Haryana, Himachal Pradesh, Jammu and Kashmir, Karnataka, Kerala, Meghalaya, Punjab, and Tripura, the average daily nominal wage rates for male agricultural labourers in rural areas during the period from 2014-15 to 2020-21 exceeded the average daily nominal wage rates for male non-farm labourers in rural areas. Please see chart-1.</p><p style="text-align:justify"><img alt="" src="/upload/images/Chart%201.png" style="height:670px; width:1000px" /></p><p style="text-align:justify"><em><strong>Notes:</strong> The average (i.e., arithmetic mean) daily nominal wage rates for various categories of workers in rural India in the period from 2014-15 to 2020-21 has been calculated by the Inclusive Media for Change staff</em></p><p style="text-align:justify"><em>Please <a href="https://docs.google.com/spreadsheets/d/1avu0-WtaKV2RHXtz2eiP7iS8znGVBdKC/edit?usp=sharing&ouid=112233925171588304692&rtpof=true&sd=true" title="https://docs.google.com/spreadsheets/d/1avu0-WtaKV2RHXtz2eiP7iS8znGVBdKC/edit?usp=sharing&ouid=112233925171588304692&rtpof=true&sd=true">click here</a> to access the data in spreadsheet format</em></p><p style="text-align:justify"><em><strong>Source: </strong>Handbook of Statistics on Indian States 2020-21, released in November 2021, please <a href="https://m.rbi.org.in/scripts/AnnualPublications.aspx?head=Handbook%20of%20Statistics%20on%20Indian%20States" title="https://m.rbi.org.in/scripts/AnnualPublications.aspx?head=Handbook%20of%20Statistics%20on%20Indian%20States">click here</a> to access</em></p><p style="text-align:justify"><em>State-wise Average Daily Wage Rates in Rural India (Men - General Agricultural Labourers), RBI Handbook of Statistics on Indian States 2020-21, released in November 2021, please <a href="/upload/files/State-wise%20Average%20Daily%20Wage%20Rates%20in%20Rural%20India%20Men%20-%20General%20Agricultural%20Labourers.PDF" title="/upload/files/State-wise%20Average%20Daily%20Wage%20Rates%20in%20Rural%20India%20Men%20-%20General%20Agricultural%20Labourers.PDF">click here</a> to access </em></p><p style="text-align:justify"><em>State-wise Average Daily Wage Rates in Rural India (Men - Non-Agricultural Labourers), RBI Handbook of Statistics on Indian States 2020-21, released in November 2021, please <a href="/upload/files/State-wise%20Average%20Daily%20Wage%20Rates%20in%20Rural%20India%20Men%20-%20Non%20Agricultural%20Labourers.PDF" title="/upload/files/State-wise%20Average%20Daily%20Wage%20Rates%20in%20Rural%20India%20Men%20-%20Non%20Agricultural%20Labourers.PDF">click here</a> to access </em></p><p style="text-align:justify"><em>State-wise Average Daily Wage Rates in Rural India (Men - Construction Workers), RBI Handbook of Statistics on Indian States 2020-21, released in November 2021, please <a href="/upload/files/State-wise%20Average%20Daily%20Wage%20Rates%20in%20Rural%20India%20Men%20-%20Construction%20Workers.PDF" title="/upload/files/State-wise%20Average%20Daily%20Wage%20Rates%20in%20Rural%20India%20Men%20-%20Construction%20Workers.PDF">click here</a> to access </em></p><p style="text-align:justify"><em>State-wise Average Inflation (CPI) - Inflation, RBI Handbook of Statistics on Indian States 2020-21, released in November 2021, please <a href="/upload/files/State-wise%20Average%20Inflation%20CPI%20-%20Inflation.PDF" title="/upload/files/State-wise%20Average%20Inflation%20CPI%20-%20Inflation.PDF">click here</a> to access </em></p><p style="text-align:justify"><strong>---</strong></p><p style="text-align:justify">At the national level, the agricultural nominal wage rate grew faster than the non-farm wage rate on average for male labourers in rural areas during the period from 2015-16 to 2020-21. However, in states like Assam, Bihar, Haryana, Madhya Pradesh, Odisha, Punjab, and West Bengal, the non-farm nominal wage rates grew faster than the farm wage rates on average for male workers in rural areas during the period from 2015-16 to 2020-21. Please see chart-2. </p><p style="text-align:justify"><img alt="" src="/upload/images/Chart%202.png" style="height:653px; width:1000px" /></p><p style="text-align:justify"><em><strong>Notes: </strong>The average growth in daily nominal wage rates for various categories of workers in rural India in the period from 2015-16 to 2020-21 has been calculated by the Inclusive Media for Change staff</em></p><p style="text-align:justify"><em>Please <a href="https://docs.google.com/spreadsheets/d/1avu0-WtaKV2RHXtz2eiP7iS8znGVBdKC/edit?usp=sharing&ouid=112233925171588304692&rtpof=true&sd=true" title="https://docs.google.com/spreadsheets/d/1avu0-WtaKV2RHXtz2eiP7iS8znGVBdKC/edit?usp=sharing&ouid=112233925171588304692&rtpof=true&sd=true">click here</a> to access the data in spreadsheet format</em></p><p style="text-align:justify"><em><strong>Source: </strong>Same as above</em><br /><strong>---</strong></p><p style="text-align:justify">At the national level, the construction sector nominal wage rate grew slower than the non-agricultural wage rate on average for male labourers in rural areas during the period from 2015-16 to 2020-21. However, in states like Andhra Pradesh, Bihar, Himachal Pradesh, Maharashtra, Meghalaya, Punjab, Tamil Nadu, and Uttar Pradesh, the construction sector nominal wage rates grew faster than the non-farm wage rates on average for male workers in rural areas during the period from 2015-16 to 2020-21. Please take a look at chart-2. </p><p style="text-align:justify">At the national level, the agricultural wage rate in real terms grew faster than the non-farm wage rate on average for male labourers in rural areas during the period from 2015-16 to 2020-21. However, in states like Assam, Bihar, Haryana, Madhya Pradesh, Odisha, Punjab, and West Bengal, the non-farm wage rates in real terms grew faster than the farm wage rates on average for male workers in rural areas during the period from 2015-16 to 2020-21. Please see table-1.</p><p style="text-align:justify"><strong>Table 1: State-wise Growth in Average Daily Wage Rates in Real terms for Male Agricultural Labourers, Male Non-Agricultural Labourers, and Male Construction Workers in Rural India, in %</strong><br /><img alt="" src="/upload/images/Table%201%20State-wise%20Growth%20in%20Average%20Daily%20Wage%20Rates%20in%20Real%20terms%20for%20Male%20Agricultural%20Labourers%20Male%20Non-Agricultural%20Labourers%20and%20Male%20Construction%20Workers%20in%20Rural%20India%20in%20percent.png" style="height:539px; width:750px" /></p><p style="text-align:justify"><em><strong>Notes: </strong>The average growth in daily wage rates in real terms for various categories of workers in rural India in the period from 2015-16 to 2020-21 has been calculated by the Inclusive Media for Change staff</em></p><p style="text-align:justify"><em>Please <a href="https://docs.google.com/spreadsheets/d/1avu0-WtaKV2RHXtz2eiP7iS8znGVBdKC/edit?usp=sharing&ouid=112233925171588304692&rtpof=true&sd=true" title="https://docs.google.com/spreadsheets/d/1avu0-WtaKV2RHXtz2eiP7iS8znGVBdKC/edit?usp=sharing&ouid=112233925171588304692&rtpof=true&sd=true">click here</a> to access the data in spreadsheet format</em></p><p style="text-align:justify"><em><strong>Source: </strong>Same as above</em><br /><strong>---</strong></p><p style="text-align:justify">At the national level, the construction sector wage rate in real terms grew slower than the non-agricultural wage rate on average for male labourers in rural areas during the period from 2015-16 to 2020-21. However, in states like Andhra Pradesh, Bihar, Himachal Pradesh, Maharashtra, Meghalaya, Punjab, Tamil Nadu, and Uttar Pradesh, the construction sector wage rates in real terms grew faster than the non-farm wage rates on average for male workers in rural areas during the period from 2015-16 to 2020-21. Please take a look at table-1. </p><p style="text-align:justify">In the following paragraphs, we have discussed the trends in agricultural wage rates, non-farm wage rates, and construction sector wage rates <em>(in rural areas)</em> in detail. </p><p style="text-align:justify"><strong>Agricultural wages in rural areas</strong></p><p style="text-align:justify">The highest <a href="https://im4change.org/upload/files/State%20wise%20average%20daily%20nominal%20wage%20rates%20in%20rural%20india%20men%20farm%20labourers.JPG" title="https://im4change.org/upload/files/State%20wise%20average%20daily%20nominal%20wage%20rates%20in%20rural%20india%20men%20farm%20labourers.JPG">average daily nominal wage rate</a> <a href="https://im4change.org/upload/files/State%20wise%20average%20daily%20nominal%20wage%20rates%20in%20rural%20india%20men%20farm%20labourers.JPG" title="https://im4change.org/upload/files/State%20wise%20average%20daily%20nominal%20wage%20rates%20in%20rural%20india%20men%20farm%20labourers.JPG">for male agricultural labourers</a> in rural India during the period from 2014-15 to 2020-21 was found in Kerala <em>(Rs. 653.93)</em>, followed by Jammu and Kashmir <em>(Rs. 429.19)</em>, Tamil Nadu <em>(Rs. 385.6)</em>, Haryana <em>(Rs. 368.53)</em>, Himachal Pradesh <em>(Rs. 366.23)</em>, and Punjab <em>(Rs. 325.31)</em>. Please have a look at chart-1.</p><p style="text-align:justify">The lowest <a href="https://im4change.org/upload/files/State%20wise%20average%20daily%20nominal%20wage%20rates%20in%20rural%20india%20men%20farm%20labourers.JPG" title="https://im4change.org/upload/files/State%20wise%20average%20daily%20nominal%20wage%20rates%20in%20rural%20india%20men%20farm%20labourers.JPG">average daily nominal wage rate</a> <a href="https://im4change.org/upload/files/State%20wise%20average%20daily%20nominal%20wage%20rates%20in%20rural%20india%20men%20farm%20labourers.JPG" title="https://im4change.org/upload/files/State%20wise%20average%20daily%20nominal%20wage%20rates%20in%20rural%20india%20men%20farm%20labourers.JPG">for male agricultural labourers</a> in rural India during the period from 2014-15 to 2020-21 was observed in Madhya Pradesh <em>(Rs. 183.97)</em>, followed by Gujarat <em>(Rs. 190.07)</em>, Maharashtra <em>(Rs. 215.71)</em>, Odisha <em>(Rs. 216.87)</em>, Meghalaya <em>(Rs. 219.93)</em>, Bihar <em>(Rs. 230.43)</em>, Uttar Pradesh <em>(Rs. 230.5)</em>, and Assam <em>(Rs. 237.3)</em>. The related national level figure was Rs. 265.09 during the period from 2014-15 to 2020-21. Please consult chart-1. </p><p style="text-align:justify">The highest <a href="https://im4change.org/upload/files/State%20wise%20growth%20in%20average%20daily%20nominal%20wage%20rates%20in%20rural%20india%20men%20farm%20labourers.JPG" title="https://im4change.org/upload/files/State%20wise%20growth%20in%20average%20daily%20nominal%20wage%20rates%20in%20rural%20india%20men%20farm%20labourers.JPG">average annual growth rate in</a> <a href="https://im4change.org/upload/files/State%20wise%20growth%20in%20average%20daily%20nominal%20wage%20rates%20in%20rural%20india%20men%20farm%20labourers.JPG" title="https://im4change.org/upload/files/State%20wise%20growth%20in%20average%20daily%20nominal%20wage%20rates%20in%20rural%20india%20men%20farm%20labourers.JPG">nominal wage rates</a> during the period from 2015-16 to 2020-21 was found in Karnataka <em>(7.3 percent)</em>, followed by Andhra Pradesh <em>(6.8 percent)</em>, Madhya Pradesh <em>(6.4 percent)</em>, Uttar Pradesh <em>(6.2 percent)</em>, Odisha <em>(6.1 percent)</em>, and Meghalaya <em>(6.0 percent)</em>. Please see chart-2.</p><p style="text-align:justify">The lowest <a href="https://im4change.org/upload/files/State%20wise%20growth%20in%20average%20daily%20nominal%20wage%20rates%20in%20rural%20india%20men%20farm%20labourers.JPG" title="https://im4change.org/upload/files/State%20wise%20growth%20in%20average%20daily%20nominal%20wage%20rates%20in%20rural%20india%20men%20farm%20labourers.JPG">average annual growth rate</a> <a href="https://im4change.org/upload/files/State%20wise%20growth%20in%20average%20daily%20nominal%20wage%20rates%20in%20rural%20india%20men%20farm%20labourers.JPG" title="https://im4change.org/upload/files/State%20wise%20growth%20in%20average%20daily%20nominal%20wage%20rates%20in%20rural%20india%20men%20farm%20labourers.JPG">in nominal wage rates</a> during the same period was noticed in Haryana <em>(2.1 percent)</em>, followed by Rajasthan <em>(3.3 percent)</em>, Kerala <em>(3.5 percent)</em>, Punjab <em>(3.9 percent)</em>, and Tamil Nadu <em>(4.5 percent)</em>. Please consult chart-2.</p><p style="text-align:justify">The average annual <a href="https://im4change.org/upload/files/State%20wise%20growth%20in%20average%20daily%20wage%20rates%20in%20real%20terms%20for%20male%20farm%20labourers%20in%20rural%20India.JPG" title="https://im4change.org/upload/files/State%20wise%20growth%20in%20average%20daily%20wage%20rates%20in%20real%20terms%20for%20male%20farm%20labourers%20in%20rural%20India.JPG">growth of agricultural labourers’</a> <a href="https://im4change.org/upload/files/State%20wise%20growth%20in%20average%20daily%20wage%20rates%20in%20real%20terms%20for%20male%20farm%20labourers%20in%20rural%20India.JPG" title="https://im4change.org/upload/files/State%20wise%20growth%20in%20average%20daily%20wage%20rates%20in%20real%20terms%20for%20male%20farm%20labourers%20in%20rural%20India.JPG">wage rates in real terms</a> during the period from 2015-16 to 2020-21 were negative in Haryana <em>(-2.1 percent)</em>, Jammu and Kashmir <em>(-0.3 percent)</em>, Kerala <em>(-1.7 percent)</em>, Punjab <em>(-0.4 percent)</em>, Rajasthan <em>(-1.1 percent)</em>, Tamil Nadu <em>(-0.8 percent)</em>, Tripura <em>(-0.5 percent)</em>, and West Bengal <em>(-0.1 percent)</em>. It should be noted that the <a href="https://im4change.org/upload/files/State-wise%20Average%20Inflation%20CPI%20-%20Inflation.PDF" title="https://im4change.org/upload/files/State-wise%20Average%20Inflation%20CPI%20-%20Inflation.PDF">rate of inflation</a> in <a href="https://im4change.org/upload/files/State-wise%20Average%20Inflation%20CPI%20-%20Inflation.PDF" title="https://im4change.org/upload/files/State-wise%20Average%20Inflation%20CPI%20-%20Inflation.PDF">Consumer Price Index-General</a> has been used to get the average annual growth of agricultural labourers’ wage rates in real terms. Kindly consult table-1. </p><p style="text-align:justify">Some states witnessed negative <a href="https://im4change.org/upload/files/State%20wise%20growth%20in%20average%20daily%20wage%20rates%20in%20real%20terms%20for%20male%20farm%20labourers%20in%20rural%20India.JPG" title="https://im4change.org/upload/files/State%20wise%20growth%20in%20average%20daily%20wage%20rates%20in%20real%20terms%20for%20male%20farm%20labourers%20in%20rural%20India.JPG">growth in agricultural labourers’</a> <a href="https://im4change.org/upload/files/State%20wise%20growth%20in%20average%20daily%20wage%20rates%20in%20real%20terms%20for%20male%20farm%20labourers%20in%20rural%20India.JPG" title="https://im4change.org/upload/files/State%20wise%20growth%20in%20average%20daily%20wage%20rates%20in%20real%20terms%20for%20male%20farm%20labourers%20in%20rural%20India.JPG">wage rates in real terms</a> for more than two years between 2015-16 and 2020-21. For example, <a href="https://im4change.org/upload/files/State%20wise%20growth%20in%20average%20daily%20wage%20rates%20in%20real%20terms%20for%20male%20farm%20labourers%20in%20rural%20India.JPG" title="https://im4change.org/upload/files/State%20wise%20growth%20in%20average%20daily%20wage%20rates%20in%20real%20terms%20for%20male%20farm%20labourers%20in%20rural%20India.JPG">Haryana</a> experienced negative growth in 2015-16, 2016-17, 2017-18, 2019-20, and 2020-21. Likewise, <a href="https://im4change.org/upload/files/State%20wise%20growth%20in%20average%20daily%20wage%20rates%20in%20real%20terms%20for%20male%20farm%20labourers%20in%20rural%20India.JPG" title="https://im4change.org/upload/files/State%20wise%20growth%20in%20average%20daily%20wage%20rates%20in%20real%20terms%20for%20male%20farm%20labourers%20in%20rural%20India.JPG">Kerala</a> faced negative growth in 2017-18, 2018-19, 2019-20, and 2020-21. </p><p style="text-align:justify">At the national level, the <a href="https://im4change.org/upload/files/State%20wise%20growth%20in%20average%20daily%20wage%20rates%20in%20real%20terms%20for%20male%20farm%20labourers%20in%20rural%20India.JPG" title="https://im4change.org/upload/files/State%20wise%20growth%20in%20average%20daily%20wage%20rates%20in%20real%20terms%20for%20male%20farm%20labourers%20in%20rural%20India.JPG">agricultural labourers’</a> <a href="https://im4change.org/upload/files/State%20wise%20growth%20in%20average%20daily%20wage%20rates%20in%20real%20terms%20for%20male%20farm%20labourers%20in%20rural%20India.JPG" title="https://im4change.org/upload/files/State%20wise%20growth%20in%20average%20daily%20wage%20rates%20in%20real%20terms%20for%20male%20farm%20labourers%20in%20rural%20India.JPG">wage rates in real terms</a> on average grew by 1.0 percent annually during the period from 2015-16 to 2020-21.</p><p style="text-align:justify">Please <a href="https://docs.google.com/spreadsheets/d/1avu0-WtaKV2RHXtz2eiP7iS8znGVBdKC/edit?usp=sharing&ouid=112233925171588304692&rtpof=true&sd=true" title="https://docs.google.com/spreadsheets/d/1avu0-WtaKV2RHXtz2eiP7iS8znGVBdKC/edit?usp=sharing&ouid=112233925171588304692&rtpof=true&sd=true">click here</a> to access the spreadsheet in order to look at the trends in <a href="/upload/files/State%20wise%20average%20daily%20nominal%20wage%20rates%20in%20rural%20india%20men%20farm%20labourers.JPG" title="/upload/files/State%20wise%20average%20daily%20nominal%20wage%20rates%20in%20rural%20india%20men%20farm%20labourers.JPG">nominal wage rates</a>, <a href="/upload/files/State%20wise%20growth%20in%20average%20daily%20nominal%20wage%20rates%20in%20rural%20india%20men%20farm%20labourers.JPG" title="/upload/files/State%20wise%20growth%20in%20average%20daily%20nominal%20wage%20rates%20in%20rural%20india%20men%20farm%20labourers.JPG">annual growth in nominal wage rates</a> and <a href="/upload/files/State%20wise%20growth%20in%20average%20daily%20wage%20rates%20in%20real%20terms%20for%20male%20farm%20labourers%20in%20rural%20India.JPG" title="/upload/files/State%20wise%20growth%20in%20average%20daily%20wage%20rates%20in%20real%20terms%20for%20male%20farm%20labourers%20in%20rural%20India.JPG">annual growth in real wage rates</a> for farm labourers in rural areas. </p><p style="text-align:justify"><strong>Non-agricultural wages in rural areas</strong></p><p style="text-align:justify">The rural economy is not just about farming any longer. That is why we have looked at the wage growth in the non-farm sector too. The highest <a href="https://im4change.org/upload/files/State%20wise%20average%20daily%20nominal%20wage%20rates%20in%20rural%20india%20men%20non%20farm%20labourers.JPG" title="https://im4change.org/upload/files/State%20wise%20average%20daily%20nominal%20wage%20rates%20in%20rural%20india%20men%20non%20farm%20labourers.JPG">average daily nominal wage rate for male</a> <a href="https://im4change.org/upload/files/State%20wise%20average%20daily%20nominal%20wage%20rates%20in%20rural%20india%20men%20non%20farm%20labourers.JPG" title="https://im4change.org/upload/files/State%20wise%20average%20daily%20nominal%20wage%20rates%20in%20rural%20india%20men%20non%20farm%20labourers.JPG">non-agricultural labourers</a> in rural India during the period from 2014-15 to 2020-21 was detected in Kerala <em>(Rs. 639.01)</em>, followed by Jammu and Kashmir <em>(Rs. 426.37)</em>, Tamil Nadu <em>(Rs. 405.77)</em>, Haryana <em>(Rs. 359.24)</em>, Himachal Pradesh <em>(Rs. 311.10)</em>, and Punjab <em>(Rs. 309.09)</em>. Please see chart-1.</p><p style="text-align:justify">The lowest average <a href="https://im4change.org/upload/files/State%20wise%20average%20daily%20nominal%20wage%20rates%20in%20rural%20india%20men%20non%20farm%20labourers.JPG" title="https://im4change.org/upload/files/State%20wise%20average%20daily%20nominal%20wage%20rates%20in%20rural%20india%20men%20non%20farm%20labourers.JPG">daily nominal wage rate for male</a> <a href="https://im4change.org/upload/files/State%20wise%20average%20daily%20nominal%20wage%20rates%20in%20rural%20india%20men%20non%20farm%20labourers.JPG" title="https://im4change.org/upload/files/State%20wise%20average%20daily%20nominal%20wage%20rates%20in%20rural%20india%20men%20non%20farm%20labourers.JPG">non-agricultural labourers in rural India</a> during the period from 2014-15 to 2020-21 was found in Madhya Pradesh <em>(Rs. 191.47)</em>, followed by Meghalaya <em>(Rs. 210.26)</em>, Gujarat <em>(Rs. 213.51)</em>, Odisha <em>(Rs. 218.06)</em>, Maharashtra <em>(Rs. 226.70)</em>, Tripura <em>(Rs. 230.36)</em>, Bihar <em>(Rs. 243.51)</em>, and Uttar Pradesh <em>(Rs. 243.97)</em>. The related national level figure was Rs. 273.79 during the period from 2014-15 to 2020-21. Please see chart-1.</p><p style="text-align:justify">The highest <a href="https://im4change.org/upload/files/State%20wise%20growth%20in%20average%20daily%20nominal%20wage%20rates%20in%20rural%20india%20men%20non%20farm%20labourers.JPG" title="https://im4change.org/upload/files/State%20wise%20growth%20in%20average%20daily%20nominal%20wage%20rates%20in%20rural%20india%20men%20non%20farm%20labourers.JPG">average annual growth rate in</a> <a href="https://im4change.org/upload/files/State%20wise%20growth%20in%20average%20daily%20nominal%20wage%20rates%20in%20rural%20india%20men%20non%20farm%20labourers.JPG" title="https://im4change.org/upload/files/State%20wise%20growth%20in%20average%20daily%20nominal%20wage%20rates%20in%20rural%20india%20men%20non%20farm%20labourers.JPG">nominal wage rates</a> during the period from 2015-16 to 2020-21 was noticed in Odisha <em>(8.0 percent)</em>, followed by Madhya Pradesh <em>(7.6 percent)</em>, Assam <em>(6.6 percent)</em>, West Bengal <em>(5.9 percent)</em>, Uttar Pradesh and Andhra Pradesh <em>(5.6 percent each)</em>, and Bihar <em>(5.5 percent)</em>. Kindly consult chart-2.</p><p style="text-align:justify">The lowest <a href="https://im4change.org/upload/files/State%20wise%20growth%20in%20average%20daily%20nominal%20wage%20rates%20in%20rural%20india%20men%20non%20farm%20labourers.JPG" title="https://im4change.org/upload/files/State%20wise%20growth%20in%20average%20daily%20nominal%20wage%20rates%20in%20rural%20india%20men%20non%20farm%20labourers.JPG">average annual growth rate</a> <a href="https://im4change.org/upload/files/State%20wise%20growth%20in%20average%20daily%20nominal%20wage%20rates%20in%20rural%20india%20men%20non%20farm%20labourers.JPG" title="https://im4change.org/upload/files/State%20wise%20growth%20in%20average%20daily%20nominal%20wage%20rates%20in%20rural%20india%20men%20non%20farm%20labourers.JPG">in nominal wage rates</a> during the same period was observed in Kerala <em>(1.8 percent)</em>, followed by Haryana <em>(2.4 percent)</em>, Meghalaya <em>(2.8 percent)</em>, Tamil Nadu and Rajasthan <em>(3.2 percent each)</em>, Tripura and Jammu and Kashmir <em>(4.0 percent each),</em> and Maharashtra and Punjab <em>(4.2 percent each)</em>. Kindly consult chart-2. </p><p style="text-align:justify">The average annual <a href="https://im4change.org/upload/files/State%20wise%20growth%20in%20average%20daily%20wage%20rates%20in%20real%20terms%20for%20male%20non%20farm%20labourers%20in%20rural%20India.JPG" title="https://im4change.org/upload/files/State%20wise%20growth%20in%20average%20daily%20wage%20rates%20in%20real%20terms%20for%20male%20non%20farm%20labourers%20in%20rural%20India.JPG">growth of non-agricultural labourers’</a> <a href="https://im4change.org/upload/files/State%20wise%20growth%20in%20average%20daily%20wage%20rates%20in%20real%20terms%20for%20male%20non%20farm%20labourers%20in%20rural%20India.JPG" title="https://im4change.org/upload/files/State%20wise%20growth%20in%20average%20daily%20wage%20rates%20in%20real%20terms%20for%20male%20non%20farm%20labourers%20in%20rural%20India.JPG">wage rates in real terms</a> during the period from 2015-16 to 2020-21 were negative in Haryana <em>(-1.9 percent)</em>, Jammu and Kashmir <em>(-1.7 percent)</em>, Kerala <em>(-3.5 percent)</em>, Maharashtra <em>(-0.3 percent)</em>, Meghalaya <em>(-1.2 percent)</em>, Punjab <em>(-0.1 percent)</em>, Rajasthan <em>(-1.2 percent)</em>, Tamil Nadu <em>(-2.1 percent)</em>, and Tripura <em>(-1.1 percent)</em>. It should be noted that the <a href="https://im4change.org/upload/files/State-wise%20Average%20Inflation%20CPI%20-%20Inflation.PDF" title="https://im4change.org/upload/files/State-wise%20Average%20Inflation%20CPI%20-%20Inflation.PDF">rate of inflation</a> in <a href="https://im4change.org/upload/files/State-wise%20Average%20Inflation%20CPI%20-%20Inflation.PDF" title="https://im4change.org/upload/files/State-wise%20Average%20Inflation%20CPI%20-%20Inflation.PDF">CPI-General</a> has been used to get the average annual growth of non-agricultural labourers’ wage rates in real terms. Kindly have a look at table-1. </p><p style="text-align:justify">Some states experienced negative growth in <a href="https://im4change.org/upload/files/State%20wise%20growth%20in%20average%20daily%20wage%20rates%20in%20real%20terms%20for%20male%20non%20farm%20labourers%20in%20rural%20India.JPG" title="https://im4change.org/upload/files/State%20wise%20growth%20in%20average%20daily%20wage%20rates%20in%20real%20terms%20for%20male%20non%20farm%20labourers%20in%20rural%20India.JPG">non-agricultural labourers’ wage</a> <a href="https://im4change.org/upload/files/State%20wise%20growth%20in%20average%20daily%20wage%20rates%20in%20real%20terms%20for%20male%20non%20farm%20labourers%20in%20rural%20India.JPG" title="https://im4change.org/upload/files/State%20wise%20growth%20in%20average%20daily%20wage%20rates%20in%20real%20terms%20for%20male%20non%20farm%20labourers%20in%20rural%20India.JPG">rates in real terms</a> for more than two years between 2015-16 and 2020-21. For example, <a href="https://im4change.org/upload/files/State%20wise%20growth%20in%20average%20daily%20wage%20rates%20in%20real%20terms%20for%20male%20non%20farm%20labourers%20in%20rural%20India.JPG" title="https://im4change.org/upload/files/State%20wise%20growth%20in%20average%20daily%20wage%20rates%20in%20real%20terms%20for%20male%20non%20farm%20labourers%20in%20rural%20India.JPG">Haryana</a> experienced negative <a href="https://im4change.org/upload/files/State%20wise%20growth%20in%20average%20daily%20wage%20rates%20in%20real%20terms%20for%20male%20non%20farm%20labourers%20in%20rural%20India.JPG" title="https://im4change.org/upload/files/State%20wise%20growth%20in%20average%20daily%20wage%20rates%20in%20real%20terms%20for%20male%20non%20farm%20labourers%20in%20rural%20India.JPG">growth in wage rates</a> <a href="https://im4change.org/upload/files/State%20wise%20growth%20in%20average%20daily%20wage%20rates%20in%20real%20terms%20for%20male%20non%20farm%20labourers%20in%20rural%20India.JPG" title="https://im4change.org/upload/files/State%20wise%20growth%20in%20average%20daily%20wage%20rates%20in%20real%20terms%20for%20male%20non%20farm%20labourers%20in%20rural%20India.JPG">(in real terms)</a> during 2016-17, 2017-18, 2018-19, 2019-20, and 2020-21. Likewise, <a href="https://im4change.org/upload/files/State%20wise%20growth%20in%20average%20daily%20wage%20rates%20in%20real%20terms%20for%20male%20non%20farm%20labourers%20in%20rural%20India.JPG" title="https://im4change.org/upload/files/State%20wise%20growth%20in%20average%20daily%20wage%20rates%20in%20real%20terms%20for%20male%20non%20farm%20labourers%20in%20rural%20India.JPG">Kerala</a> faced negative growth rates in 2015-16, 2016-17, 2017-18, 2019-20, and 2020-21. </p><p style="text-align:justify">At the national level, the <a href="https://im4change.org/upload/files/State%20wise%20growth%20in%20average%20daily%20wage%20rates%20in%20real%20terms%20for%20male%20non%20farm%20labourers%20in%20rural%20India.JPG" title="https://im4change.org/upload/files/State%20wise%20growth%20in%20average%20daily%20wage%20rates%20in%20real%20terms%20for%20male%20non%20farm%20labourers%20in%20rural%20India.JPG">non-agricultural labourers’</a> <a href="https://im4change.org/upload/files/State%20wise%20growth%20in%20average%20daily%20wage%20rates%20in%20real%20terms%20for%20male%20non%20farm%20labourers%20in%20rural%20India.JPG" title="https://im4change.org/upload/files/State%20wise%20growth%20in%20average%20daily%20wage%20rates%20in%20real%20terms%20for%20male%20non%20farm%20labourers%20in%20rural%20India.JPG">wage rates in real terms</a> on average grew by just 0.3 percent annually during the period from 2015-16 to 2020-21. </p><p style="text-align:justify">Please <a href="https://docs.google.com/spreadsheets/d/1avu0-WtaKV2RHXtz2eiP7iS8znGVBdKC/edit?usp=sharing&ouid=112233925171588304692&rtpof=true&sd=true" title="https://docs.google.com/spreadsheets/d/1avu0-WtaKV2RHXtz2eiP7iS8znGVBdKC/edit?usp=sharing&ouid=112233925171588304692&rtpof=true&sd=true">click here</a> to access the spreadsheet in order to look at the <a href="/upload/files/State%20wise%20average%20daily%20nominal%20wage%20rates%20in%20rural%20india%20men%20non%20farm%20labourers.JPG" title="/upload/files/State%20wise%20average%20daily%20nominal%20wage%20rates%20in%20rural%20india%20men%20non%20farm%20labourers.JPG">trends in nominal wage rates</a>, <a href="/upload/files/State%20wise%20growth%20in%20average%20daily%20nominal%20wage%20rates%20in%20rural%20india%20men%20non%20farm%20labourers.JPG" title="/upload/files/State%20wise%20growth%20in%20average%20daily%20nominal%20wage%20rates%20in%20rural%20india%20men%20non%20farm%20labourers.JPG">annual growth in nominal wage rates</a>, and <a href="/upload/files/State%20wise%20growth%20in%20average%20daily%20wage%20rates%20in%20real%20terms%20for%20male%20non%20farm%20labourers%20in%20rural%20India.JPG" title="/upload/files/State%20wise%20growth%20in%20average%20daily%20wage%20rates%20in%20real%20terms%20for%20male%20non%20farm%20labourers%20in%20rural%20India.JPG">annual growth in real wage rates</a> for non-farm labourers in rural areas. </p><p style="text-align:justify"><strong>Construction sector wages in rural areas</strong></p><p style="text-align:justify">The <a href="https://im4change.org/upload/files/State%20wise%20average%20daily%20nominal%20wage%20rates%20in%20rural%20india%20men%20construction%20workers.JPG" title="https://im4change.org/upload/files/State%20wise%20average%20daily%20nominal%20wage%20rates%20in%20rural%20india%20men%20construction%20workers.JPG">highest average daily nominal wage rates</a> <a href="https://im4change.org/upload/files/State%20wise%20average%20daily%20nominal%20wage%20rates%20in%20rural%20india%20men%20construction%20workers.JPG" title="https://im4change.org/upload/files/State%20wise%20average%20daily%20nominal%20wage%20rates%20in%20rural%20india%20men%20construction%20workers.JPG">for male construction workers in rural India</a> during the period from 2014-15 to 2020-21 was detected in Kerala <em>(Rs. 810.3)</em>, followed by Jammu and Kashmir <em>(Rs. 445.1)</em>, Tamil Nadu <em>(Rs. 424.1)</em>, Haryana <em>(Rs. 379.9)</em>, Himachal Pradesh <em>(Rs. 368.7)</em>, Rajasthan <em>(Rs. 347.7)</em>, and Punjab <em>(Rs. 339.1)</em>. Kindly see chart-1. </p><p style="text-align:justify">The <a href="https://im4change.org/upload/files/State%20wise%20average%20daily%20nominal%20wage%20rates%20in%20rural%20india%20men%20construction%20workers.JPG" title="https://im4change.org/upload/files/State%20wise%20average%20daily%20nominal%20wage%20rates%20in%20rural%20india%20men%20construction%20workers.JPG">lowest average daily nominal wage rates</a> <a href="https://im4change.org/upload/files/State%20wise%20average%20daily%20nominal%20wage%20rates%20in%20rural%20india%20men%20construction%20workers.JPG" title="https://im4change.org/upload/files/State%20wise%20average%20daily%20nominal%20wage%20rates%20in%20rural%20india%20men%20construction%20workers.JPG">for male construction workers in rural areas</a> during the period from 2014-15 to 2020-21 was found in Madhya Pradesh <em>(Rs. 212.4)</em>, followed by Tripura <em>(Rs. 230.4)</em>, Meghalaya <em>(Rs. 231.7)</em>, Odisha <em>(Rs. 247.1)</em>, Gujarat <em>(Rs. 251.8)</em>, Uttar Pradesh <em>(Rs. 267.4)</em>, Bihar <em>(Rs. 270.8)</em>, and West Bengal <em>(Rs. 274.0)</em>. The related national level figure was Rs. 316.9 during the period from 2014-15 to 2020-21. Kindly consult chart-1.</p><p style="text-align:justify">The <a href="https://im4change.org/upload/files/State%20wise%20growth%20in%20average%20daily%20nominal%20wage%20rates%20in%20rural%20india%20men%20construction%20workers.JPG" title="https://im4change.org/upload/files/State%20wise%20growth%20in%20average%20daily%20nominal%20wage%20rates%20in%20rural%20india%20men%20construction%20workers.JPG">highest average annual growth rates in</a> <a href="https://im4change.org/upload/files/State%20wise%20growth%20in%20average%20daily%20nominal%20wage%20rates%20in%20rural%20india%20men%20construction%20workers.JPG" title="https://im4change.org/upload/files/State%20wise%20growth%20in%20average%20daily%20nominal%20wage%20rates%20in%20rural%20india%20men%20construction%20workers.JPG">nominal wage rates</a> during the period from 2015-16 to 2020-21 was noticed in Meghalaya <em>(20.9 percent)</em>, followed by Madhya Pradesh <em>(7.4 percent)</em>, Odisha and Andhra Pradesh <em>(6.8 percent each)</em>, Uttar Pradesh <em>(6.4 percent)</em>, and Bihar <em>(6.2 percent)</em>. Please see chart-2. </p><p style="text-align:justify">The <a href="https://im4change.org/upload/files/State%20wise%20growth%20in%20average%20daily%20nominal%20wage%20rates%20in%20rural%20india%20men%20construction%20workers.JPG" title="https://im4change.org/upload/files/State%20wise%20growth%20in%20average%20daily%20nominal%20wage%20rates%20in%20rural%20india%20men%20construction%20workers.JPG">lowest average annual growth rates in</a> <a href="https://im4change.org/upload/files/State%20wise%20growth%20in%20average%20daily%20nominal%20wage%20rates%20in%20rural%20india%20men%20construction%20workers.JPG" title="https://im4change.org/upload/files/State%20wise%20growth%20in%20average%20daily%20nominal%20wage%20rates%20in%20rural%20india%20men%20construction%20workers.JPG">nominal wage rates</a> during the same period was observed in Kerala <em>(0.9 percent)</em>, followed by Manipur <em>(2.0 percent)</em>, Haryana <em>(2.1 percent)</em>, Jammu and Kashmir <em>(3.0 percent)</em>, Rajasthan <em>(3.2 percent)</em>, and Gujarat <em>(3.6 percent)</em>. Please see chart-2.</p><p style="text-align:justify">The <a href="https://im4change.org/upload/files/State%20wise%20growth%20in%20average%20daily%20wage%20rates%20in%20real%20terms%20for%20male%20construction%20workers%20in%20rural%20India%281%29.JPG" title="https://im4change.org/upload/files/State%20wise%20growth%20in%20average%20daily%20wage%20rates%20in%20real%20terms%20for%20male%20construction%20workers%20in%20rural%20India%281%29.JPG">average annual growth of construction workers’</a> <a href="https://im4change.org/upload/files/State%20wise%20growth%20in%20average%20daily%20wage%20rates%20in%20real%20terms%20for%20male%20construction%20workers%20in%20rural%20India%281%29.JPG" title="https://im4change.org/upload/files/State%20wise%20growth%20in%20average%20daily%20wage%20rates%20in%20real%20terms%20for%20male%20construction%20workers%20in%20rural%20India%281%29.JPG">wage rates in real terms</a> during the period from 2015-16 to 2020-21 was negative in Assam <em>(-1.2 percent)</em>, Haryana <em>(-2.1 percent)</em>, Jammu and Kashmir <em>(-2.7 percent)</em>, Karnataka <em>(-0.6 percent)</em>, Kerala <em>(-4.4 percent)</em>, Manipur <em>(-6.3 percent)</em>, Rajasthan <em>(-1.2 percent)</em>, Tamil Nadu <em>(-0.9 percent)</em>, and Tripura <em>(-1.1 percent)</em>. Please note that the <a href="https://im4change.org/upload/files/State-wise%20Average%20Inflation%20CPI%20-%20Inflation.PDF" title="https://im4change.org/upload/files/State-wise%20Average%20Inflation%20CPI%20-%20Inflation.PDF">rate of inflation</a> in <a href="https://im4change.org/upload/files/State-wise%20Average%20Inflation%20CPI%20-%20Inflation.PDF" title="https://im4change.org/upload/files/State-wise%20Average%20Inflation%20CPI%20-%20Inflation.PDF">CPI-General</a> has been used to get the average annual growth of construction workers’ wage rates in real terms. Kindly have a look at table-1. </p><p style="text-align:justify">In the case of Meghalaya, the <a href="https://im4change.org/upload/files/State%20wise%20average%20daily%20nominal%20wage%20rates%20in%20rural%20india%20men%20construction%20workers.JPG" title="https://im4change.org/upload/files/State%20wise%20average%20daily%20nominal%20wage%20rates%20in%20rural%20india%20men%20construction%20workers.JPG">nominal daily wage rate of male construction</a> <a href="https://im4change.org/upload/files/State%20wise%20average%20daily%20nominal%20wage%20rates%20in%20rural%20india%20men%20construction%20workers.JPG" title="https://im4change.org/upload/files/State%20wise%20average%20daily%20nominal%20wage%20rates%20in%20rural%20india%20men%20construction%20workers.JPG">workers</a> fell from Rs. 186.0 in 2016-17 to Rs. 100.0 in 2017-18 i.e., a decline by -46.2 percent over previous year. However, the same bounced back to Rs. 273.2 in 2018-19 i.e., an increase by 173.2 percent over previous year. In <a href="https://im4change.org/upload/files/State%20wise%20growth%20in%20average%20daily%20wage%20rates%20in%20real%20terms%20for%20male%20construction%20workers%20in%20rural%20India%281%29.JPG" title="https://im4change.org/upload/files/State%20wise%20growth%20in%20average%20daily%20wage%20rates%20in%20real%20terms%20for%20male%20construction%20workers%20in%20rural%20India%281%29.JPG">real terms, the construction sector</a> <a href="https://im4change.org/upload/files/State%20wise%20growth%20in%20average%20daily%20wage%20rates%20in%20real%20terms%20for%20male%20construction%20workers%20in%20rural%20India%281%29.JPG" title="https://im4change.org/upload/files/State%20wise%20growth%20in%20average%20daily%20wage%20rates%20in%20real%20terms%20for%20male%20construction%20workers%20in%20rural%20India%281%29.JPG">wage rate in Meghalaya</a> grew by -47.7 percent in 2017-18 <em>(over previous year)</em> and 171.0 percent in 2018-19 <em>(over previous year)</em>.</p><p style="text-align:justify">Some states experienced negative <a href="https://im4change.org/upload/files/State%20wise%20growth%20in%20average%20daily%20wage%20rates%20in%20real%20terms%20for%20male%20construction%20workers%20in%20rural%20India%281%29.JPG" title="https://im4change.org/upload/files/State%20wise%20growth%20in%20average%20daily%20wage%20rates%20in%20real%20terms%20for%20male%20construction%20workers%20in%20rural%20India%281%29.JPG">growth in construction workers’</a> <a href="https://im4change.org/upload/files/State%20wise%20growth%20in%20average%20daily%20wage%20rates%20in%20real%20terms%20for%20male%20construction%20workers%20in%20rural%20India%281%29.JPG" title="https://im4change.org/upload/files/State%20wise%20growth%20in%20average%20daily%20wage%20rates%20in%20real%20terms%20for%20male%20construction%20workers%20in%20rural%20India%281%29.JPG">wage rates in real terms</a> for more than two years between 2015-16 and 2020-21. For example, <a href="https://im4change.org/upload/files/State%20wise%20growth%20in%20average%20daily%20wage%20rates%20in%20real%20terms%20for%20male%20construction%20workers%20in%20rural%20India%281%29.JPG" title="https://im4change.org/upload/files/State%20wise%20growth%20in%20average%20daily%20wage%20rates%20in%20real%20terms%20for%20male%20construction%20workers%20in%20rural%20India%281%29.JPG">Assam</a> experienced negative growth in wage rates <em>(in real terms)</em> during 2017-18, 2018-19, 2019-20, and 2020-21. </p><p style="text-align:justify">At the national level, the <a href="https://im4change.org/upload/files/State%20wise%20growth%20in%20average%20daily%20wage%20rates%20in%20real%20terms%20for%20male%20construction%20workers%20in%20rural%20India%281%29.JPG" title="https://im4change.org/upload/files/State%20wise%20growth%20in%20average%20daily%20wage%20rates%20in%20real%20terms%20for%20male%20construction%20workers%20in%20rural%20India%281%29.JPG">construction workers’ wage rates in real terms</a> on average grew by just 0.1 percent annually during the period from 2015-16 to 2020-21.</p><p style="text-align:justify">Kindly <a href="https://docs.google.com/spreadsheets/d/1avu0-WtaKV2RHXtz2eiP7iS8znGVBdKC/edit?usp=sharing&ouid=112233925171588304692&rtpof=true&sd=true" title="https://docs.google.com/spreadsheets/d/1avu0-WtaKV2RHXtz2eiP7iS8znGVBdKC/edit?usp=sharing&ouid=112233925171588304692&rtpof=true&sd=true">click here</a> to access the spreadsheet in order to look at the <a href="/upload/files/State%20wise%20average%20daily%20nominal%20wage%20rates%20in%20rural%20india%20men%20construction%20workers.JPG" title="/upload/files/State%20wise%20average%20daily%20nominal%20wage%20rates%20in%20rural%20india%20men%20construction%20workers.JPG">trends in nominal wage rates</a>, <a href="/upload/files/State%20wise%20growth%20in%20average%20daily%20nominal%20wage%20rates%20in%20rural%20india%20men%20construction%20workers.JPG" title="/upload/files/State%20wise%20growth%20in%20average%20daily%20nominal%20wage%20rates%20in%20rural%20india%20men%20construction%20workers.JPG">annual growth in nominal wage rates</a>, and <a href="/upload/files/State%20wise%20growth%20in%20average%20daily%20wage%20rates%20in%20real%20terms%20for%20male%20construction%20workers%20in%20rural%20India%281%29.JPG" title="/upload/files/State%20wise%20growth%20in%20average%20daily%20wage%20rates%20in%20real%20terms%20for%20male%20construction%20workers%20in%20rural%20India%281%29.JPG">annual growth in real wage rates</a> for construction workers in rural areas. </p><p style="text-align:justify"><strong>Data collection methodology</strong></p><p style="text-align:justify">As a part of Rural Labour Enquiry, the <a href="https://im4change.org/upload/files/ilj_feb_2013.pdf" title="https://im4change.org/upload/files/ilj_feb_2013.pdf">daily wage rates</a> in respect of eighteen agricultural and non-agricultural occupations are being collected along with rural retail price data by the Field Operations Division of the National Sample Survey Organisation since 1986-87, according to a February 2013 <a href="https://im4change.org/upload/files/ilj_feb_2013.pdf" title="https://im4change.org/upload/files/ilj_feb_2013.pdf">edition of the Indian Labour Journal</a>. On the recommendations of the Governing Council of the National Sample Survey Organisation in its 61st meeting, the <a href="https://im4change.org/upload/files/ilj_feb_2013.pdf" title="https://im4change.org/upload/files/ilj_feb_2013.pdf">Labour Bureau</a> started the compilation and analysis of wage rate data with effect from April, 1998. </p><p style="text-align:justify">The Field Operations Division of the National Sample Survey Organisation has been entrusted with the work of <a href="https://im4change.org/upload/files/METHOLOGY%20FOR%20COMPILATION%20OF%20THE%20WAGE%20RATE%20DATA.pdf" title="https://im4change.org/upload/files/METHOLOGY%20FOR%20COMPILATION%20OF%20THE%20WAGE%20RATE%20DATA.pdf">data collection</a>. The <a href="https://im4change.org/upload/files/METHOLOGY%20FOR%20COMPILATION%20OF%20THE%20WAGE%20RATE%20DATA.pdf" title="https://im4change.org/upload/files/METHOLOGY%20FOR%20COMPILATION%20OF%20THE%20WAGE%20RATE%20DATA.pdf">wage rate data</a> are being collected along with rural retail prices from 600 sample villages spread over 66 NSS regions of 20 States by canvassing Block-5 <em>(Annexure-I)</em> of Schedule 3.01(R). The data collection from these sample villages is staggered over the four weeks of a month with one-fourth of them being covered every week. The days of canvassing of Schedule 3.01(R) are fixed. The village functionaries like the Panchayat Secretary, Progress Assistant, Patwari and other Village or Block Officials are the primary informants for collection of data on wage rates. The data on normal working hours and the prevailing wage rates in cash and kind for the reported working hours are collected sex-wise for each of the 18 selected occupations in 20 states, indicates an old <a href="https://im4change.org/upload/files/METHOLOGY%20FOR%20COMPILATION%20OF%20THE%20WAGE%20RATE%20DATA.pdf" title="https://im4change.org/upload/files/METHOLOGY%20FOR%20COMPILATION%20OF%20THE%20WAGE%20RATE%20DATA.pdf">document</a> of the Labour Bureau. </p><p style="text-align:justify">The wage rates are sometimes reported for a duration that is less/more than the normal working hours. In such cases, they are <a href="https://im4change.org/upload/files/METHOLOGY%20FOR%20COMPILATION%20OF%20THE%20WAGE%20RATE%20DATA.pdf" title="https://im4change.org/upload/files/METHOLOGY%20FOR%20COMPILATION%20OF%20THE%20WAGE%20RATE%20DATA.pdf">first normalised for eight hours</a> working day. As regards the mode of payment of wages, it is made in both ways i.e., in cash and/or in kind. The payments made in kind are very common in rural areas, which include foodgrains, cooked food, tea, fuel, cigarette, beedi, fodder, etc. The wages reported in kind are evaluated at local retail prices. Thereafter, the data is thoroughly scrutinised and discrepant points are referred back to the field for clarification. In the next stage, the simple arithmetic average of these normalised daily wage rates is worked out occupation-wise and sex-wise for each state.</p><p style="text-align:justify"><a href="http://ras.org.in/methodology_of_data_collection_unsuited_to_changing_rural_reality" title="http://ras.org.in/methodology_of_data_collection_unsuited_to_changing_rural_reality">Up to June 2000</a>, the average wage rates at the national level were derived by taking the simple average of state figures; since July 2000, the averages have been obtained by dividing the sum total of wages of all 20 states by the number of centres or villages from which data were collected. The state-wise averages are restricted only to those occupations where the number of centres is five or more to avoid abnormal fluctuations and inconsistency in wages paid to different categories of workers on account of varying numbers of centres. However, in order to calculate the all-India averages, all neglected centres are taken into account to arrive at the total number of centres at the national level.</p><p style="text-align:justify">The <a href="/upload/files/RBI%20note%20Average%20Daily%20Wage%20rate%20Methodology.pdf" title="/upload/files/RBI%20note%20Average%20Daily%20Wage%20rate%20Methodology.pdf">Reserve Bank of India</a> <em>(whose data we have used in writing this news alert)</em> has collated and is releasing monthly time series data on rural wage rates based on the data published by the Labour Bureau, Government of India. Starting from November 2013 the Labour Bureau is collecting the rural wage data in respect of 12 agricultural and 13 non-agricultural occupations across 20 major states, namely, Andhra Pradesh, Assam, Bihar, Gujarat, Haryana, Himachal Pradesh, Jammu & Kashmir, Karnataka, Kerala, Madhya Pradesh, Maharashtra, Manipur, Meghalaya, Orissa, Punjab, Rajasthan, Tamil Nadu, Tripura, Uttar Pradesh and West Bengal. The occupations for which the daily wage rates are collected every month are: <u>(A) Agricultural occupations</u> – (1) Ploughing/ Tilling workers, (2) Sowing <em>(including planting/ Transplanting/ Weeding)</em> workers, (3) Harvesting/ Winnowing/ Threshing workers, (4) Picking workers <em>(including Tea, Cotton, Tobacco and other commercial crops)</em>, (5) Horticulture workers <em>(including nursery growers)</em>, (6) Fishermen-inland, (7) Fishermen coastal/deep-sea, (8) Loggers and wood cutters, (9) Animal husbandry workers <em>(including poultry workers, dairy workers and herdsman)</em>, (10) Packaging labourers, agriculture, (11) General agricultural labourers <em>(including watering/ irrigation workers, etc.)</em>, (12) Plant protection workers <em>(applying pesticides, treating seeds, etc.)</em>; and <u>(B) Non-agricultural occupations</u> – (13) Carpenter, (14) Blacksmith, (15) Mason, (16) Weavers, (17) Beedi makers, (18) Bamboo, cane basket weavers, (19) Handicraft workers, (20) Plumbers, (21) Electrician, (22) Construction workers <em>(for roads, dams, industrial & project construction work and Well diggers)</em>, (23) LMV & Tractor drivers, (24) Non-agricultural labourers <em>(including porters, loaders)</em>, and (25) Sweeping/cleaning workers. </p><p style="text-align:justify"><strong><em>References </em></strong></p><p style="text-align:justify">Handbook of Statistics on Indian States 2020-21, released in November 2021, please <a href="https://m.rbi.org.in/scripts/AnnualPublications.aspx?head=Handbook%20of%20Statistics%20on%20Indian%20States" title="https://m.rbi.org.in/scripts/AnnualPublications.aspx?head=Handbook%20of%20Statistics%20on%20Indian%20States">click here</a> to access</p><p style="text-align:justify">State-wise Average Daily Wage Rates in Rural India (Men - General Agricultural Labourers), RBI Handbook of Statistics on Indian States 2020-21, released in November 2021, please <a href="/upload/files/State-wise%20Average%20Daily%20Wage%20Rates%20in%20Rural%20India%20Men%20-%20General%20Agricultural%20Labourers.PDF" title="/upload/files/State-wise%20Average%20Daily%20Wage%20Rates%20in%20Rural%20India%20Men%20-%20General%20Agricultural%20Labourers.PDF">click here</a> to access </p><p style="text-align:justify">State-wise Average Daily Wage Rates in Rural India (Men - Non-Agricultural Labourers), RBI Handbook of Statistics on Indian States 2020-21, released in November 2021, please <a href="/upload/files/State-wise%20Average%20Daily%20Wage%20Rates%20in%20Rural%20India%20Men%20-%20Non%20Agricultural%20Labourers.PDF" title="/upload/files/State-wise%20Average%20Daily%20Wage%20Rates%20in%20Rural%20India%20Men%20-%20Non%20Agricultural%20Labourers.PDF">click here</a> to access </p><p style="text-align:justify">State-wise Average Daily Wage Rates in Rural India (Men - Construction Workers), RBI Handbook of Statistics on Indian States 2020-21, released in November 2021, please <a href="/upload/files/State-wise%20Average%20Daily%20Wage%20Rates%20in%20Rural%20India%20Men%20-%20Construction%20Workers.PDF" title="/upload/files/State-wise%20Average%20Daily%20Wage%20Rates%20in%20Rural%20India%20Men%20-%20Construction%20Workers.PDF">click here</a> to access </p><p style="text-align:justify">State-wise Average Inflation (CPI) - Inflation, RBI Handbook of Statistics on Indian States 2020-21, released in November 2021, please <a href="/upload/files/State-wise%20Average%20Inflation%20CPI%20-%20Inflation.PDF" title="/upload/files/State-wise%20Average%20Inflation%20CPI%20-%20Inflation.PDF">click here</a> to access </p><p style="text-align:justify">Indian Labour Journal, February 2013, please <a href="/upload/files/ilj_feb_2013.pdf" title="/upload/files/ilj_feb_2013.pdf">click here</a> to access </p><p style="text-align:justify">Wage Rates in Rural India 2003-04: Methodology for Compilation of the Wage Rate Data, Labour Bureau, please <a href="/upload/files/METHOLOGY%20FOR%20COMPILATION%20OF%20THE%20WAGE%20RATE%20DATA.pdf" title="/upload/files/METHOLOGY%20FOR%20COMPILATION%20OF%20THE%20WAGE%20RATE%20DATA.pdf">click here</a> to access </p><p style="text-align:justify">Average Daily Wage Rates in Rural India: Methodology and coverage (From November 2013), Reserve Bank of India, please <a href="https://dbie.rbi.org.in" title="https://dbie.rbi.org.in">click here</a> and <a href="/upload/files/RBI%20note%20Average%20Daily%20Wage%20rate%20Methodology%281%29.pdf" title="/upload/files/RBI%20note%20Average%20Daily%20Wage%20rate%20Methodology%281%29.pdf">here</a> to access </p><p style="text-align:justify">Consumer Price Index Numbers on Base 2012=100 for Rural, Urban and Combined for the month of January 2022, Ministry of Statistics and Programme Implementation (MoSPI), National Statistical Office (NSO), released on 14th February 2022, please <a href="/upload/files/CPI%20Press%20Release%20January%202022%281%29.pdf" title="/upload/files/CPI%20Press%20Release%20January%202022%281%29.pdf">click here</a> to access </p><p style="text-align:justify">Methodology of Data Collection Unsuited to Changing Rural Reality: A Study of Agricultural Wage Data in India -Yoshifumi Usami, Arindam Das, and Madhura Swaminathan, Review of Agrarian Studies, Vol. 10, No. 2, July-December, 2020, please <a href="http://ras.org.in/methodology_of_data_collection_unsuited_to_changing_rural_reality" title="http://ras.org.in/methodology_of_data_collection_unsuited_to_changing_rural_reality">click here</a> to access</p><p>Russia-ukraine crisis to push up fertiliser prices, govt subsidies, IANS/ Business Standard, 4 March, 2022, please <a href="https://www.business-standard.com/article/economy-policy/russia-ukraine-crisis-to-push-up-fertiliser-prices-govt-subsidies-122030400560_1.html" title="https://www.business-standard.com/article/economy-policy/russia-ukraine-crisis-to-push-up-fertiliser-prices-govt-subsidies-122030400560_1.html">click here</a> to access </p><p>Cooking oil prices spike in India due to Russia-ukraine crisis -B Krishna Mohan, TelanganaToday.com, 3 March, 2022, please <a href="https://telanganatoday.com/cooking-oil-prices-spike-in-india-due-to-russia-ukraine-crisis" title="https://telanganatoday.com/cooking-oil-prices-spike-in-india-due-to-russia-ukraine-crisis">click here</a> to access </p><p>Govt reviews cooking oil imports as ukraine crisis disrupts supplies, prices shoot up -Amiti Sen and Prabhudutta Mishra, The Hindu Business Line, 4 March, 2022, please <a href="https://www.thehindubusinessline.com/markets/commodities/govt-reviews-cooking-oil-imports-as-ukraine-crisis-disrupts-supplies-prices-shoot-up/article65190879.ece" title="https://www.thehindubusinessline.com/markets/commodities/govt-reviews-cooking-oil-imports-as-ukraine-crisis-disrupts-supplies-prices-shoot-up/article65190879.ece">click here</a> to access </p><p>India's Economy Faces A Potential Stagflation Risk From Ukraine War -Sunil Prabhu, NDTV.com, 1 March, 2022, please <a href="https://www.ndtv.com/business/indias-economy-faces-a-potential-stagflation-risk-from-ukraine-war-2796624" title="https://www.ndtv.com/business/indias-economy-faces-a-potential-stagflation-risk-from-ukraine-war-2796624">click here</a> to access</p><p>India to be one of Asia’s ‘biggest losers’ from the Ukraine war as Russia slammed by global sanctions -Paran Balakrishnan, The Telegraph, 1 March, 2022, please <a href="https://www.telegraphindia.com/business/russia-ukraine-crisis-india-to-be-one-of-asias-biggest-losers-from-the-ukraine-war-as-russia-slammed-by-global-sanctions/cid/1854032" title="https://www.telegraphindia.com/business/russia-ukraine-crisis-india-to-be-one-of-asias-biggest-losers-from-the-ukraine-war-as-russia-slammed-by-global-sanctions/cid/1854032">click here</a> to access</p><p>Crude Oil Prices Rise, Tracking Russia-Ukraine Conflict -Rahul Karunakar, NDTV.com <em>(with inputs from Agencies)</em>, 1 March, 2022, please <a href="https://www.ndtv.com/business/crude-oil-prices-rise-on-tuesday-tracking-russia-ukraine-conflict-2796187" title="https://www.ndtv.com/business/crude-oil-prices-rise-on-tuesday-tracking-russia-ukraine-conflict-2796187">click here</a> to access</p><p>Cooking Oil May Become Costlier Due to Russia-ukraine War. Know Why, News18.com, 27 February, 2022, please <a href="https://www.news18.com/news/business/markets/cooking-oil-may-become-costlier-due-to-russia-ukraine-war-know-why-4812740.html" title="https://www.news18.com/news/business/markets/cooking-oil-may-become-costlier-due-to-russia-ukraine-war-know-why-4812740.html">click here</a> to access </p><p style="text-align:justify"><strong>Image Courtesy: Inclusive Media for Change/ Shambhu Ghatak</strong></p> </font>
</td>
</tr>
<tr>
<td> </td>
</tr>
<tr>
<td height="50" style="border-top:1px solid #000; border-bottom:1px solid #000;padding-top:10px;">
<form><input type="button" value=" Print this page "
onclick="window.print();return false;"/></form>
</td>
</tr>
</table></body>
</html>'
}
$cookies = []
$values = [
(int) 0 => 'text/html; charset=UTF-8'
]
$name = 'Content-Type'
$first = true
$value = 'text/html; charset=UTF-8'
header - [internal], line ??
Cake\Http\ResponseEmitter::emitHeaders() - CORE/src/Http/ResponseEmitter.php, line 181
Cake\Http\ResponseEmitter::emit() - CORE/src/Http/ResponseEmitter.php, line 55
Cake\Http\Server::emit() - CORE/src/Http/Server.php, line 141
[main] - ROOT/webroot/index.php, line 39
Notice (8): Undefined variable: urlPrefix [APP/Template/Layout/printlayout.ctp, line 8]
$viewFile = '/home/brlfuser/public_html/src/Template/Layout/printlayout.ctp'
$dataForView = [
'article_current' => object(App\Model\Entity\Article) {
'id' => (int) 62349,
'title' => 'Real wage rates of the rural workers hardly increased during the last 6 years',
'subheading' => null,
'description' => '<p style="text-align:justify">In the absence of income or expenditure-based headcount ratio, the growth in the real wages <em>(i.e., nominal wages adjusted against retail inflation)</em> of the manual workers is considered to be a good proxy to assess the trends in poverty. This is because the manual, unskilled/ semi-skilled labourers exist at the bottom of the pyramid or economic hierarchy, and most of them belong to the social categories Scheduled Castes (SCs) and Scheduled Tribes (STs). A positive growth in their real wages <em>(or real wage rates) </em>is anticipated to improve their purchasing power <em>(i.e., income or consumption expenditure)</em> and lift them out of the poverty trap. </p>
<p style="text-align:justify">Clearly, there exists inter-state differences in nominal wage rates, growth in nominal wage rates and growth in real wage rates, which we will see in this news alert. </p>
<p style="text-align:justify">Against the backdrop of the <a href="https://www.thehindubusinessline.com/markets/commodities/govt-reviews-cooking-oil-imports-as-ukraine-crisis-disrupts-supplies-prices-shoot-up/article65190879.ece">Russia-Ukraine conflict</a>, which is anticipated to cause both <a href="https://www.ndtv.com/business/indias-economy-faces-a-potential-stagflation-risk-from-ukraine-war-2796624">food and fuel retail inflation</a> in India in the coming times, it is even more important to look at the past trends in wage rate growth of the rural workers. It should be noted that the <a href="https://public.flourish.studio/visualisation/8706137">year-on-year inflation</a> in <a href="https://public.flourish.studio/visualisation/8706137">Consumer</a> <a href="https://public.flourish.studio/visualisation/8706137">Price Index Rural</a> exceeded the <a href="https://public.flourish.studio/visualisation/8706137">year-on-year inflation</a> in <a href="https://public.flourish.studio/visualisation/8706137">CPI Urban</a> during January 2022 at the national level. Even before the beginning of Russia-Ukraine conflict <em>(i.e., during January 2022)</em>, in rural areas, <a href="https://im4change.org/upload/files/CPI%20Press%20Release%20January%202022%281%29.pdf">retail inflation rate of 20.6 percent</a> was noticed for 'oils and fats', aside from <a href="https://im4change.org/upload/files/CPI%20Press%20Release%20January%202022%281%29.pdf">8.44 percent retail inflation for 'fuel and light'</a>, <a href="https://im4change.org/upload/files/CPI%20Press%20Release%20January%202022%281%29.pdf">8.27 percent</a> for 'transport and communication', and <a href="https://im4change.org/upload/files/CPI%20Press%20Release%20January%202022%281%29.pdf">9.65 percent for 'clothing and footwear'</a>. </p>
<p style="text-align:justify">At the national level, the average daily nominal wage rate for male construction workers in rural areas during the period from 2014-15 to 2020-21 was Rs. 316.9, which was greater than that of the male non-farm workers in rural areas. The average daily nominal wage rate for male non-agricultural labourers in rural areas during the period from 2014-15 to 2020-21 was Rs. 273.8, which exceeded the average daily nominal wage rates for male farm labourers in rural areas <em>(i.e., Rs. 265.1)</em>. However, in Andhra Pradesh, Haryana, Himachal Pradesh, Jammu and Kashmir, Karnataka, Kerala, Meghalaya, Punjab, and Tripura, the average daily nominal wage rates for male agricultural labourers in rural areas during the period from 2014-15 to 2020-21 exceeded the average daily nominal wage rates for male non-farm labourers in rural areas. Please see chart-1.</p>
<p style="text-align:justify"><img alt="" src="/upload/images/Chart%201.png" style="height:670px; width:1000px" /></p>
<p style="text-align:justify"><em><strong>Notes:</strong> The average (i.e., arithmetic mean) daily nominal wage rates for various categories of workers in rural India in the period from 2014-15 to 2020-21 has been calculated by the Inclusive Media for Change staff</em></p>
<p style="text-align:justify"><em>Please <a href="https://docs.google.com/spreadsheets/d/1avu0-WtaKV2RHXtz2eiP7iS8znGVBdKC/edit?usp=sharing&ouid=112233925171588304692&rtpof=true&sd=true">click here</a> to access the data in spreadsheet format</em></p>
<p style="text-align:justify"><em><strong>Source: </strong>Handbook of Statistics on Indian States 2020-21, released in November 2021, please <a href="https://m.rbi.org.in/scripts/AnnualPublications.aspx?head=Handbook%20of%20Statistics%20on%20Indian%20States">click here</a> to access</em></p>
<p style="text-align:justify"><em>State-wise Average Daily Wage Rates in Rural India (Men - General Agricultural Labourers), RBI Handbook of Statistics on Indian States 2020-21, released in November 2021, please <a href="/upload/files/State-wise%20Average%20Daily%20Wage%20Rates%20in%20Rural%20India%20Men%20-%20General%20Agricultural%20Labourers.PDF">click here</a> to access </em></p>
<p style="text-align:justify"><em>State-wise Average Daily Wage Rates in Rural India (Men - Non-Agricultural Labourers), RBI Handbook of Statistics on Indian States 2020-21, released in November 2021, please <a href="/upload/files/State-wise%20Average%20Daily%20Wage%20Rates%20in%20Rural%20India%20Men%20-%20Non%20Agricultural%20Labourers.PDF">click here</a> to access </em></p>
<p style="text-align:justify"><em>State-wise Average Daily Wage Rates in Rural India (Men - Construction Workers), RBI Handbook of Statistics on Indian States 2020-21, released in November 2021, please <a href="/upload/files/State-wise%20Average%20Daily%20Wage%20Rates%20in%20Rural%20India%20Men%20-%20Construction%20Workers.PDF">click here</a> to access </em></p>
<p style="text-align:justify"><em>State-wise Average Inflation (CPI) - Inflation, RBI Handbook of Statistics on Indian States 2020-21, released in November 2021, please <a href="/upload/files/State-wise%20Average%20Inflation%20CPI%20-%20Inflation.PDF">click here</a> to access </em></p>
<p style="text-align:justify"><strong>---</strong></p>
<p style="text-align:justify">At the national level, the agricultural nominal wage rate grew faster than the non-farm wage rate on average for male labourers in rural areas during the period from 2015-16 to 2020-21. However, in states like Assam, Bihar, Haryana, Madhya Pradesh, Odisha, Punjab, and West Bengal, the non-farm nominal wage rates grew faster than the farm wage rates on average for male workers in rural areas during the period from 2015-16 to 2020-21. Please see chart-2. </p>
<p style="text-align:justify"><img alt="" src="/upload/images/Chart%202.png" style="height:653px; width:1000px" /></p>
<p style="text-align:justify"><em><strong>Notes: </strong>The average growth in daily nominal wage rates for various categories of workers in rural India in the period from 2015-16 to 2020-21 has been calculated by the Inclusive Media for Change staff</em></p>
<p style="text-align:justify"><em>Please <a href="https://docs.google.com/spreadsheets/d/1avu0-WtaKV2RHXtz2eiP7iS8znGVBdKC/edit?usp=sharing&ouid=112233925171588304692&rtpof=true&sd=true">click here</a> to access the data in spreadsheet format</em></p>
<p style="text-align:justify"><em><strong>Source: </strong>Same as above</em><br />
<strong>---</strong></p>
<p style="text-align:justify">At the national level, the construction sector nominal wage rate grew slower than the non-agricultural wage rate on average for male labourers in rural areas during the period from 2015-16 to 2020-21. However, in states like Andhra Pradesh, Bihar, Himachal Pradesh, Maharashtra, Meghalaya, Punjab, Tamil Nadu, and Uttar Pradesh, the construction sector nominal wage rates grew faster than the non-farm wage rates on average for male workers in rural areas during the period from 2015-16 to 2020-21. Please take a look at chart-2. </p>
<p style="text-align:justify">At the national level, the agricultural wage rate in real terms grew faster than the non-farm wage rate on average for male labourers in rural areas during the period from 2015-16 to 2020-21. However, in states like Assam, Bihar, Haryana, Madhya Pradesh, Odisha, Punjab, and West Bengal, the non-farm wage rates in real terms grew faster than the farm wage rates on average for male workers in rural areas during the period from 2015-16 to 2020-21. Please see table-1.</p>
<p style="text-align:justify"><strong>Table 1: State-wise Growth in Average Daily Wage Rates in Real terms for Male Agricultural Labourers, Male Non-Agricultural Labourers, and Male Construction Workers in Rural India, in %</strong><br />
<img alt="" src="/upload/images/Table%201%20State-wise%20Growth%20in%20Average%20Daily%20Wage%20Rates%20in%20Real%20terms%20for%20Male%20Agricultural%20Labourers%20Male%20Non-Agricultural%20Labourers%20and%20Male%20Construction%20Workers%20in%20Rural%20India%20in%20percent.png" style="height:539px; width:750px" /></p>
<p style="text-align:justify"><em><strong>Notes: </strong>The average growth in daily wage rates in real terms for various categories of workers in rural India in the period from 2015-16 to 2020-21 has been calculated by the Inclusive Media for Change staff</em></p>
<p style="text-align:justify"><em>Please <a href="https://docs.google.com/spreadsheets/d/1avu0-WtaKV2RHXtz2eiP7iS8znGVBdKC/edit?usp=sharing&ouid=112233925171588304692&rtpof=true&sd=true">click here</a> to access the data in spreadsheet format</em></p>
<p style="text-align:justify"><em><strong>Source: </strong>Same as above</em><br />
<strong>---</strong></p>
<p style="text-align:justify">At the national level, the construction sector wage rate in real terms grew slower than the non-agricultural wage rate on average for male labourers in rural areas during the period from 2015-16 to 2020-21. However, in states like Andhra Pradesh, Bihar, Himachal Pradesh, Maharashtra, Meghalaya, Punjab, Tamil Nadu, and Uttar Pradesh, the construction sector wage rates in real terms grew faster than the non-farm wage rates on average for male workers in rural areas during the period from 2015-16 to 2020-21. Please take a look at table-1. </p>
<p style="text-align:justify">In the following paragraphs, we have discussed the trends in agricultural wage rates, non-farm wage rates, and construction sector wage rates <em>(in rural areas)</em> in detail. </p>
<p style="text-align:justify"><strong>Agricultural wages in rural areas</strong></p>
<p style="text-align:justify">The highest <a href="https://im4change.org/upload/files/State%20wise%20average%20daily%20nominal%20wage%20rates%20in%20rural%20india%20men%20farm%20labourers.JPG">average daily nominal wage rate</a> <a href="https://im4change.org/upload/files/State%20wise%20average%20daily%20nominal%20wage%20rates%20in%20rural%20india%20men%20farm%20labourers.JPG">for male agricultural labourers</a> in rural India during the period from 2014-15 to 2020-21 was found in Kerala <em>(Rs. 653.93)</em>, followed by Jammu and Kashmir <em>(Rs. 429.19)</em>, Tamil Nadu <em>(Rs. 385.6)</em>, Haryana <em>(Rs. 368.53)</em>, Himachal Pradesh <em>(Rs. 366.23)</em>, and Punjab <em>(Rs. 325.31)</em>. Please have a look at chart-1.</p>
<p style="text-align:justify">The lowest <a href="https://im4change.org/upload/files/State%20wise%20average%20daily%20nominal%20wage%20rates%20in%20rural%20india%20men%20farm%20labourers.JPG">average daily nominal wage rate</a> <a href="https://im4change.org/upload/files/State%20wise%20average%20daily%20nominal%20wage%20rates%20in%20rural%20india%20men%20farm%20labourers.JPG">for male agricultural labourers</a> in rural India during the period from 2014-15 to 2020-21 was observed in Madhya Pradesh <em>(Rs. 183.97)</em>, followed by Gujarat <em>(Rs. 190.07)</em>, Maharashtra <em>(Rs. 215.71)</em>, Odisha <em>(Rs. 216.87)</em>, Meghalaya <em>(Rs. 219.93)</em>, Bihar <em>(Rs. 230.43)</em>, Uttar Pradesh <em>(Rs. 230.5)</em>, and Assam <em>(Rs. 237.3)</em>. The related national level figure was Rs. 265.09 during the period from 2014-15 to 2020-21. Please consult chart-1. </p>
<p style="text-align:justify">The highest <a href="https://im4change.org/upload/files/State%20wise%20growth%20in%20average%20daily%20nominal%20wage%20rates%20in%20rural%20india%20men%20farm%20labourers.JPG">average annual growth rate in</a> <a href="https://im4change.org/upload/files/State%20wise%20growth%20in%20average%20daily%20nominal%20wage%20rates%20in%20rural%20india%20men%20farm%20labourers.JPG">nominal wage rates</a> during the period from 2015-16 to 2020-21 was found in Karnataka <em>(7.3 percent)</em>, followed by Andhra Pradesh <em>(6.8 percent)</em>, Madhya Pradesh <em>(6.4 percent)</em>, Uttar Pradesh <em>(6.2 percent)</em>, Odisha <em>(6.1 percent)</em>, and Meghalaya <em>(6.0 percent)</em>. Please see chart-2.</p>
<p style="text-align:justify">The lowest <a href="https://im4change.org/upload/files/State%20wise%20growth%20in%20average%20daily%20nominal%20wage%20rates%20in%20rural%20india%20men%20farm%20labourers.JPG">average annual growth rate</a> <a href="https://im4change.org/upload/files/State%20wise%20growth%20in%20average%20daily%20nominal%20wage%20rates%20in%20rural%20india%20men%20farm%20labourers.JPG">in nominal wage rates</a> during the same period was noticed in Haryana <em>(2.1 percent)</em>, followed by Rajasthan <em>(3.3 percent)</em>, Kerala <em>(3.5 percent)</em>, Punjab <em>(3.9 percent)</em>, and Tamil Nadu <em>(4.5 percent)</em>. Please consult chart-2.</p>
<p style="text-align:justify">The average annual <a href="https://im4change.org/upload/files/State%20wise%20growth%20in%20average%20daily%20wage%20rates%20in%20real%20terms%20for%20male%20farm%20labourers%20in%20rural%20India.JPG">growth of agricultural labourers’</a> <a href="https://im4change.org/upload/files/State%20wise%20growth%20in%20average%20daily%20wage%20rates%20in%20real%20terms%20for%20male%20farm%20labourers%20in%20rural%20India.JPG">wage rates in real terms</a> during the period from 2015-16 to 2020-21 were negative in Haryana <em>(-2.1 percent)</em>, Jammu and Kashmir <em>(-0.3 percent)</em>, Kerala <em>(-1.7 percent)</em>, Punjab <em>(-0.4 percent)</em>, Rajasthan <em>(-1.1 percent)</em>, Tamil Nadu <em>(-0.8 percent)</em>, Tripura <em>(-0.5 percent)</em>, and West Bengal <em>(-0.1 percent)</em>. It should be noted that the <a href="https://im4change.org/upload/files/State-wise%20Average%20Inflation%20CPI%20-%20Inflation.PDF">rate of inflation</a> in <a href="https://im4change.org/upload/files/State-wise%20Average%20Inflation%20CPI%20-%20Inflation.PDF">Consumer Price Index-General</a> has been used to get the average annual growth of agricultural labourers’ wage rates in real terms. Kindly consult table-1. </p>
<p style="text-align:justify">Some states witnessed negative <a href="https://im4change.org/upload/files/State%20wise%20growth%20in%20average%20daily%20wage%20rates%20in%20real%20terms%20for%20male%20farm%20labourers%20in%20rural%20India.JPG">growth in agricultural labourers’</a> <a href="https://im4change.org/upload/files/State%20wise%20growth%20in%20average%20daily%20wage%20rates%20in%20real%20terms%20for%20male%20farm%20labourers%20in%20rural%20India.JPG">wage rates in real terms</a> for more than two years between 2015-16 and 2020-21. For example, <a href="https://im4change.org/upload/files/State%20wise%20growth%20in%20average%20daily%20wage%20rates%20in%20real%20terms%20for%20male%20farm%20labourers%20in%20rural%20India.JPG">Haryana</a> experienced negative growth in 2015-16, 2016-17, 2017-18, 2019-20, and 2020-21. Likewise, <a href="https://im4change.org/upload/files/State%20wise%20growth%20in%20average%20daily%20wage%20rates%20in%20real%20terms%20for%20male%20farm%20labourers%20in%20rural%20India.JPG">Kerala</a> faced negative growth in 2017-18, 2018-19, 2019-20, and 2020-21. </p>
<p style="text-align:justify">At the national level, the <a href="https://im4change.org/upload/files/State%20wise%20growth%20in%20average%20daily%20wage%20rates%20in%20real%20terms%20for%20male%20farm%20labourers%20in%20rural%20India.JPG">agricultural labourers’</a> <a href="https://im4change.org/upload/files/State%20wise%20growth%20in%20average%20daily%20wage%20rates%20in%20real%20terms%20for%20male%20farm%20labourers%20in%20rural%20India.JPG">wage rates in real terms</a> on average grew by 1.0 percent annually during the period from 2015-16 to 2020-21.</p>
<p style="text-align:justify">Please <a href="https://docs.google.com/spreadsheets/d/1avu0-WtaKV2RHXtz2eiP7iS8znGVBdKC/edit?usp=sharing&ouid=112233925171588304692&rtpof=true&sd=true">click here</a> to access the spreadsheet in order to look at the trends in <a href="/upload/files/State%20wise%20average%20daily%20nominal%20wage%20rates%20in%20rural%20india%20men%20farm%20labourers.JPG">nominal wage rates</a>, <a href="/upload/files/State%20wise%20growth%20in%20average%20daily%20nominal%20wage%20rates%20in%20rural%20india%20men%20farm%20labourers.JPG">annual growth in nominal wage rates</a> and <a href="/upload/files/State%20wise%20growth%20in%20average%20daily%20wage%20rates%20in%20real%20terms%20for%20male%20farm%20labourers%20in%20rural%20India.JPG">annual growth in real wage rates</a> for farm labourers in rural areas. </p>
<p style="text-align:justify"><strong>Non-agricultural wages in rural areas</strong></p>
<p style="text-align:justify">The rural economy is not just about farming any longer. That is why we have looked at the wage growth in the non-farm sector too. The highest <a href="https://im4change.org/upload/files/State%20wise%20average%20daily%20nominal%20wage%20rates%20in%20rural%20india%20men%20non%20farm%20labourers.JPG">average daily nominal wage rate for male</a> <a href="https://im4change.org/upload/files/State%20wise%20average%20daily%20nominal%20wage%20rates%20in%20rural%20india%20men%20non%20farm%20labourers.JPG">non-agricultural labourers</a> in rural India during the period from 2014-15 to 2020-21 was detected in Kerala <em>(Rs. 639.01)</em>, followed by Jammu and Kashmir <em>(Rs. 426.37)</em>, Tamil Nadu <em>(Rs. 405.77)</em>, Haryana <em>(Rs. 359.24)</em>, Himachal Pradesh <em>(Rs. 311.10)</em>, and Punjab <em>(Rs. 309.09)</em>. Please see chart-1.</p>
<p style="text-align:justify">The lowest average <a href="https://im4change.org/upload/files/State%20wise%20average%20daily%20nominal%20wage%20rates%20in%20rural%20india%20men%20non%20farm%20labourers.JPG">daily nominal wage rate for male</a> <a href="https://im4change.org/upload/files/State%20wise%20average%20daily%20nominal%20wage%20rates%20in%20rural%20india%20men%20non%20farm%20labourers.JPG">non-agricultural labourers in rural India</a> during the period from 2014-15 to 2020-21 was found in Madhya Pradesh <em>(Rs. 191.47)</em>, followed by Meghalaya <em>(Rs. 210.26)</em>, Gujarat <em>(Rs. 213.51)</em>, Odisha <em>(Rs. 218.06)</em>, Maharashtra <em>(Rs. 226.70)</em>, Tripura <em>(Rs. 230.36)</em>, Bihar <em>(Rs. 243.51)</em>, and Uttar Pradesh <em>(Rs. 243.97)</em>. The related national level figure was Rs. 273.79 during the period from 2014-15 to 2020-21. Please see chart-1.</p>
<p style="text-align:justify">The highest <a href="https://im4change.org/upload/files/State%20wise%20growth%20in%20average%20daily%20nominal%20wage%20rates%20in%20rural%20india%20men%20non%20farm%20labourers.JPG">average annual growth rate in</a> <a href="https://im4change.org/upload/files/State%20wise%20growth%20in%20average%20daily%20nominal%20wage%20rates%20in%20rural%20india%20men%20non%20farm%20labourers.JPG">nominal wage rates</a> during the period from 2015-16 to 2020-21 was noticed in Odisha <em>(8.0 percent)</em>, followed by Madhya Pradesh <em>(7.6 percent)</em>, Assam <em>(6.6 percent)</em>, West Bengal <em>(5.9 percent)</em>, Uttar Pradesh and Andhra Pradesh <em>(5.6 percent each)</em>, and Bihar <em>(5.5 percent)</em>. Kindly consult chart-2.</p>
<p style="text-align:justify">The lowest <a href="https://im4change.org/upload/files/State%20wise%20growth%20in%20average%20daily%20nominal%20wage%20rates%20in%20rural%20india%20men%20non%20farm%20labourers.JPG">average annual growth rate</a> <a href="https://im4change.org/upload/files/State%20wise%20growth%20in%20average%20daily%20nominal%20wage%20rates%20in%20rural%20india%20men%20non%20farm%20labourers.JPG">in nominal wage rates</a> during the same period was observed in Kerala <em>(1.8 percent)</em>, followed by Haryana <em>(2.4 percent)</em>, Meghalaya <em>(2.8 percent)</em>, Tamil Nadu and Rajasthan <em>(3.2 percent each)</em>, Tripura and Jammu and Kashmir <em>(4.0 percent each),</em> and Maharashtra and Punjab <em>(4.2 percent each)</em>. Kindly consult chart-2. </p>
<p style="text-align:justify">The average annual <a href="https://im4change.org/upload/files/State%20wise%20growth%20in%20average%20daily%20wage%20rates%20in%20real%20terms%20for%20male%20non%20farm%20labourers%20in%20rural%20India.JPG">growth of non-agricultural labourers’</a> <a href="https://im4change.org/upload/files/State%20wise%20growth%20in%20average%20daily%20wage%20rates%20in%20real%20terms%20for%20male%20non%20farm%20labourers%20in%20rural%20India.JPG">wage rates in real terms</a> during the period from 2015-16 to 2020-21 were negative in Haryana <em>(-1.9 percent)</em>, Jammu and Kashmir <em>(-1.7 percent)</em>, Kerala <em>(-3.5 percent)</em>, Maharashtra <em>(-0.3 percent)</em>, Meghalaya <em>(-1.2 percent)</em>, Punjab <em>(-0.1 percent)</em>, Rajasthan <em>(-1.2 percent)</em>, Tamil Nadu <em>(-2.1 percent)</em>, and Tripura <em>(-1.1 percent)</em>. It should be noted that the <a href="https://im4change.org/upload/files/State-wise%20Average%20Inflation%20CPI%20-%20Inflation.PDF">rate of inflation</a> in <a href="https://im4change.org/upload/files/State-wise%20Average%20Inflation%20CPI%20-%20Inflation.PDF">CPI-General</a> has been used to get the average annual growth of non-agricultural labourers’ wage rates in real terms. Kindly have a look at table-1. </p>
<p style="text-align:justify">Some states experienced negative growth in <a href="https://im4change.org/upload/files/State%20wise%20growth%20in%20average%20daily%20wage%20rates%20in%20real%20terms%20for%20male%20non%20farm%20labourers%20in%20rural%20India.JPG">non-agricultural labourers’ wage</a> <a href="https://im4change.org/upload/files/State%20wise%20growth%20in%20average%20daily%20wage%20rates%20in%20real%20terms%20for%20male%20non%20farm%20labourers%20in%20rural%20India.JPG">rates in real terms</a> for more than two years between 2015-16 and 2020-21. For example, <a href="https://im4change.org/upload/files/State%20wise%20growth%20in%20average%20daily%20wage%20rates%20in%20real%20terms%20for%20male%20non%20farm%20labourers%20in%20rural%20India.JPG">Haryana</a> experienced negative <a href="https://im4change.org/upload/files/State%20wise%20growth%20in%20average%20daily%20wage%20rates%20in%20real%20terms%20for%20male%20non%20farm%20labourers%20in%20rural%20India.JPG">growth in wage rates</a> <a href="https://im4change.org/upload/files/State%20wise%20growth%20in%20average%20daily%20wage%20rates%20in%20real%20terms%20for%20male%20non%20farm%20labourers%20in%20rural%20India.JPG"><em>(in real terms)</em></a> during 2016-17, 2017-18, 2018-19, 2019-20, and 2020-21. Likewise, <a href="https://im4change.org/upload/files/State%20wise%20growth%20in%20average%20daily%20wage%20rates%20in%20real%20terms%20for%20male%20non%20farm%20labourers%20in%20rural%20India.JPG">Kerala</a> faced negative growth rates in 2015-16, 2016-17, 2017-18, 2019-20, and 2020-21. </p>
<p style="text-align:justify">At the national level, the <a href="https://im4change.org/upload/files/State%20wise%20growth%20in%20average%20daily%20wage%20rates%20in%20real%20terms%20for%20male%20non%20farm%20labourers%20in%20rural%20India.JPG">non-agricultural labourers’</a> <a href="https://im4change.org/upload/files/State%20wise%20growth%20in%20average%20daily%20wage%20rates%20in%20real%20terms%20for%20male%20non%20farm%20labourers%20in%20rural%20India.JPG">wage rates in real terms</a> on average grew by just 0.3 percent annually during the period from 2015-16 to 2020-21. </p>
<p style="text-align:justify">Please <a href="https://docs.google.com/spreadsheets/d/1avu0-WtaKV2RHXtz2eiP7iS8znGVBdKC/edit?usp=sharing&ouid=112233925171588304692&rtpof=true&sd=true">click here</a> to access the spreadsheet in order to look at the <a href="/upload/files/State%20wise%20average%20daily%20nominal%20wage%20rates%20in%20rural%20india%20men%20non%20farm%20labourers.JPG">trends in nominal wage rates</a>, <a href="/upload/files/State%20wise%20growth%20in%20average%20daily%20nominal%20wage%20rates%20in%20rural%20india%20men%20non%20farm%20labourers.JPG">annual growth in nominal wage rates</a>, and <a href="/upload/files/State%20wise%20growth%20in%20average%20daily%20wage%20rates%20in%20real%20terms%20for%20male%20non%20farm%20labourers%20in%20rural%20India.JPG">annual growth in real wage rates</a> for non-farm labourers in rural areas. </p>
<p style="text-align:justify"><strong>Construction sector wages in rural areas</strong></p>
<p style="text-align:justify">The <a href="https://im4change.org/upload/files/State%20wise%20average%20daily%20nominal%20wage%20rates%20in%20rural%20india%20men%20construction%20workers.JPG">highest average daily nominal wage rates</a> <a href="https://im4change.org/upload/files/State%20wise%20average%20daily%20nominal%20wage%20rates%20in%20rural%20india%20men%20construction%20workers.JPG">for male construction workers in rural India</a> during the period from 2014-15 to 2020-21 was detected in Kerala <em>(Rs. 810.3)</em>, followed by Jammu and Kashmir <em>(Rs. 445.1)</em>, Tamil Nadu <em>(Rs. 424.1)</em>, Haryana <em>(Rs. 379.9)</em>, Himachal Pradesh <em>(Rs. 368.7)</em>, Rajasthan <em>(Rs. 347.7)</em>, and Punjab <em>(Rs. 339.1)</em>. Kindly see chart-1. </p>
<p style="text-align:justify">The <a href="https://im4change.org/upload/files/State%20wise%20average%20daily%20nominal%20wage%20rates%20in%20rural%20india%20men%20construction%20workers.JPG">lowest average daily nominal wage rates</a> <a href="https://im4change.org/upload/files/State%20wise%20average%20daily%20nominal%20wage%20rates%20in%20rural%20india%20men%20construction%20workers.JPG">for male construction workers in rural areas</a> during the period from 2014-15 to 2020-21 was found in Madhya Pradesh <em>(Rs. 212.4)</em>, followed by Tripura <em>(Rs. 230.4)</em>, Meghalaya <em>(Rs. 231.7)</em>, Odisha <em>(Rs. 247.1)</em>, Gujarat <em>(Rs. 251.8)</em>, Uttar Pradesh <em>(Rs. 267.4)</em>, Bihar <em>(Rs. 270.8)</em>, and West Bengal <em>(Rs. 274.0)</em>. The related national level figure was Rs. 316.9 during the period from 2014-15 to 2020-21. Kindly consult chart-1.</p>
<p style="text-align:justify">The <a href="https://im4change.org/upload/files/State%20wise%20growth%20in%20average%20daily%20nominal%20wage%20rates%20in%20rural%20india%20men%20construction%20workers.JPG">highest average annual growth rates in</a> <a href="https://im4change.org/upload/files/State%20wise%20growth%20in%20average%20daily%20nominal%20wage%20rates%20in%20rural%20india%20men%20construction%20workers.JPG">nominal wage rates</a> during the period from 2015-16 to 2020-21 was noticed in Meghalaya <em>(20.9 percent)</em>, followed by Madhya Pradesh <em>(7.4 percent)</em>, Odisha and Andhra Pradesh <em>(6.8 percent each)</em>, Uttar Pradesh <em>(6.4 percent)</em>, and Bihar <em>(6.2 percent)</em>. Please see chart-2. </p>
<p style="text-align:justify">The <a href="https://im4change.org/upload/files/State%20wise%20growth%20in%20average%20daily%20nominal%20wage%20rates%20in%20rural%20india%20men%20construction%20workers.JPG">lowest average annual growth rates in</a> <a href="https://im4change.org/upload/files/State%20wise%20growth%20in%20average%20daily%20nominal%20wage%20rates%20in%20rural%20india%20men%20construction%20workers.JPG">nominal wage rates</a> during the same period was observed in Kerala <em>(0.9 percent)</em>, followed by Manipur <em>(2.0 percent)</em>, Haryana <em>(2.1 percent)</em>, Jammu and Kashmir <em>(3.0 percent)</em>, Rajasthan <em>(3.2 percent)</em>, and Gujarat <em>(3.6 percent)</em>. Please see chart-2.</p>
<p style="text-align:justify">The <a href="https://im4change.org/upload/files/State%20wise%20growth%20in%20average%20daily%20wage%20rates%20in%20real%20terms%20for%20male%20construction%20workers%20in%20rural%20India%281%29.JPG">average annual growth of construction workers’</a> <a href="https://im4change.org/upload/files/State%20wise%20growth%20in%20average%20daily%20wage%20rates%20in%20real%20terms%20for%20male%20construction%20workers%20in%20rural%20India%281%29.JPG">wage rates in real terms</a> during the period from 2015-16 to 2020-21 was negative in Assam <em>(-1.2 percent)</em>, Haryana <em>(-2.1 percent)</em>, Jammu and Kashmir <em>(-2.7 percent)</em>, Karnataka <em>(-0.6 percent)</em>, Kerala <em>(-4.4 percent)</em>, Manipur <em>(-6.3 percent)</em>, Rajasthan <em>(-1.2 percent)</em>, Tamil Nadu <em>(-0.9 percent)</em>, and Tripura <em>(-1.1 percent)</em>. Please note that the <a href="https://im4change.org/upload/files/State-wise%20Average%20Inflation%20CPI%20-%20Inflation.PDF">rate of inflation</a> in <a href="https://im4change.org/upload/files/State-wise%20Average%20Inflation%20CPI%20-%20Inflation.PDF">CPI-General</a> has been used to get the average annual growth of construction workers’ wage rates in real terms. Kindly have a look at table-1. </p>
<p style="text-align:justify">In the case of Meghalaya, the <a href="https://im4change.org/upload/files/State%20wise%20average%20daily%20nominal%20wage%20rates%20in%20rural%20india%20men%20construction%20workers.JPG">nominal daily wage rate of male construction</a> <a href="https://im4change.org/upload/files/State%20wise%20average%20daily%20nominal%20wage%20rates%20in%20rural%20india%20men%20construction%20workers.JPG">workers</a> fell from Rs. 186.0 in 2016-17 to Rs. 100.0 in 2017-18 i.e., a decline by -46.2 percent over previous year. However, the same bounced back to Rs. 273.2 in 2018-19 i.e., an increase by 173.2 percent over previous year. In <a href="https://im4change.org/upload/files/State%20wise%20growth%20in%20average%20daily%20wage%20rates%20in%20real%20terms%20for%20male%20construction%20workers%20in%20rural%20India%281%29.JPG">real terms, the construction sector</a> <a href="https://im4change.org/upload/files/State%20wise%20growth%20in%20average%20daily%20wage%20rates%20in%20real%20terms%20for%20male%20construction%20workers%20in%20rural%20India%281%29.JPG">wage rate in Meghalaya</a> grew by -47.7 percent in 2017-18 <em>(over previous year)</em> and 171.0 percent in 2018-19 <em>(over previous year)</em>.</p>
<p style="text-align:justify">Some states experienced negative <a href="https://im4change.org/upload/files/State%20wise%20growth%20in%20average%20daily%20wage%20rates%20in%20real%20terms%20for%20male%20construction%20workers%20in%20rural%20India%281%29.JPG">growth in construction workers’</a> <a href="https://im4change.org/upload/files/State%20wise%20growth%20in%20average%20daily%20wage%20rates%20in%20real%20terms%20for%20male%20construction%20workers%20in%20rural%20India%281%29.JPG">wage rates in real terms</a> for more than two years between 2015-16 and 2020-21. For example, <a href="https://im4change.org/upload/files/State%20wise%20growth%20in%20average%20daily%20wage%20rates%20in%20real%20terms%20for%20male%20construction%20workers%20in%20rural%20India%281%29.JPG">Assam</a> experienced negative growth in wage rates <em>(in real terms)</em> during 2017-18, 2018-19, 2019-20, and 2020-21. </p>
<p style="text-align:justify">At the national level, the <a href="https://im4change.org/upload/files/State%20wise%20growth%20in%20average%20daily%20wage%20rates%20in%20real%20terms%20for%20male%20construction%20workers%20in%20rural%20India%281%29.JPG">construction workers’ wage rates in real terms</a> on average grew by just 0.1 percent annually during the period from 2015-16 to 2020-21.</p>
<p style="text-align:justify">Kindly <a href="https://docs.google.com/spreadsheets/d/1avu0-WtaKV2RHXtz2eiP7iS8znGVBdKC/edit?usp=sharing&ouid=112233925171588304692&rtpof=true&sd=true">click here</a> to access the spreadsheet in order to look at the <a href="/upload/files/State%20wise%20average%20daily%20nominal%20wage%20rates%20in%20rural%20india%20men%20construction%20workers.JPG">trends in nominal wage rates</a>, <a href="/upload/files/State%20wise%20growth%20in%20average%20daily%20nominal%20wage%20rates%20in%20rural%20india%20men%20construction%20workers.JPG">annual growth in nominal wage rates</a>, and <a href="/upload/files/State%20wise%20growth%20in%20average%20daily%20wage%20rates%20in%20real%20terms%20for%20male%20construction%20workers%20in%20rural%20India%281%29.JPG">annual growth in real wage rates</a> for construction workers in rural areas. </p>
<p style="text-align:justify"><strong>Data collection methodology</strong></p>
<p style="text-align:justify">As a part of Rural Labour Enquiry, the <a href="https://im4change.org/upload/files/ilj_feb_2013.pdf">daily wage rates</a> in respect of eighteen agricultural and non-agricultural occupations are being collected along with rural retail price data by the Field Operations Division of the National Sample Survey Organisation since 1986-87, according to a February 2013 <a href="https://im4change.org/upload/files/ilj_feb_2013.pdf">edition of the Indian Labour Journal</a>. On the recommendations of the Governing Council of the National Sample Survey Organisation in its 61st meeting, the <a href="https://im4change.org/upload/files/ilj_feb_2013.pdf">Labour Bureau</a> started the compilation and analysis of wage rate data with effect from April, 1998. </p>
<p style="text-align:justify">The Field Operations Division of the National Sample Survey Organisation has been entrusted with the work of <a href="https://im4change.org/upload/files/METHOLOGY%20FOR%20COMPILATION%20OF%20THE%20WAGE%20RATE%20DATA.pdf">data collection</a>. The <a href="https://im4change.org/upload/files/METHOLOGY%20FOR%20COMPILATION%20OF%20THE%20WAGE%20RATE%20DATA.pdf">wage rate data</a> are being collected along with rural retail prices from 600 sample villages spread over 66 NSS regions of 20 States by canvassing Block-5 <em>(Annexure-I)</em> of Schedule 3.01(R). The data collection from these sample villages is staggered over the four weeks of a month with one-fourth of them being covered every week. The days of canvassing of Schedule 3.01(R) are fixed. The village functionaries like the Panchayat Secretary, Progress Assistant, Patwari and other Village or Block Officials are the primary informants for collection of data on wage rates. The data on normal working hours and the prevailing wage rates in cash and kind for the reported working hours are collected sex-wise for each of the 18 selected occupations in 20 states, indicates an old <a href="https://im4change.org/upload/files/METHOLOGY%20FOR%20COMPILATION%20OF%20THE%20WAGE%20RATE%20DATA.pdf">document</a> of the Labour Bureau. </p>
<p style="text-align:justify">The wage rates are sometimes reported for a duration that is less/more than the normal working hours. In such cases, they are <a href="https://im4change.org/upload/files/METHOLOGY%20FOR%20COMPILATION%20OF%20THE%20WAGE%20RATE%20DATA.pdf">first normalised for eight hours</a> working day. As regards the mode of payment of wages, it is made in both ways i.e., in cash and/or in kind. The payments made in kind are very common in rural areas, which include foodgrains, cooked food, tea, fuel, cigarette, beedi, fodder, etc. The wages reported in kind are evaluated at local retail prices. Thereafter, the data is thoroughly scrutinised and discrepant points are referred back to the field for clarification. In the next stage, the simple arithmetic average of these normalised daily wage rates is worked out occupation-wise and sex-wise for each state.</p>
<p style="text-align:justify"><a href="http://ras.org.in/methodology_of_data_collection_unsuited_to_changing_rural_reality">Up to June 2000</a>, the average wage rates at the national level were derived by taking the simple average of state figures; since July 2000, the averages have been obtained by dividing the sum total of wages of all 20 states by the number of centres or villages from which data were collected. The state-wise averages are restricted only to those occupations where the number of centres is five or more to avoid abnormal fluctuations and inconsistency in wages paid to different categories of workers on account of varying numbers of centres. However, in order to calculate the all-India averages, all neglected centres are taken into account to arrive at the total number of centres at the national level.</p>
<p style="text-align:justify">The <a href="/upload/files/RBI%20note%20Average%20Daily%20Wage%20rate%20Methodology.pdf">Reserve Bank of India</a> <em>(whose data we have used in writing this news alert)</em> has collated and is releasing monthly time series data on rural wage rates based on the data published by the Labour Bureau, Government of India. Starting from November 2013 the Labour Bureau is collecting the rural wage data in respect of 12 agricultural and 13 non-agricultural occupations across 20 major states, namely, Andhra Pradesh, Assam, Bihar, Gujarat, Haryana, Himachal Pradesh, Jammu & Kashmir, Karnataka, Kerala, Madhya Pradesh, Maharashtra, Manipur, Meghalaya, Orissa, Punjab, Rajasthan, Tamil Nadu, Tripura, Uttar Pradesh and West Bengal. The occupations for which the daily wage rates are collected every month are: <u>(A) Agricultural occupations</u> – (1) Ploughing/ Tilling workers, (2) Sowing <em>(including planting/ Transplanting/ Weeding)</em> workers, (3) Harvesting/ Winnowing/ Threshing workers, (4) Picking workers <em>(including Tea, Cotton, Tobacco and other commercial crops)</em>, (5) Horticulture workers <em>(including nursery growers)</em>, (6) Fishermen-inland, (7) Fishermen coastal/deep-sea, (8) Loggers and wood cutters, (9) Animal husbandry workers <em>(including poultry workers, dairy workers and herdsman)</em>, (10) Packaging labourers, agriculture, (11) General agricultural labourers <em>(including watering/ irrigation workers, etc.)</em>, (12) Plant protection workers <em>(applying pesticides, treating seeds, etc.)</em>; and <u>(B) Non-agricultural occupations</u> – (13) Carpenter, (14) Blacksmith, (15) Mason, (16) Weavers, (17) Beedi makers, (18) Bamboo, cane basket weavers, (19) Handicraft workers, (20) Plumbers, (21) Electrician, (22) Construction workers <em>(for roads, dams, industrial & project construction work and Well diggers)</em>, (23) LMV & Tractor drivers, (24) Non-agricultural labourers <em>(including porters, loaders)</em>, and (25) Sweeping/cleaning workers. </p>
<p style="text-align:justify"><strong><em>References </em></strong></p>
<p style="text-align:justify">Handbook of Statistics on Indian States 2020-21, released in November 2021, please <a href="https://m.rbi.org.in/scripts/AnnualPublications.aspx?head=Handbook%20of%20Statistics%20on%20Indian%20States">click here</a> to access</p>
<p style="text-align:justify">State-wise Average Daily Wage Rates in Rural India (Men - General Agricultural Labourers), RBI Handbook of Statistics on Indian States 2020-21, released in November 2021, please <a href="/upload/files/State-wise%20Average%20Daily%20Wage%20Rates%20in%20Rural%20India%20Men%20-%20General%20Agricultural%20Labourers.PDF">click here</a> to access </p>
<p style="text-align:justify">State-wise Average Daily Wage Rates in Rural India (Men - Non-Agricultural Labourers), RBI Handbook of Statistics on Indian States 2020-21, released in November 2021, please <a href="/upload/files/State-wise%20Average%20Daily%20Wage%20Rates%20in%20Rural%20India%20Men%20-%20Non%20Agricultural%20Labourers.PDF">click here</a> to access </p>
<p style="text-align:justify">State-wise Average Daily Wage Rates in Rural India (Men - Construction Workers), RBI Handbook of Statistics on Indian States 2020-21, released in November 2021, please <a href="/upload/files/State-wise%20Average%20Daily%20Wage%20Rates%20in%20Rural%20India%20Men%20-%20Construction%20Workers.PDF">click here</a> to access </p>
<p style="text-align:justify">State-wise Average Inflation (CPI) - Inflation, RBI Handbook of Statistics on Indian States 2020-21, released in November 2021, please <a href="/upload/files/State-wise%20Average%20Inflation%20CPI%20-%20Inflation.PDF">click here</a> to access </p>
<p style="text-align:justify">Indian Labour Journal, February 2013, please <a href="/upload/files/ilj_feb_2013.pdf">click here</a> to access </p>
<p style="text-align:justify">Wage Rates in Rural India 2003-04: Methodology for Compilation of the Wage Rate Data, Labour Bureau, please <a href="/upload/files/METHOLOGY%20FOR%20COMPILATION%20OF%20THE%20WAGE%20RATE%20DATA.pdf">click here</a> to access </p>
<p style="text-align:justify">Average Daily Wage Rates in Rural India: Methodology and coverage (From November 2013), Reserve Bank of India, please <a href="https://dbie.rbi.org.in">click here</a> and <a href="/upload/files/RBI%20note%20Average%20Daily%20Wage%20rate%20Methodology%281%29.pdf">here</a> to access </p>
<p style="text-align:justify">Consumer Price Index Numbers on Base 2012=100 for Rural, Urban and Combined for the month of January 2022, Ministry of Statistics and Programme Implementation (MoSPI), National Statistical Office (NSO), released on 14th February 2022, please <a href="/upload/files/CPI%20Press%20Release%20January%202022%281%29.pdf">click here</a> to access </p>
<p style="text-align:justify">Methodology of Data Collection Unsuited to Changing Rural Reality: A Study of Agricultural Wage Data in India -Yoshifumi Usami, Arindam Das, and Madhura Swaminathan, Review of Agrarian Studies, Vol. 10, No. 2, July-December, 2020, please <a href="http://ras.org.in/methodology_of_data_collection_unsuited_to_changing_rural_reality">click here</a> to access</p>
<p>Russia-ukraine crisis to push up fertiliser prices, govt subsidies, IANS/ Business Standard, 4 March, 2022, please <a href="https://www.business-standard.com/article/economy-policy/russia-ukraine-crisis-to-push-up-fertiliser-prices-govt-subsidies-122030400560_1.html">click here</a> to access </p>
<p>Cooking oil prices spike in India due to Russia-ukraine crisis -B Krishna Mohan, TelanganaToday.com, 3 March, 2022, please <a href="https://telanganatoday.com/cooking-oil-prices-spike-in-india-due-to-russia-ukraine-crisis">click here</a> to access </p>
<p>Govt reviews cooking oil imports as ukraine crisis disrupts supplies, prices shoot up -Amiti Sen and Prabhudutta Mishra, The Hindu Business Line, 4 March, 2022, please <a href="https://www.thehindubusinessline.com/markets/commodities/govt-reviews-cooking-oil-imports-as-ukraine-crisis-disrupts-supplies-prices-shoot-up/article65190879.ece">click here</a> to access </p>
<p>India's Economy Faces A Potential Stagflation Risk From Ukraine War -Sunil Prabhu, NDTV.com, 1 March, 2022, please <a href="https://www.ndtv.com/business/indias-economy-faces-a-potential-stagflation-risk-from-ukraine-war-2796624">click here</a> to access</p>
<p>India to be one of Asia’s ‘biggest losers’ from the Ukraine war as Russia slammed by global sanctions -Paran Balakrishnan, The Telegraph, 1 March, 2022, please <a href="https://www.telegraphindia.com/business/russia-ukraine-crisis-india-to-be-one-of-asias-biggest-losers-from-the-ukraine-war-as-russia-slammed-by-global-sanctions/cid/1854032">click here</a> to access</p>
<p>Crude Oil Prices Rise, Tracking Russia-Ukraine Conflict -Rahul Karunakar, NDTV.com <em>(with inputs from Agencies)</em>, 1 March, 2022, please <a href="https://www.ndtv.com/business/crude-oil-prices-rise-on-tuesday-tracking-russia-ukraine-conflict-2796187">click here</a> to access</p>
<p>Cooking Oil May Become Costlier Due to Russia-ukraine War. Know Why, News18.com, 27 February, 2022, please <a href="https://www.news18.com/news/business/markets/cooking-oil-may-become-costlier-due-to-russia-ukraine-war-know-why-4812740.html">click here</a> to access </p>
<p style="text-align:justify"><strong>Image Courtesy: Inclusive Media for Change/ Shambhu Ghatak</strong></p>
',
'credit_writer' => '',
'article_img' => 'Image construction worker 11 Mar 2022.jpg',
'article_img_thumb' => 'Image construction worker 11 Mar 2022.jpg',
'status' => (int) 1,
'show_on_home' => (int) 1,
'lang' => 'EN',
'category_id' => (int) 4,
'tag_keyword' => '',
'seo_url' => 'real-wage-rates-of-the-rural-workers-hardly-increased-during-the-past-6-years',
'meta_title' => '',
'meta_keywords' => '',
'meta_description' => '',
'noindex' => (int) 1,
'publish_date' => object(Cake\I18n\FrozenDate) {},
'most_visit_section_id' => null,
'article_big_img' => null,
'liveid' => null,
'created' => object(Cake\I18n\FrozenTime) {},
'modified' => object(Cake\I18n\FrozenTime) {},
'edate' => '',
'tags' => [
[maximum depth reached]
],
'category' => object(App\Model\Entity\Category) {},
'[new]' => false,
'[accessible]' => [
[maximum depth reached]
],
'[dirty]' => [[maximum depth reached]],
'[original]' => [[maximum depth reached]],
'[virtual]' => [[maximum depth reached]],
'[hasErrors]' => false,
'[errors]' => [[maximum depth reached]],
'[invalid]' => [[maximum depth reached]],
'[repository]' => 'Articles'
},
'articleid' => (int) 62349,
'metaTitle' => 'NEWS ALERTS | Real wage rates of the rural workers hardly increased during the last 6 years',
'metaKeywords' => 'Construction Workers,Consumer Price Index,CPI Rural,CPI Urban,Farm Labourers,Farm Workers,Food Inflation,Food Prices,Fuel Inflation,Fuel Prices,Nominal Wage Rate,Non-Farm Labourers,Non-Farm Workers,Real Wage Growth,Real Wages,Retail Inflation,Rural Workers',
'metaDesc' => 'In the absence of income or expenditure-based headcount ratio, the growth in the real wages (i.e., nominal wages adjusted against retail inflation) of the manual workers is considered to be a good proxy to assess the trends in poverty. This...',
'disp' => '<p style="text-align:justify">In the absence of income or expenditure-based headcount ratio, the growth in the real wages <em>(i.e., nominal wages adjusted against retail inflation)</em> of the manual workers is considered to be a good proxy to assess the trends in poverty. This is because the manual, unskilled/ semi-skilled labourers exist at the bottom of the pyramid or economic hierarchy, and most of them belong to the social categories Scheduled Castes (SCs) and Scheduled Tribes (STs). A positive growth in their real wages <em>(or real wage rates) </em>is anticipated to improve their purchasing power <em>(i.e., income or consumption expenditure)</em> and lift them out of the poverty trap. </p><p style="text-align:justify">Clearly, there exists inter-state differences in nominal wage rates, growth in nominal wage rates and growth in real wage rates, which we will see in this news alert. </p><p style="text-align:justify">Against the backdrop of the <a href="https://www.thehindubusinessline.com/markets/commodities/govt-reviews-cooking-oil-imports-as-ukraine-crisis-disrupts-supplies-prices-shoot-up/article65190879.ece" title="https://www.thehindubusinessline.com/markets/commodities/govt-reviews-cooking-oil-imports-as-ukraine-crisis-disrupts-supplies-prices-shoot-up/article65190879.ece">Russia-Ukraine conflict</a>, which is anticipated to cause both <a href="https://www.ndtv.com/business/indias-economy-faces-a-potential-stagflation-risk-from-ukraine-war-2796624" title="https://www.ndtv.com/business/indias-economy-faces-a-potential-stagflation-risk-from-ukraine-war-2796624">food and fuel retail inflation</a> in India in the coming times, it is even more important to look at the past trends in wage rate growth of the rural workers. It should be noted that the <a href="https://public.flourish.studio/visualisation/8706137" title="https://public.flourish.studio/visualisation/8706137">year-on-year inflation</a> in <a href="https://public.flourish.studio/visualisation/8706137" title="https://public.flourish.studio/visualisation/8706137">Consumer</a> <a href="https://public.flourish.studio/visualisation/8706137" title="https://public.flourish.studio/visualisation/8706137">Price Index Rural</a> exceeded the <a href="https://public.flourish.studio/visualisation/8706137" title="https://public.flourish.studio/visualisation/8706137">year-on-year inflation</a> in <a href="https://public.flourish.studio/visualisation/8706137" title="https://public.flourish.studio/visualisation/8706137">CPI Urban</a> during January 2022 at the national level. Even before the beginning of Russia-Ukraine conflict <em>(i.e., during January 2022)</em>, in rural areas, <a href="https://im4change.org/upload/files/CPI%20Press%20Release%20January%202022%281%29.pdf" title="https://im4change.org/upload/files/CPI%20Press%20Release%20January%202022%281%29.pdf">retail inflation rate of 20.6 percent</a> was noticed for 'oils and fats', aside from <a href="https://im4change.org/upload/files/CPI%20Press%20Release%20January%202022%281%29.pdf" title="https://im4change.org/upload/files/CPI%20Press%20Release%20January%202022%281%29.pdf">8.44 percent retail inflation for 'fuel and light'</a>, <a href="https://im4change.org/upload/files/CPI%20Press%20Release%20January%202022%281%29.pdf" title="https://im4change.org/upload/files/CPI%20Press%20Release%20January%202022%281%29.pdf">8.27 percent</a> for 'transport and communication', and <a href="https://im4change.org/upload/files/CPI%20Press%20Release%20January%202022%281%29.pdf" title="https://im4change.org/upload/files/CPI%20Press%20Release%20January%202022%281%29.pdf">9.65 percent for 'clothing and footwear'</a>. </p><p style="text-align:justify">At the national level, the average daily nominal wage rate for male construction workers in rural areas during the period from 2014-15 to 2020-21 was Rs. 316.9, which was greater than that of the male non-farm workers in rural areas. The average daily nominal wage rate for male non-agricultural labourers in rural areas during the period from 2014-15 to 2020-21 was Rs. 273.8, which exceeded the average daily nominal wage rates for male farm labourers in rural areas <em>(i.e., Rs. 265.1)</em>. However, in Andhra Pradesh, Haryana, Himachal Pradesh, Jammu and Kashmir, Karnataka, Kerala, Meghalaya, Punjab, and Tripura, the average daily nominal wage rates for male agricultural labourers in rural areas during the period from 2014-15 to 2020-21 exceeded the average daily nominal wage rates for male non-farm labourers in rural areas. Please see chart-1.</p><p style="text-align:justify"><img alt="" src="/upload/images/Chart%201.png" style="height:670px; width:1000px" /></p><p style="text-align:justify"><em><strong>Notes:</strong> The average (i.e., arithmetic mean) daily nominal wage rates for various categories of workers in rural India in the period from 2014-15 to 2020-21 has been calculated by the Inclusive Media for Change staff</em></p><p style="text-align:justify"><em>Please <a href="https://docs.google.com/spreadsheets/d/1avu0-WtaKV2RHXtz2eiP7iS8znGVBdKC/edit?usp=sharing&ouid=112233925171588304692&rtpof=true&sd=true" title="https://docs.google.com/spreadsheets/d/1avu0-WtaKV2RHXtz2eiP7iS8znGVBdKC/edit?usp=sharing&ouid=112233925171588304692&rtpof=true&sd=true">click here</a> to access the data in spreadsheet format</em></p><p style="text-align:justify"><em><strong>Source: </strong>Handbook of Statistics on Indian States 2020-21, released in November 2021, please <a href="https://m.rbi.org.in/scripts/AnnualPublications.aspx?head=Handbook%20of%20Statistics%20on%20Indian%20States" title="https://m.rbi.org.in/scripts/AnnualPublications.aspx?head=Handbook%20of%20Statistics%20on%20Indian%20States">click here</a> to access</em></p><p style="text-align:justify"><em>State-wise Average Daily Wage Rates in Rural India (Men - General Agricultural Labourers), RBI Handbook of Statistics on Indian States 2020-21, released in November 2021, please <a href="/upload/files/State-wise%20Average%20Daily%20Wage%20Rates%20in%20Rural%20India%20Men%20-%20General%20Agricultural%20Labourers.PDF" title="/upload/files/State-wise%20Average%20Daily%20Wage%20Rates%20in%20Rural%20India%20Men%20-%20General%20Agricultural%20Labourers.PDF">click here</a> to access </em></p><p style="text-align:justify"><em>State-wise Average Daily Wage Rates in Rural India (Men - Non-Agricultural Labourers), RBI Handbook of Statistics on Indian States 2020-21, released in November 2021, please <a href="/upload/files/State-wise%20Average%20Daily%20Wage%20Rates%20in%20Rural%20India%20Men%20-%20Non%20Agricultural%20Labourers.PDF" title="/upload/files/State-wise%20Average%20Daily%20Wage%20Rates%20in%20Rural%20India%20Men%20-%20Non%20Agricultural%20Labourers.PDF">click here</a> to access </em></p><p style="text-align:justify"><em>State-wise Average Daily Wage Rates in Rural India (Men - Construction Workers), RBI Handbook of Statistics on Indian States 2020-21, released in November 2021, please <a href="/upload/files/State-wise%20Average%20Daily%20Wage%20Rates%20in%20Rural%20India%20Men%20-%20Construction%20Workers.PDF" title="/upload/files/State-wise%20Average%20Daily%20Wage%20Rates%20in%20Rural%20India%20Men%20-%20Construction%20Workers.PDF">click here</a> to access </em></p><p style="text-align:justify"><em>State-wise Average Inflation (CPI) - Inflation, RBI Handbook of Statistics on Indian States 2020-21, released in November 2021, please <a href="/upload/files/State-wise%20Average%20Inflation%20CPI%20-%20Inflation.PDF" title="/upload/files/State-wise%20Average%20Inflation%20CPI%20-%20Inflation.PDF">click here</a> to access </em></p><p style="text-align:justify"><strong>---</strong></p><p style="text-align:justify">At the national level, the agricultural nominal wage rate grew faster than the non-farm wage rate on average for male labourers in rural areas during the period from 2015-16 to 2020-21. However, in states like Assam, Bihar, Haryana, Madhya Pradesh, Odisha, Punjab, and West Bengal, the non-farm nominal wage rates grew faster than the farm wage rates on average for male workers in rural areas during the period from 2015-16 to 2020-21. Please see chart-2. </p><p style="text-align:justify"><img alt="" src="/upload/images/Chart%202.png" style="height:653px; width:1000px" /></p><p style="text-align:justify"><em><strong>Notes: </strong>The average growth in daily nominal wage rates for various categories of workers in rural India in the period from 2015-16 to 2020-21 has been calculated by the Inclusive Media for Change staff</em></p><p style="text-align:justify"><em>Please <a href="https://docs.google.com/spreadsheets/d/1avu0-WtaKV2RHXtz2eiP7iS8znGVBdKC/edit?usp=sharing&ouid=112233925171588304692&rtpof=true&sd=true" title="https://docs.google.com/spreadsheets/d/1avu0-WtaKV2RHXtz2eiP7iS8znGVBdKC/edit?usp=sharing&ouid=112233925171588304692&rtpof=true&sd=true">click here</a> to access the data in spreadsheet format</em></p><p style="text-align:justify"><em><strong>Source: </strong>Same as above</em><br /><strong>---</strong></p><p style="text-align:justify">At the national level, the construction sector nominal wage rate grew slower than the non-agricultural wage rate on average for male labourers in rural areas during the period from 2015-16 to 2020-21. However, in states like Andhra Pradesh, Bihar, Himachal Pradesh, Maharashtra, Meghalaya, Punjab, Tamil Nadu, and Uttar Pradesh, the construction sector nominal wage rates grew faster than the non-farm wage rates on average for male workers in rural areas during the period from 2015-16 to 2020-21. Please take a look at chart-2. </p><p style="text-align:justify">At the national level, the agricultural wage rate in real terms grew faster than the non-farm wage rate on average for male labourers in rural areas during the period from 2015-16 to 2020-21. However, in states like Assam, Bihar, Haryana, Madhya Pradesh, Odisha, Punjab, and West Bengal, the non-farm wage rates in real terms grew faster than the farm wage rates on average for male workers in rural areas during the period from 2015-16 to 2020-21. Please see table-1.</p><p style="text-align:justify"><strong>Table 1: State-wise Growth in Average Daily Wage Rates in Real terms for Male Agricultural Labourers, Male Non-Agricultural Labourers, and Male Construction Workers in Rural India, in %</strong><br /><img alt="" src="/upload/images/Table%201%20State-wise%20Growth%20in%20Average%20Daily%20Wage%20Rates%20in%20Real%20terms%20for%20Male%20Agricultural%20Labourers%20Male%20Non-Agricultural%20Labourers%20and%20Male%20Construction%20Workers%20in%20Rural%20India%20in%20percent.png" style="height:539px; width:750px" /></p><p style="text-align:justify"><em><strong>Notes: </strong>The average growth in daily wage rates in real terms for various categories of workers in rural India in the period from 2015-16 to 2020-21 has been calculated by the Inclusive Media for Change staff</em></p><p style="text-align:justify"><em>Please <a href="https://docs.google.com/spreadsheets/d/1avu0-WtaKV2RHXtz2eiP7iS8znGVBdKC/edit?usp=sharing&ouid=112233925171588304692&rtpof=true&sd=true" title="https://docs.google.com/spreadsheets/d/1avu0-WtaKV2RHXtz2eiP7iS8znGVBdKC/edit?usp=sharing&ouid=112233925171588304692&rtpof=true&sd=true">click here</a> to access the data in spreadsheet format</em></p><p style="text-align:justify"><em><strong>Source: </strong>Same as above</em><br /><strong>---</strong></p><p style="text-align:justify">At the national level, the construction sector wage rate in real terms grew slower than the non-agricultural wage rate on average for male labourers in rural areas during the period from 2015-16 to 2020-21. However, in states like Andhra Pradesh, Bihar, Himachal Pradesh, Maharashtra, Meghalaya, Punjab, Tamil Nadu, and Uttar Pradesh, the construction sector wage rates in real terms grew faster than the non-farm wage rates on average for male workers in rural areas during the period from 2015-16 to 2020-21. Please take a look at table-1. </p><p style="text-align:justify">In the following paragraphs, we have discussed the trends in agricultural wage rates, non-farm wage rates, and construction sector wage rates <em>(in rural areas)</em> in detail. </p><p style="text-align:justify"><strong>Agricultural wages in rural areas</strong></p><p style="text-align:justify">The highest <a href="https://im4change.org/upload/files/State%20wise%20average%20daily%20nominal%20wage%20rates%20in%20rural%20india%20men%20farm%20labourers.JPG" title="https://im4change.org/upload/files/State%20wise%20average%20daily%20nominal%20wage%20rates%20in%20rural%20india%20men%20farm%20labourers.JPG">average daily nominal wage rate</a> <a href="https://im4change.org/upload/files/State%20wise%20average%20daily%20nominal%20wage%20rates%20in%20rural%20india%20men%20farm%20labourers.JPG" title="https://im4change.org/upload/files/State%20wise%20average%20daily%20nominal%20wage%20rates%20in%20rural%20india%20men%20farm%20labourers.JPG">for male agricultural labourers</a> in rural India during the period from 2014-15 to 2020-21 was found in Kerala <em>(Rs. 653.93)</em>, followed by Jammu and Kashmir <em>(Rs. 429.19)</em>, Tamil Nadu <em>(Rs. 385.6)</em>, Haryana <em>(Rs. 368.53)</em>, Himachal Pradesh <em>(Rs. 366.23)</em>, and Punjab <em>(Rs. 325.31)</em>. Please have a look at chart-1.</p><p style="text-align:justify">The lowest <a href="https://im4change.org/upload/files/State%20wise%20average%20daily%20nominal%20wage%20rates%20in%20rural%20india%20men%20farm%20labourers.JPG" title="https://im4change.org/upload/files/State%20wise%20average%20daily%20nominal%20wage%20rates%20in%20rural%20india%20men%20farm%20labourers.JPG">average daily nominal wage rate</a> <a href="https://im4change.org/upload/files/State%20wise%20average%20daily%20nominal%20wage%20rates%20in%20rural%20india%20men%20farm%20labourers.JPG" title="https://im4change.org/upload/files/State%20wise%20average%20daily%20nominal%20wage%20rates%20in%20rural%20india%20men%20farm%20labourers.JPG">for male agricultural labourers</a> in rural India during the period from 2014-15 to 2020-21 was observed in Madhya Pradesh <em>(Rs. 183.97)</em>, followed by Gujarat <em>(Rs. 190.07)</em>, Maharashtra <em>(Rs. 215.71)</em>, Odisha <em>(Rs. 216.87)</em>, Meghalaya <em>(Rs. 219.93)</em>, Bihar <em>(Rs. 230.43)</em>, Uttar Pradesh <em>(Rs. 230.5)</em>, and Assam <em>(Rs. 237.3)</em>. The related national level figure was Rs. 265.09 during the period from 2014-15 to 2020-21. Please consult chart-1. </p><p style="text-align:justify">The highest <a href="https://im4change.org/upload/files/State%20wise%20growth%20in%20average%20daily%20nominal%20wage%20rates%20in%20rural%20india%20men%20farm%20labourers.JPG" title="https://im4change.org/upload/files/State%20wise%20growth%20in%20average%20daily%20nominal%20wage%20rates%20in%20rural%20india%20men%20farm%20labourers.JPG">average annual growth rate in</a> <a href="https://im4change.org/upload/files/State%20wise%20growth%20in%20average%20daily%20nominal%20wage%20rates%20in%20rural%20india%20men%20farm%20labourers.JPG" title="https://im4change.org/upload/files/State%20wise%20growth%20in%20average%20daily%20nominal%20wage%20rates%20in%20rural%20india%20men%20farm%20labourers.JPG">nominal wage rates</a> during the period from 2015-16 to 2020-21 was found in Karnataka <em>(7.3 percent)</em>, followed by Andhra Pradesh <em>(6.8 percent)</em>, Madhya Pradesh <em>(6.4 percent)</em>, Uttar Pradesh <em>(6.2 percent)</em>, Odisha <em>(6.1 percent)</em>, and Meghalaya <em>(6.0 percent)</em>. Please see chart-2.</p><p style="text-align:justify">The lowest <a href="https://im4change.org/upload/files/State%20wise%20growth%20in%20average%20daily%20nominal%20wage%20rates%20in%20rural%20india%20men%20farm%20labourers.JPG" title="https://im4change.org/upload/files/State%20wise%20growth%20in%20average%20daily%20nominal%20wage%20rates%20in%20rural%20india%20men%20farm%20labourers.JPG">average annual growth rate</a> <a href="https://im4change.org/upload/files/State%20wise%20growth%20in%20average%20daily%20nominal%20wage%20rates%20in%20rural%20india%20men%20farm%20labourers.JPG" title="https://im4change.org/upload/files/State%20wise%20growth%20in%20average%20daily%20nominal%20wage%20rates%20in%20rural%20india%20men%20farm%20labourers.JPG">in nominal wage rates</a> during the same period was noticed in Haryana <em>(2.1 percent)</em>, followed by Rajasthan <em>(3.3 percent)</em>, Kerala <em>(3.5 percent)</em>, Punjab <em>(3.9 percent)</em>, and Tamil Nadu <em>(4.5 percent)</em>. Please consult chart-2.</p><p style="text-align:justify">The average annual <a href="https://im4change.org/upload/files/State%20wise%20growth%20in%20average%20daily%20wage%20rates%20in%20real%20terms%20for%20male%20farm%20labourers%20in%20rural%20India.JPG" title="https://im4change.org/upload/files/State%20wise%20growth%20in%20average%20daily%20wage%20rates%20in%20real%20terms%20for%20male%20farm%20labourers%20in%20rural%20India.JPG">growth of agricultural labourers’</a> <a href="https://im4change.org/upload/files/State%20wise%20growth%20in%20average%20daily%20wage%20rates%20in%20real%20terms%20for%20male%20farm%20labourers%20in%20rural%20India.JPG" title="https://im4change.org/upload/files/State%20wise%20growth%20in%20average%20daily%20wage%20rates%20in%20real%20terms%20for%20male%20farm%20labourers%20in%20rural%20India.JPG">wage rates in real terms</a> during the period from 2015-16 to 2020-21 were negative in Haryana <em>(-2.1 percent)</em>, Jammu and Kashmir <em>(-0.3 percent)</em>, Kerala <em>(-1.7 percent)</em>, Punjab <em>(-0.4 percent)</em>, Rajasthan <em>(-1.1 percent)</em>, Tamil Nadu <em>(-0.8 percent)</em>, Tripura <em>(-0.5 percent)</em>, and West Bengal <em>(-0.1 percent)</em>. It should be noted that the <a href="https://im4change.org/upload/files/State-wise%20Average%20Inflation%20CPI%20-%20Inflation.PDF" title="https://im4change.org/upload/files/State-wise%20Average%20Inflation%20CPI%20-%20Inflation.PDF">rate of inflation</a> in <a href="https://im4change.org/upload/files/State-wise%20Average%20Inflation%20CPI%20-%20Inflation.PDF" title="https://im4change.org/upload/files/State-wise%20Average%20Inflation%20CPI%20-%20Inflation.PDF">Consumer Price Index-General</a> has been used to get the average annual growth of agricultural labourers’ wage rates in real terms. Kindly consult table-1. </p><p style="text-align:justify">Some states witnessed negative <a href="https://im4change.org/upload/files/State%20wise%20growth%20in%20average%20daily%20wage%20rates%20in%20real%20terms%20for%20male%20farm%20labourers%20in%20rural%20India.JPG" title="https://im4change.org/upload/files/State%20wise%20growth%20in%20average%20daily%20wage%20rates%20in%20real%20terms%20for%20male%20farm%20labourers%20in%20rural%20India.JPG">growth in agricultural labourers’</a> <a href="https://im4change.org/upload/files/State%20wise%20growth%20in%20average%20daily%20wage%20rates%20in%20real%20terms%20for%20male%20farm%20labourers%20in%20rural%20India.JPG" title="https://im4change.org/upload/files/State%20wise%20growth%20in%20average%20daily%20wage%20rates%20in%20real%20terms%20for%20male%20farm%20labourers%20in%20rural%20India.JPG">wage rates in real terms</a> for more than two years between 2015-16 and 2020-21. For example, <a href="https://im4change.org/upload/files/State%20wise%20growth%20in%20average%20daily%20wage%20rates%20in%20real%20terms%20for%20male%20farm%20labourers%20in%20rural%20India.JPG" title="https://im4change.org/upload/files/State%20wise%20growth%20in%20average%20daily%20wage%20rates%20in%20real%20terms%20for%20male%20farm%20labourers%20in%20rural%20India.JPG">Haryana</a> experienced negative growth in 2015-16, 2016-17, 2017-18, 2019-20, and 2020-21. Likewise, <a href="https://im4change.org/upload/files/State%20wise%20growth%20in%20average%20daily%20wage%20rates%20in%20real%20terms%20for%20male%20farm%20labourers%20in%20rural%20India.JPG" title="https://im4change.org/upload/files/State%20wise%20growth%20in%20average%20daily%20wage%20rates%20in%20real%20terms%20for%20male%20farm%20labourers%20in%20rural%20India.JPG">Kerala</a> faced negative growth in 2017-18, 2018-19, 2019-20, and 2020-21. </p><p style="text-align:justify">At the national level, the <a href="https://im4change.org/upload/files/State%20wise%20growth%20in%20average%20daily%20wage%20rates%20in%20real%20terms%20for%20male%20farm%20labourers%20in%20rural%20India.JPG" title="https://im4change.org/upload/files/State%20wise%20growth%20in%20average%20daily%20wage%20rates%20in%20real%20terms%20for%20male%20farm%20labourers%20in%20rural%20India.JPG">agricultural labourers’</a> <a href="https://im4change.org/upload/files/State%20wise%20growth%20in%20average%20daily%20wage%20rates%20in%20real%20terms%20for%20male%20farm%20labourers%20in%20rural%20India.JPG" title="https://im4change.org/upload/files/State%20wise%20growth%20in%20average%20daily%20wage%20rates%20in%20real%20terms%20for%20male%20farm%20labourers%20in%20rural%20India.JPG">wage rates in real terms</a> on average grew by 1.0 percent annually during the period from 2015-16 to 2020-21.</p><p style="text-align:justify">Please <a href="https://docs.google.com/spreadsheets/d/1avu0-WtaKV2RHXtz2eiP7iS8znGVBdKC/edit?usp=sharing&ouid=112233925171588304692&rtpof=true&sd=true" title="https://docs.google.com/spreadsheets/d/1avu0-WtaKV2RHXtz2eiP7iS8znGVBdKC/edit?usp=sharing&ouid=112233925171588304692&rtpof=true&sd=true">click here</a> to access the spreadsheet in order to look at the trends in <a href="/upload/files/State%20wise%20average%20daily%20nominal%20wage%20rates%20in%20rural%20india%20men%20farm%20labourers.JPG" title="/upload/files/State%20wise%20average%20daily%20nominal%20wage%20rates%20in%20rural%20india%20men%20farm%20labourers.JPG">nominal wage rates</a>, <a href="/upload/files/State%20wise%20growth%20in%20average%20daily%20nominal%20wage%20rates%20in%20rural%20india%20men%20farm%20labourers.JPG" title="/upload/files/State%20wise%20growth%20in%20average%20daily%20nominal%20wage%20rates%20in%20rural%20india%20men%20farm%20labourers.JPG">annual growth in nominal wage rates</a> and <a href="/upload/files/State%20wise%20growth%20in%20average%20daily%20wage%20rates%20in%20real%20terms%20for%20male%20farm%20labourers%20in%20rural%20India.JPG" title="/upload/files/State%20wise%20growth%20in%20average%20daily%20wage%20rates%20in%20real%20terms%20for%20male%20farm%20labourers%20in%20rural%20India.JPG">annual growth in real wage rates</a> for farm labourers in rural areas. </p><p style="text-align:justify"><strong>Non-agricultural wages in rural areas</strong></p><p style="text-align:justify">The rural economy is not just about farming any longer. That is why we have looked at the wage growth in the non-farm sector too. The highest <a href="https://im4change.org/upload/files/State%20wise%20average%20daily%20nominal%20wage%20rates%20in%20rural%20india%20men%20non%20farm%20labourers.JPG" title="https://im4change.org/upload/files/State%20wise%20average%20daily%20nominal%20wage%20rates%20in%20rural%20india%20men%20non%20farm%20labourers.JPG">average daily nominal wage rate for male</a> <a href="https://im4change.org/upload/files/State%20wise%20average%20daily%20nominal%20wage%20rates%20in%20rural%20india%20men%20non%20farm%20labourers.JPG" title="https://im4change.org/upload/files/State%20wise%20average%20daily%20nominal%20wage%20rates%20in%20rural%20india%20men%20non%20farm%20labourers.JPG">non-agricultural labourers</a> in rural India during the period from 2014-15 to 2020-21 was detected in Kerala <em>(Rs. 639.01)</em>, followed by Jammu and Kashmir <em>(Rs. 426.37)</em>, Tamil Nadu <em>(Rs. 405.77)</em>, Haryana <em>(Rs. 359.24)</em>, Himachal Pradesh <em>(Rs. 311.10)</em>, and Punjab <em>(Rs. 309.09)</em>. Please see chart-1.</p><p style="text-align:justify">The lowest average <a href="https://im4change.org/upload/files/State%20wise%20average%20daily%20nominal%20wage%20rates%20in%20rural%20india%20men%20non%20farm%20labourers.JPG" title="https://im4change.org/upload/files/State%20wise%20average%20daily%20nominal%20wage%20rates%20in%20rural%20india%20men%20non%20farm%20labourers.JPG">daily nominal wage rate for male</a> <a href="https://im4change.org/upload/files/State%20wise%20average%20daily%20nominal%20wage%20rates%20in%20rural%20india%20men%20non%20farm%20labourers.JPG" title="https://im4change.org/upload/files/State%20wise%20average%20daily%20nominal%20wage%20rates%20in%20rural%20india%20men%20non%20farm%20labourers.JPG">non-agricultural labourers in rural India</a> during the period from 2014-15 to 2020-21 was found in Madhya Pradesh <em>(Rs. 191.47)</em>, followed by Meghalaya <em>(Rs. 210.26)</em>, Gujarat <em>(Rs. 213.51)</em>, Odisha <em>(Rs. 218.06)</em>, Maharashtra <em>(Rs. 226.70)</em>, Tripura <em>(Rs. 230.36)</em>, Bihar <em>(Rs. 243.51)</em>, and Uttar Pradesh <em>(Rs. 243.97)</em>. The related national level figure was Rs. 273.79 during the period from 2014-15 to 2020-21. Please see chart-1.</p><p style="text-align:justify">The highest <a href="https://im4change.org/upload/files/State%20wise%20growth%20in%20average%20daily%20nominal%20wage%20rates%20in%20rural%20india%20men%20non%20farm%20labourers.JPG" title="https://im4change.org/upload/files/State%20wise%20growth%20in%20average%20daily%20nominal%20wage%20rates%20in%20rural%20india%20men%20non%20farm%20labourers.JPG">average annual growth rate in</a> <a href="https://im4change.org/upload/files/State%20wise%20growth%20in%20average%20daily%20nominal%20wage%20rates%20in%20rural%20india%20men%20non%20farm%20labourers.JPG" title="https://im4change.org/upload/files/State%20wise%20growth%20in%20average%20daily%20nominal%20wage%20rates%20in%20rural%20india%20men%20non%20farm%20labourers.JPG">nominal wage rates</a> during the period from 2015-16 to 2020-21 was noticed in Odisha <em>(8.0 percent)</em>, followed by Madhya Pradesh <em>(7.6 percent)</em>, Assam <em>(6.6 percent)</em>, West Bengal <em>(5.9 percent)</em>, Uttar Pradesh and Andhra Pradesh <em>(5.6 percent each)</em>, and Bihar <em>(5.5 percent)</em>. Kindly consult chart-2.</p><p style="text-align:justify">The lowest <a href="https://im4change.org/upload/files/State%20wise%20growth%20in%20average%20daily%20nominal%20wage%20rates%20in%20rural%20india%20men%20non%20farm%20labourers.JPG" title="https://im4change.org/upload/files/State%20wise%20growth%20in%20average%20daily%20nominal%20wage%20rates%20in%20rural%20india%20men%20non%20farm%20labourers.JPG">average annual growth rate</a> <a href="https://im4change.org/upload/files/State%20wise%20growth%20in%20average%20daily%20nominal%20wage%20rates%20in%20rural%20india%20men%20non%20farm%20labourers.JPG" title="https://im4change.org/upload/files/State%20wise%20growth%20in%20average%20daily%20nominal%20wage%20rates%20in%20rural%20india%20men%20non%20farm%20labourers.JPG">in nominal wage rates</a> during the same period was observed in Kerala <em>(1.8 percent)</em>, followed by Haryana <em>(2.4 percent)</em>, Meghalaya <em>(2.8 percent)</em>, Tamil Nadu and Rajasthan <em>(3.2 percent each)</em>, Tripura and Jammu and Kashmir <em>(4.0 percent each),</em> and Maharashtra and Punjab <em>(4.2 percent each)</em>. Kindly consult chart-2. </p><p style="text-align:justify">The average annual <a href="https://im4change.org/upload/files/State%20wise%20growth%20in%20average%20daily%20wage%20rates%20in%20real%20terms%20for%20male%20non%20farm%20labourers%20in%20rural%20India.JPG" title="https://im4change.org/upload/files/State%20wise%20growth%20in%20average%20daily%20wage%20rates%20in%20real%20terms%20for%20male%20non%20farm%20labourers%20in%20rural%20India.JPG">growth of non-agricultural labourers’</a> <a href="https://im4change.org/upload/files/State%20wise%20growth%20in%20average%20daily%20wage%20rates%20in%20real%20terms%20for%20male%20non%20farm%20labourers%20in%20rural%20India.JPG" title="https://im4change.org/upload/files/State%20wise%20growth%20in%20average%20daily%20wage%20rates%20in%20real%20terms%20for%20male%20non%20farm%20labourers%20in%20rural%20India.JPG">wage rates in real terms</a> during the period from 2015-16 to 2020-21 were negative in Haryana <em>(-1.9 percent)</em>, Jammu and Kashmir <em>(-1.7 percent)</em>, Kerala <em>(-3.5 percent)</em>, Maharashtra <em>(-0.3 percent)</em>, Meghalaya <em>(-1.2 percent)</em>, Punjab <em>(-0.1 percent)</em>, Rajasthan <em>(-1.2 percent)</em>, Tamil Nadu <em>(-2.1 percent)</em>, and Tripura <em>(-1.1 percent)</em>. It should be noted that the <a href="https://im4change.org/upload/files/State-wise%20Average%20Inflation%20CPI%20-%20Inflation.PDF" title="https://im4change.org/upload/files/State-wise%20Average%20Inflation%20CPI%20-%20Inflation.PDF">rate of inflation</a> in <a href="https://im4change.org/upload/files/State-wise%20Average%20Inflation%20CPI%20-%20Inflation.PDF" title="https://im4change.org/upload/files/State-wise%20Average%20Inflation%20CPI%20-%20Inflation.PDF">CPI-General</a> has been used to get the average annual growth of non-agricultural labourers’ wage rates in real terms. Kindly have a look at table-1. </p><p style="text-align:justify">Some states experienced negative growth in <a href="https://im4change.org/upload/files/State%20wise%20growth%20in%20average%20daily%20wage%20rates%20in%20real%20terms%20for%20male%20non%20farm%20labourers%20in%20rural%20India.JPG" title="https://im4change.org/upload/files/State%20wise%20growth%20in%20average%20daily%20wage%20rates%20in%20real%20terms%20for%20male%20non%20farm%20labourers%20in%20rural%20India.JPG">non-agricultural labourers’ wage</a> <a href="https://im4change.org/upload/files/State%20wise%20growth%20in%20average%20daily%20wage%20rates%20in%20real%20terms%20for%20male%20non%20farm%20labourers%20in%20rural%20India.JPG" title="https://im4change.org/upload/files/State%20wise%20growth%20in%20average%20daily%20wage%20rates%20in%20real%20terms%20for%20male%20non%20farm%20labourers%20in%20rural%20India.JPG">rates in real terms</a> for more than two years between 2015-16 and 2020-21. For example, <a href="https://im4change.org/upload/files/State%20wise%20growth%20in%20average%20daily%20wage%20rates%20in%20real%20terms%20for%20male%20non%20farm%20labourers%20in%20rural%20India.JPG" title="https://im4change.org/upload/files/State%20wise%20growth%20in%20average%20daily%20wage%20rates%20in%20real%20terms%20for%20male%20non%20farm%20labourers%20in%20rural%20India.JPG">Haryana</a> experienced negative <a href="https://im4change.org/upload/files/State%20wise%20growth%20in%20average%20daily%20wage%20rates%20in%20real%20terms%20for%20male%20non%20farm%20labourers%20in%20rural%20India.JPG" title="https://im4change.org/upload/files/State%20wise%20growth%20in%20average%20daily%20wage%20rates%20in%20real%20terms%20for%20male%20non%20farm%20labourers%20in%20rural%20India.JPG">growth in wage rates</a> <a href="https://im4change.org/upload/files/State%20wise%20growth%20in%20average%20daily%20wage%20rates%20in%20real%20terms%20for%20male%20non%20farm%20labourers%20in%20rural%20India.JPG" title="https://im4change.org/upload/files/State%20wise%20growth%20in%20average%20daily%20wage%20rates%20in%20real%20terms%20for%20male%20non%20farm%20labourers%20in%20rural%20India.JPG">(in real terms)</a> during 2016-17, 2017-18, 2018-19, 2019-20, and 2020-21. Likewise, <a href="https://im4change.org/upload/files/State%20wise%20growth%20in%20average%20daily%20wage%20rates%20in%20real%20terms%20for%20male%20non%20farm%20labourers%20in%20rural%20India.JPG" title="https://im4change.org/upload/files/State%20wise%20growth%20in%20average%20daily%20wage%20rates%20in%20real%20terms%20for%20male%20non%20farm%20labourers%20in%20rural%20India.JPG">Kerala</a> faced negative growth rates in 2015-16, 2016-17, 2017-18, 2019-20, and 2020-21. </p><p style="text-align:justify">At the national level, the <a href="https://im4change.org/upload/files/State%20wise%20growth%20in%20average%20daily%20wage%20rates%20in%20real%20terms%20for%20male%20non%20farm%20labourers%20in%20rural%20India.JPG" title="https://im4change.org/upload/files/State%20wise%20growth%20in%20average%20daily%20wage%20rates%20in%20real%20terms%20for%20male%20non%20farm%20labourers%20in%20rural%20India.JPG">non-agricultural labourers’</a> <a href="https://im4change.org/upload/files/State%20wise%20growth%20in%20average%20daily%20wage%20rates%20in%20real%20terms%20for%20male%20non%20farm%20labourers%20in%20rural%20India.JPG" title="https://im4change.org/upload/files/State%20wise%20growth%20in%20average%20daily%20wage%20rates%20in%20real%20terms%20for%20male%20non%20farm%20labourers%20in%20rural%20India.JPG">wage rates in real terms</a> on average grew by just 0.3 percent annually during the period from 2015-16 to 2020-21. </p><p style="text-align:justify">Please <a href="https://docs.google.com/spreadsheets/d/1avu0-WtaKV2RHXtz2eiP7iS8znGVBdKC/edit?usp=sharing&ouid=112233925171588304692&rtpof=true&sd=true" title="https://docs.google.com/spreadsheets/d/1avu0-WtaKV2RHXtz2eiP7iS8znGVBdKC/edit?usp=sharing&ouid=112233925171588304692&rtpof=true&sd=true">click here</a> to access the spreadsheet in order to look at the <a href="/upload/files/State%20wise%20average%20daily%20nominal%20wage%20rates%20in%20rural%20india%20men%20non%20farm%20labourers.JPG" title="/upload/files/State%20wise%20average%20daily%20nominal%20wage%20rates%20in%20rural%20india%20men%20non%20farm%20labourers.JPG">trends in nominal wage rates</a>, <a href="/upload/files/State%20wise%20growth%20in%20average%20daily%20nominal%20wage%20rates%20in%20rural%20india%20men%20non%20farm%20labourers.JPG" title="/upload/files/State%20wise%20growth%20in%20average%20daily%20nominal%20wage%20rates%20in%20rural%20india%20men%20non%20farm%20labourers.JPG">annual growth in nominal wage rates</a>, and <a href="/upload/files/State%20wise%20growth%20in%20average%20daily%20wage%20rates%20in%20real%20terms%20for%20male%20non%20farm%20labourers%20in%20rural%20India.JPG" title="/upload/files/State%20wise%20growth%20in%20average%20daily%20wage%20rates%20in%20real%20terms%20for%20male%20non%20farm%20labourers%20in%20rural%20India.JPG">annual growth in real wage rates</a> for non-farm labourers in rural areas. </p><p style="text-align:justify"><strong>Construction sector wages in rural areas</strong></p><p style="text-align:justify">The <a href="https://im4change.org/upload/files/State%20wise%20average%20daily%20nominal%20wage%20rates%20in%20rural%20india%20men%20construction%20workers.JPG" title="https://im4change.org/upload/files/State%20wise%20average%20daily%20nominal%20wage%20rates%20in%20rural%20india%20men%20construction%20workers.JPG">highest average daily nominal wage rates</a> <a href="https://im4change.org/upload/files/State%20wise%20average%20daily%20nominal%20wage%20rates%20in%20rural%20india%20men%20construction%20workers.JPG" title="https://im4change.org/upload/files/State%20wise%20average%20daily%20nominal%20wage%20rates%20in%20rural%20india%20men%20construction%20workers.JPG">for male construction workers in rural India</a> during the period from 2014-15 to 2020-21 was detected in Kerala <em>(Rs. 810.3)</em>, followed by Jammu and Kashmir <em>(Rs. 445.1)</em>, Tamil Nadu <em>(Rs. 424.1)</em>, Haryana <em>(Rs. 379.9)</em>, Himachal Pradesh <em>(Rs. 368.7)</em>, Rajasthan <em>(Rs. 347.7)</em>, and Punjab <em>(Rs. 339.1)</em>. Kindly see chart-1. </p><p style="text-align:justify">The <a href="https://im4change.org/upload/files/State%20wise%20average%20daily%20nominal%20wage%20rates%20in%20rural%20india%20men%20construction%20workers.JPG" title="https://im4change.org/upload/files/State%20wise%20average%20daily%20nominal%20wage%20rates%20in%20rural%20india%20men%20construction%20workers.JPG">lowest average daily nominal wage rates</a> <a href="https://im4change.org/upload/files/State%20wise%20average%20daily%20nominal%20wage%20rates%20in%20rural%20india%20men%20construction%20workers.JPG" title="https://im4change.org/upload/files/State%20wise%20average%20daily%20nominal%20wage%20rates%20in%20rural%20india%20men%20construction%20workers.JPG">for male construction workers in rural areas</a> during the period from 2014-15 to 2020-21 was found in Madhya Pradesh <em>(Rs. 212.4)</em>, followed by Tripura <em>(Rs. 230.4)</em>, Meghalaya <em>(Rs. 231.7)</em>, Odisha <em>(Rs. 247.1)</em>, Gujarat <em>(Rs. 251.8)</em>, Uttar Pradesh <em>(Rs. 267.4)</em>, Bihar <em>(Rs. 270.8)</em>, and West Bengal <em>(Rs. 274.0)</em>. The related national level figure was Rs. 316.9 during the period from 2014-15 to 2020-21. Kindly consult chart-1.</p><p style="text-align:justify">The <a href="https://im4change.org/upload/files/State%20wise%20growth%20in%20average%20daily%20nominal%20wage%20rates%20in%20rural%20india%20men%20construction%20workers.JPG" title="https://im4change.org/upload/files/State%20wise%20growth%20in%20average%20daily%20nominal%20wage%20rates%20in%20rural%20india%20men%20construction%20workers.JPG">highest average annual growth rates in</a> <a href="https://im4change.org/upload/files/State%20wise%20growth%20in%20average%20daily%20nominal%20wage%20rates%20in%20rural%20india%20men%20construction%20workers.JPG" title="https://im4change.org/upload/files/State%20wise%20growth%20in%20average%20daily%20nominal%20wage%20rates%20in%20rural%20india%20men%20construction%20workers.JPG">nominal wage rates</a> during the period from 2015-16 to 2020-21 was noticed in Meghalaya <em>(20.9 percent)</em>, followed by Madhya Pradesh <em>(7.4 percent)</em>, Odisha and Andhra Pradesh <em>(6.8 percent each)</em>, Uttar Pradesh <em>(6.4 percent)</em>, and Bihar <em>(6.2 percent)</em>. Please see chart-2. </p><p style="text-align:justify">The <a href="https://im4change.org/upload/files/State%20wise%20growth%20in%20average%20daily%20nominal%20wage%20rates%20in%20rural%20india%20men%20construction%20workers.JPG" title="https://im4change.org/upload/files/State%20wise%20growth%20in%20average%20daily%20nominal%20wage%20rates%20in%20rural%20india%20men%20construction%20workers.JPG">lowest average annual growth rates in</a> <a href="https://im4change.org/upload/files/State%20wise%20growth%20in%20average%20daily%20nominal%20wage%20rates%20in%20rural%20india%20men%20construction%20workers.JPG" title="https://im4change.org/upload/files/State%20wise%20growth%20in%20average%20daily%20nominal%20wage%20rates%20in%20rural%20india%20men%20construction%20workers.JPG">nominal wage rates</a> during the same period was observed in Kerala <em>(0.9 percent)</em>, followed by Manipur <em>(2.0 percent)</em>, Haryana <em>(2.1 percent)</em>, Jammu and Kashmir <em>(3.0 percent)</em>, Rajasthan <em>(3.2 percent)</em>, and Gujarat <em>(3.6 percent)</em>. Please see chart-2.</p><p style="text-align:justify">The <a href="https://im4change.org/upload/files/State%20wise%20growth%20in%20average%20daily%20wage%20rates%20in%20real%20terms%20for%20male%20construction%20workers%20in%20rural%20India%281%29.JPG" title="https://im4change.org/upload/files/State%20wise%20growth%20in%20average%20daily%20wage%20rates%20in%20real%20terms%20for%20male%20construction%20workers%20in%20rural%20India%281%29.JPG">average annual growth of construction workers’</a> <a href="https://im4change.org/upload/files/State%20wise%20growth%20in%20average%20daily%20wage%20rates%20in%20real%20terms%20for%20male%20construction%20workers%20in%20rural%20India%281%29.JPG" title="https://im4change.org/upload/files/State%20wise%20growth%20in%20average%20daily%20wage%20rates%20in%20real%20terms%20for%20male%20construction%20workers%20in%20rural%20India%281%29.JPG">wage rates in real terms</a> during the period from 2015-16 to 2020-21 was negative in Assam <em>(-1.2 percent)</em>, Haryana <em>(-2.1 percent)</em>, Jammu and Kashmir <em>(-2.7 percent)</em>, Karnataka <em>(-0.6 percent)</em>, Kerala <em>(-4.4 percent)</em>, Manipur <em>(-6.3 percent)</em>, Rajasthan <em>(-1.2 percent)</em>, Tamil Nadu <em>(-0.9 percent)</em>, and Tripura <em>(-1.1 percent)</em>. Please note that the <a href="https://im4change.org/upload/files/State-wise%20Average%20Inflation%20CPI%20-%20Inflation.PDF" title="https://im4change.org/upload/files/State-wise%20Average%20Inflation%20CPI%20-%20Inflation.PDF">rate of inflation</a> in <a href="https://im4change.org/upload/files/State-wise%20Average%20Inflation%20CPI%20-%20Inflation.PDF" title="https://im4change.org/upload/files/State-wise%20Average%20Inflation%20CPI%20-%20Inflation.PDF">CPI-General</a> has been used to get the average annual growth of construction workers’ wage rates in real terms. Kindly have a look at table-1. </p><p style="text-align:justify">In the case of Meghalaya, the <a href="https://im4change.org/upload/files/State%20wise%20average%20daily%20nominal%20wage%20rates%20in%20rural%20india%20men%20construction%20workers.JPG" title="https://im4change.org/upload/files/State%20wise%20average%20daily%20nominal%20wage%20rates%20in%20rural%20india%20men%20construction%20workers.JPG">nominal daily wage rate of male construction</a> <a href="https://im4change.org/upload/files/State%20wise%20average%20daily%20nominal%20wage%20rates%20in%20rural%20india%20men%20construction%20workers.JPG" title="https://im4change.org/upload/files/State%20wise%20average%20daily%20nominal%20wage%20rates%20in%20rural%20india%20men%20construction%20workers.JPG">workers</a> fell from Rs. 186.0 in 2016-17 to Rs. 100.0 in 2017-18 i.e., a decline by -46.2 percent over previous year. However, the same bounced back to Rs. 273.2 in 2018-19 i.e., an increase by 173.2 percent over previous year. In <a href="https://im4change.org/upload/files/State%20wise%20growth%20in%20average%20daily%20wage%20rates%20in%20real%20terms%20for%20male%20construction%20workers%20in%20rural%20India%281%29.JPG" title="https://im4change.org/upload/files/State%20wise%20growth%20in%20average%20daily%20wage%20rates%20in%20real%20terms%20for%20male%20construction%20workers%20in%20rural%20India%281%29.JPG">real terms, the construction sector</a> <a href="https://im4change.org/upload/files/State%20wise%20growth%20in%20average%20daily%20wage%20rates%20in%20real%20terms%20for%20male%20construction%20workers%20in%20rural%20India%281%29.JPG" title="https://im4change.org/upload/files/State%20wise%20growth%20in%20average%20daily%20wage%20rates%20in%20real%20terms%20for%20male%20construction%20workers%20in%20rural%20India%281%29.JPG">wage rate in Meghalaya</a> grew by -47.7 percent in 2017-18 <em>(over previous year)</em> and 171.0 percent in 2018-19 <em>(over previous year)</em>.</p><p style="text-align:justify">Some states experienced negative <a href="https://im4change.org/upload/files/State%20wise%20growth%20in%20average%20daily%20wage%20rates%20in%20real%20terms%20for%20male%20construction%20workers%20in%20rural%20India%281%29.JPG" title="https://im4change.org/upload/files/State%20wise%20growth%20in%20average%20daily%20wage%20rates%20in%20real%20terms%20for%20male%20construction%20workers%20in%20rural%20India%281%29.JPG">growth in construction workers’</a> <a href="https://im4change.org/upload/files/State%20wise%20growth%20in%20average%20daily%20wage%20rates%20in%20real%20terms%20for%20male%20construction%20workers%20in%20rural%20India%281%29.JPG" title="https://im4change.org/upload/files/State%20wise%20growth%20in%20average%20daily%20wage%20rates%20in%20real%20terms%20for%20male%20construction%20workers%20in%20rural%20India%281%29.JPG">wage rates in real terms</a> for more than two years between 2015-16 and 2020-21. For example, <a href="https://im4change.org/upload/files/State%20wise%20growth%20in%20average%20daily%20wage%20rates%20in%20real%20terms%20for%20male%20construction%20workers%20in%20rural%20India%281%29.JPG" title="https://im4change.org/upload/files/State%20wise%20growth%20in%20average%20daily%20wage%20rates%20in%20real%20terms%20for%20male%20construction%20workers%20in%20rural%20India%281%29.JPG">Assam</a> experienced negative growth in wage rates <em>(in real terms)</em> during 2017-18, 2018-19, 2019-20, and 2020-21. </p><p style="text-align:justify">At the national level, the <a href="https://im4change.org/upload/files/State%20wise%20growth%20in%20average%20daily%20wage%20rates%20in%20real%20terms%20for%20male%20construction%20workers%20in%20rural%20India%281%29.JPG" title="https://im4change.org/upload/files/State%20wise%20growth%20in%20average%20daily%20wage%20rates%20in%20real%20terms%20for%20male%20construction%20workers%20in%20rural%20India%281%29.JPG">construction workers’ wage rates in real terms</a> on average grew by just 0.1 percent annually during the period from 2015-16 to 2020-21.</p><p style="text-align:justify">Kindly <a href="https://docs.google.com/spreadsheets/d/1avu0-WtaKV2RHXtz2eiP7iS8znGVBdKC/edit?usp=sharing&ouid=112233925171588304692&rtpof=true&sd=true" title="https://docs.google.com/spreadsheets/d/1avu0-WtaKV2RHXtz2eiP7iS8znGVBdKC/edit?usp=sharing&ouid=112233925171588304692&rtpof=true&sd=true">click here</a> to access the spreadsheet in order to look at the <a href="/upload/files/State%20wise%20average%20daily%20nominal%20wage%20rates%20in%20rural%20india%20men%20construction%20workers.JPG" title="/upload/files/State%20wise%20average%20daily%20nominal%20wage%20rates%20in%20rural%20india%20men%20construction%20workers.JPG">trends in nominal wage rates</a>, <a href="/upload/files/State%20wise%20growth%20in%20average%20daily%20nominal%20wage%20rates%20in%20rural%20india%20men%20construction%20workers.JPG" title="/upload/files/State%20wise%20growth%20in%20average%20daily%20nominal%20wage%20rates%20in%20rural%20india%20men%20construction%20workers.JPG">annual growth in nominal wage rates</a>, and <a href="/upload/files/State%20wise%20growth%20in%20average%20daily%20wage%20rates%20in%20real%20terms%20for%20male%20construction%20workers%20in%20rural%20India%281%29.JPG" title="/upload/files/State%20wise%20growth%20in%20average%20daily%20wage%20rates%20in%20real%20terms%20for%20male%20construction%20workers%20in%20rural%20India%281%29.JPG">annual growth in real wage rates</a> for construction workers in rural areas. </p><p style="text-align:justify"><strong>Data collection methodology</strong></p><p style="text-align:justify">As a part of Rural Labour Enquiry, the <a href="https://im4change.org/upload/files/ilj_feb_2013.pdf" title="https://im4change.org/upload/files/ilj_feb_2013.pdf">daily wage rates</a> in respect of eighteen agricultural and non-agricultural occupations are being collected along with rural retail price data by the Field Operations Division of the National Sample Survey Organisation since 1986-87, according to a February 2013 <a href="https://im4change.org/upload/files/ilj_feb_2013.pdf" title="https://im4change.org/upload/files/ilj_feb_2013.pdf">edition of the Indian Labour Journal</a>. On the recommendations of the Governing Council of the National Sample Survey Organisation in its 61st meeting, the <a href="https://im4change.org/upload/files/ilj_feb_2013.pdf" title="https://im4change.org/upload/files/ilj_feb_2013.pdf">Labour Bureau</a> started the compilation and analysis of wage rate data with effect from April, 1998. </p><p style="text-align:justify">The Field Operations Division of the National Sample Survey Organisation has been entrusted with the work of <a href="https://im4change.org/upload/files/METHOLOGY%20FOR%20COMPILATION%20OF%20THE%20WAGE%20RATE%20DATA.pdf" title="https://im4change.org/upload/files/METHOLOGY%20FOR%20COMPILATION%20OF%20THE%20WAGE%20RATE%20DATA.pdf">data collection</a>. The <a href="https://im4change.org/upload/files/METHOLOGY%20FOR%20COMPILATION%20OF%20THE%20WAGE%20RATE%20DATA.pdf" title="https://im4change.org/upload/files/METHOLOGY%20FOR%20COMPILATION%20OF%20THE%20WAGE%20RATE%20DATA.pdf">wage rate data</a> are being collected along with rural retail prices from 600 sample villages spread over 66 NSS regions of 20 States by canvassing Block-5 <em>(Annexure-I)</em> of Schedule 3.01(R). The data collection from these sample villages is staggered over the four weeks of a month with one-fourth of them being covered every week. The days of canvassing of Schedule 3.01(R) are fixed. The village functionaries like the Panchayat Secretary, Progress Assistant, Patwari and other Village or Block Officials are the primary informants for collection of data on wage rates. The data on normal working hours and the prevailing wage rates in cash and kind for the reported working hours are collected sex-wise for each of the 18 selected occupations in 20 states, indicates an old <a href="https://im4change.org/upload/files/METHOLOGY%20FOR%20COMPILATION%20OF%20THE%20WAGE%20RATE%20DATA.pdf" title="https://im4change.org/upload/files/METHOLOGY%20FOR%20COMPILATION%20OF%20THE%20WAGE%20RATE%20DATA.pdf">document</a> of the Labour Bureau. </p><p style="text-align:justify">The wage rates are sometimes reported for a duration that is less/more than the normal working hours. In such cases, they are <a href="https://im4change.org/upload/files/METHOLOGY%20FOR%20COMPILATION%20OF%20THE%20WAGE%20RATE%20DATA.pdf" title="https://im4change.org/upload/files/METHOLOGY%20FOR%20COMPILATION%20OF%20THE%20WAGE%20RATE%20DATA.pdf">first normalised for eight hours</a> working day. As regards the mode of payment of wages, it is made in both ways i.e., in cash and/or in kind. The payments made in kind are very common in rural areas, which include foodgrains, cooked food, tea, fuel, cigarette, beedi, fodder, etc. The wages reported in kind are evaluated at local retail prices. Thereafter, the data is thoroughly scrutinised and discrepant points are referred back to the field for clarification. In the next stage, the simple arithmetic average of these normalised daily wage rates is worked out occupation-wise and sex-wise for each state.</p><p style="text-align:justify"><a href="http://ras.org.in/methodology_of_data_collection_unsuited_to_changing_rural_reality" title="http://ras.org.in/methodology_of_data_collection_unsuited_to_changing_rural_reality">Up to June 2000</a>, the average wage rates at the national level were derived by taking the simple average of state figures; since July 2000, the averages have been obtained by dividing the sum total of wages of all 20 states by the number of centres or villages from which data were collected. The state-wise averages are restricted only to those occupations where the number of centres is five or more to avoid abnormal fluctuations and inconsistency in wages paid to different categories of workers on account of varying numbers of centres. However, in order to calculate the all-India averages, all neglected centres are taken into account to arrive at the total number of centres at the national level.</p><p style="text-align:justify">The <a href="/upload/files/RBI%20note%20Average%20Daily%20Wage%20rate%20Methodology.pdf" title="/upload/files/RBI%20note%20Average%20Daily%20Wage%20rate%20Methodology.pdf">Reserve Bank of India</a> <em>(whose data we have used in writing this news alert)</em> has collated and is releasing monthly time series data on rural wage rates based on the data published by the Labour Bureau, Government of India. Starting from November 2013 the Labour Bureau is collecting the rural wage data in respect of 12 agricultural and 13 non-agricultural occupations across 20 major states, namely, Andhra Pradesh, Assam, Bihar, Gujarat, Haryana, Himachal Pradesh, Jammu & Kashmir, Karnataka, Kerala, Madhya Pradesh, Maharashtra, Manipur, Meghalaya, Orissa, Punjab, Rajasthan, Tamil Nadu, Tripura, Uttar Pradesh and West Bengal. The occupations for which the daily wage rates are collected every month are: <u>(A) Agricultural occupations</u> – (1) Ploughing/ Tilling workers, (2) Sowing <em>(including planting/ Transplanting/ Weeding)</em> workers, (3) Harvesting/ Winnowing/ Threshing workers, (4) Picking workers <em>(including Tea, Cotton, Tobacco and other commercial crops)</em>, (5) Horticulture workers <em>(including nursery growers)</em>, (6) Fishermen-inland, (7) Fishermen coastal/deep-sea, (8) Loggers and wood cutters, (9) Animal husbandry workers <em>(including poultry workers, dairy workers and herdsman)</em>, (10) Packaging labourers, agriculture, (11) General agricultural labourers <em>(including watering/ irrigation workers, etc.)</em>, (12) Plant protection workers <em>(applying pesticides, treating seeds, etc.)</em>; and <u>(B) Non-agricultural occupations</u> – (13) Carpenter, (14) Blacksmith, (15) Mason, (16) Weavers, (17) Beedi makers, (18) Bamboo, cane basket weavers, (19) Handicraft workers, (20) Plumbers, (21) Electrician, (22) Construction workers <em>(for roads, dams, industrial & project construction work and Well diggers)</em>, (23) LMV & Tractor drivers, (24) Non-agricultural labourers <em>(including porters, loaders)</em>, and (25) Sweeping/cleaning workers. </p><p style="text-align:justify"><strong><em>References </em></strong></p><p style="text-align:justify">Handbook of Statistics on Indian States 2020-21, released in November 2021, please <a href="https://m.rbi.org.in/scripts/AnnualPublications.aspx?head=Handbook%20of%20Statistics%20on%20Indian%20States" title="https://m.rbi.org.in/scripts/AnnualPublications.aspx?head=Handbook%20of%20Statistics%20on%20Indian%20States">click here</a> to access</p><p style="text-align:justify">State-wise Average Daily Wage Rates in Rural India (Men - General Agricultural Labourers), RBI Handbook of Statistics on Indian States 2020-21, released in November 2021, please <a href="/upload/files/State-wise%20Average%20Daily%20Wage%20Rates%20in%20Rural%20India%20Men%20-%20General%20Agricultural%20Labourers.PDF" title="/upload/files/State-wise%20Average%20Daily%20Wage%20Rates%20in%20Rural%20India%20Men%20-%20General%20Agricultural%20Labourers.PDF">click here</a> to access </p><p style="text-align:justify">State-wise Average Daily Wage Rates in Rural India (Men - Non-Agricultural Labourers), RBI Handbook of Statistics on Indian States 2020-21, released in November 2021, please <a href="/upload/files/State-wise%20Average%20Daily%20Wage%20Rates%20in%20Rural%20India%20Men%20-%20Non%20Agricultural%20Labourers.PDF" title="/upload/files/State-wise%20Average%20Daily%20Wage%20Rates%20in%20Rural%20India%20Men%20-%20Non%20Agricultural%20Labourers.PDF">click here</a> to access </p><p style="text-align:justify">State-wise Average Daily Wage Rates in Rural India (Men - Construction Workers), RBI Handbook of Statistics on Indian States 2020-21, released in November 2021, please <a href="/upload/files/State-wise%20Average%20Daily%20Wage%20Rates%20in%20Rural%20India%20Men%20-%20Construction%20Workers.PDF" title="/upload/files/State-wise%20Average%20Daily%20Wage%20Rates%20in%20Rural%20India%20Men%20-%20Construction%20Workers.PDF">click here</a> to access </p><p style="text-align:justify">State-wise Average Inflation (CPI) - Inflation, RBI Handbook of Statistics on Indian States 2020-21, released in November 2021, please <a href="/upload/files/State-wise%20Average%20Inflation%20CPI%20-%20Inflation.PDF" title="/upload/files/State-wise%20Average%20Inflation%20CPI%20-%20Inflation.PDF">click here</a> to access </p><p style="text-align:justify">Indian Labour Journal, February 2013, please <a href="/upload/files/ilj_feb_2013.pdf" title="/upload/files/ilj_feb_2013.pdf">click here</a> to access </p><p style="text-align:justify">Wage Rates in Rural India 2003-04: Methodology for Compilation of the Wage Rate Data, Labour Bureau, please <a href="/upload/files/METHOLOGY%20FOR%20COMPILATION%20OF%20THE%20WAGE%20RATE%20DATA.pdf" title="/upload/files/METHOLOGY%20FOR%20COMPILATION%20OF%20THE%20WAGE%20RATE%20DATA.pdf">click here</a> to access </p><p style="text-align:justify">Average Daily Wage Rates in Rural India: Methodology and coverage (From November 2013), Reserve Bank of India, please <a href="https://dbie.rbi.org.in" title="https://dbie.rbi.org.in">click here</a> and <a href="/upload/files/RBI%20note%20Average%20Daily%20Wage%20rate%20Methodology%281%29.pdf" title="/upload/files/RBI%20note%20Average%20Daily%20Wage%20rate%20Methodology%281%29.pdf">here</a> to access </p><p style="text-align:justify">Consumer Price Index Numbers on Base 2012=100 for Rural, Urban and Combined for the month of January 2022, Ministry of Statistics and Programme Implementation (MoSPI), National Statistical Office (NSO), released on 14th February 2022, please <a href="/upload/files/CPI%20Press%20Release%20January%202022%281%29.pdf" title="/upload/files/CPI%20Press%20Release%20January%202022%281%29.pdf">click here</a> to access </p><p style="text-align:justify">Methodology of Data Collection Unsuited to Changing Rural Reality: A Study of Agricultural Wage Data in India -Yoshifumi Usami, Arindam Das, and Madhura Swaminathan, Review of Agrarian Studies, Vol. 10, No. 2, July-December, 2020, please <a href="http://ras.org.in/methodology_of_data_collection_unsuited_to_changing_rural_reality" title="http://ras.org.in/methodology_of_data_collection_unsuited_to_changing_rural_reality">click here</a> to access</p><p>Russia-ukraine crisis to push up fertiliser prices, govt subsidies, IANS/ Business Standard, 4 March, 2022, please <a href="https://www.business-standard.com/article/economy-policy/russia-ukraine-crisis-to-push-up-fertiliser-prices-govt-subsidies-122030400560_1.html" title="https://www.business-standard.com/article/economy-policy/russia-ukraine-crisis-to-push-up-fertiliser-prices-govt-subsidies-122030400560_1.html">click here</a> to access </p><p>Cooking oil prices spike in India due to Russia-ukraine crisis -B Krishna Mohan, TelanganaToday.com, 3 March, 2022, please <a href="https://telanganatoday.com/cooking-oil-prices-spike-in-india-due-to-russia-ukraine-crisis" title="https://telanganatoday.com/cooking-oil-prices-spike-in-india-due-to-russia-ukraine-crisis">click here</a> to access </p><p>Govt reviews cooking oil imports as ukraine crisis disrupts supplies, prices shoot up -Amiti Sen and Prabhudutta Mishra, The Hindu Business Line, 4 March, 2022, please <a href="https://www.thehindubusinessline.com/markets/commodities/govt-reviews-cooking-oil-imports-as-ukraine-crisis-disrupts-supplies-prices-shoot-up/article65190879.ece" title="https://www.thehindubusinessline.com/markets/commodities/govt-reviews-cooking-oil-imports-as-ukraine-crisis-disrupts-supplies-prices-shoot-up/article65190879.ece">click here</a> to access </p><p>India's Economy Faces A Potential Stagflation Risk From Ukraine War -Sunil Prabhu, NDTV.com, 1 March, 2022, please <a href="https://www.ndtv.com/business/indias-economy-faces-a-potential-stagflation-risk-from-ukraine-war-2796624" title="https://www.ndtv.com/business/indias-economy-faces-a-potential-stagflation-risk-from-ukraine-war-2796624">click here</a> to access</p><p>India to be one of Asia’s ‘biggest losers’ from the Ukraine war as Russia slammed by global sanctions -Paran Balakrishnan, The Telegraph, 1 March, 2022, please <a href="https://www.telegraphindia.com/business/russia-ukraine-crisis-india-to-be-one-of-asias-biggest-losers-from-the-ukraine-war-as-russia-slammed-by-global-sanctions/cid/1854032" title="https://www.telegraphindia.com/business/russia-ukraine-crisis-india-to-be-one-of-asias-biggest-losers-from-the-ukraine-war-as-russia-slammed-by-global-sanctions/cid/1854032">click here</a> to access</p><p>Crude Oil Prices Rise, Tracking Russia-Ukraine Conflict -Rahul Karunakar, NDTV.com <em>(with inputs from Agencies)</em>, 1 March, 2022, please <a href="https://www.ndtv.com/business/crude-oil-prices-rise-on-tuesday-tracking-russia-ukraine-conflict-2796187" title="https://www.ndtv.com/business/crude-oil-prices-rise-on-tuesday-tracking-russia-ukraine-conflict-2796187">click here</a> to access</p><p>Cooking Oil May Become Costlier Due to Russia-ukraine War. Know Why, News18.com, 27 February, 2022, please <a href="https://www.news18.com/news/business/markets/cooking-oil-may-become-costlier-due-to-russia-ukraine-war-know-why-4812740.html" title="https://www.news18.com/news/business/markets/cooking-oil-may-become-costlier-due-to-russia-ukraine-war-know-why-4812740.html">click here</a> to access </p><p style="text-align:justify"><strong>Image Courtesy: Inclusive Media for Change/ Shambhu Ghatak</strong></p>',
'lang' => 'English',
'SITE_URL' => 'https://im4change.in/',
'site_title' => 'im4change',
'adminprix' => 'admin'
]
$article_current = object(App\Model\Entity\Article) {
'id' => (int) 62349,
'title' => 'Real wage rates of the rural workers hardly increased during the last 6 years',
'subheading' => null,
'description' => '<p style="text-align:justify">In the absence of income or expenditure-based headcount ratio, the growth in the real wages <em>(i.e., nominal wages adjusted against retail inflation)</em> of the manual workers is considered to be a good proxy to assess the trends in poverty. This is because the manual, unskilled/ semi-skilled labourers exist at the bottom of the pyramid or economic hierarchy, and most of them belong to the social categories Scheduled Castes (SCs) and Scheduled Tribes (STs). A positive growth in their real wages <em>(or real wage rates) </em>is anticipated to improve their purchasing power <em>(i.e., income or consumption expenditure)</em> and lift them out of the poverty trap. </p>
<p style="text-align:justify">Clearly, there exists inter-state differences in nominal wage rates, growth in nominal wage rates and growth in real wage rates, which we will see in this news alert. </p>
<p style="text-align:justify">Against the backdrop of the <a href="https://www.thehindubusinessline.com/markets/commodities/govt-reviews-cooking-oil-imports-as-ukraine-crisis-disrupts-supplies-prices-shoot-up/article65190879.ece">Russia-Ukraine conflict</a>, which is anticipated to cause both <a href="https://www.ndtv.com/business/indias-economy-faces-a-potential-stagflation-risk-from-ukraine-war-2796624">food and fuel retail inflation</a> in India in the coming times, it is even more important to look at the past trends in wage rate growth of the rural workers. It should be noted that the <a href="https://public.flourish.studio/visualisation/8706137">year-on-year inflation</a> in <a href="https://public.flourish.studio/visualisation/8706137">Consumer</a> <a href="https://public.flourish.studio/visualisation/8706137">Price Index Rural</a> exceeded the <a href="https://public.flourish.studio/visualisation/8706137">year-on-year inflation</a> in <a href="https://public.flourish.studio/visualisation/8706137">CPI Urban</a> during January 2022 at the national level. Even before the beginning of Russia-Ukraine conflict <em>(i.e., during January 2022)</em>, in rural areas, <a href="https://im4change.org/upload/files/CPI%20Press%20Release%20January%202022%281%29.pdf">retail inflation rate of 20.6 percent</a> was noticed for 'oils and fats', aside from <a href="https://im4change.org/upload/files/CPI%20Press%20Release%20January%202022%281%29.pdf">8.44 percent retail inflation for 'fuel and light'</a>, <a href="https://im4change.org/upload/files/CPI%20Press%20Release%20January%202022%281%29.pdf">8.27 percent</a> for 'transport and communication', and <a href="https://im4change.org/upload/files/CPI%20Press%20Release%20January%202022%281%29.pdf">9.65 percent for 'clothing and footwear'</a>. </p>
<p style="text-align:justify">At the national level, the average daily nominal wage rate for male construction workers in rural areas during the period from 2014-15 to 2020-21 was Rs. 316.9, which was greater than that of the male non-farm workers in rural areas. The average daily nominal wage rate for male non-agricultural labourers in rural areas during the period from 2014-15 to 2020-21 was Rs. 273.8, which exceeded the average daily nominal wage rates for male farm labourers in rural areas <em>(i.e., Rs. 265.1)</em>. However, in Andhra Pradesh, Haryana, Himachal Pradesh, Jammu and Kashmir, Karnataka, Kerala, Meghalaya, Punjab, and Tripura, the average daily nominal wage rates for male agricultural labourers in rural areas during the period from 2014-15 to 2020-21 exceeded the average daily nominal wage rates for male non-farm labourers in rural areas. Please see chart-1.</p>
<p style="text-align:justify"><img alt="" src="/upload/images/Chart%201.png" style="height:670px; width:1000px" /></p>
<p style="text-align:justify"><em><strong>Notes:</strong> The average (i.e., arithmetic mean) daily nominal wage rates for various categories of workers in rural India in the period from 2014-15 to 2020-21 has been calculated by the Inclusive Media for Change staff</em></p>
<p style="text-align:justify"><em>Please <a href="https://docs.google.com/spreadsheets/d/1avu0-WtaKV2RHXtz2eiP7iS8znGVBdKC/edit?usp=sharing&ouid=112233925171588304692&rtpof=true&sd=true">click here</a> to access the data in spreadsheet format</em></p>
<p style="text-align:justify"><em><strong>Source: </strong>Handbook of Statistics on Indian States 2020-21, released in November 2021, please <a href="https://m.rbi.org.in/scripts/AnnualPublications.aspx?head=Handbook%20of%20Statistics%20on%20Indian%20States">click here</a> to access</em></p>
<p style="text-align:justify"><em>State-wise Average Daily Wage Rates in Rural India (Men - General Agricultural Labourers), RBI Handbook of Statistics on Indian States 2020-21, released in November 2021, please <a href="/upload/files/State-wise%20Average%20Daily%20Wage%20Rates%20in%20Rural%20India%20Men%20-%20General%20Agricultural%20Labourers.PDF">click here</a> to access </em></p>
<p style="text-align:justify"><em>State-wise Average Daily Wage Rates in Rural India (Men - Non-Agricultural Labourers), RBI Handbook of Statistics on Indian States 2020-21, released in November 2021, please <a href="/upload/files/State-wise%20Average%20Daily%20Wage%20Rates%20in%20Rural%20India%20Men%20-%20Non%20Agricultural%20Labourers.PDF">click here</a> to access </em></p>
<p style="text-align:justify"><em>State-wise Average Daily Wage Rates in Rural India (Men - Construction Workers), RBI Handbook of Statistics on Indian States 2020-21, released in November 2021, please <a href="/upload/files/State-wise%20Average%20Daily%20Wage%20Rates%20in%20Rural%20India%20Men%20-%20Construction%20Workers.PDF">click here</a> to access </em></p>
<p style="text-align:justify"><em>State-wise Average Inflation (CPI) - Inflation, RBI Handbook of Statistics on Indian States 2020-21, released in November 2021, please <a href="/upload/files/State-wise%20Average%20Inflation%20CPI%20-%20Inflation.PDF">click here</a> to access </em></p>
<p style="text-align:justify"><strong>---</strong></p>
<p style="text-align:justify">At the national level, the agricultural nominal wage rate grew faster than the non-farm wage rate on average for male labourers in rural areas during the period from 2015-16 to 2020-21. However, in states like Assam, Bihar, Haryana, Madhya Pradesh, Odisha, Punjab, and West Bengal, the non-farm nominal wage rates grew faster than the farm wage rates on average for male workers in rural areas during the period from 2015-16 to 2020-21. Please see chart-2. </p>
<p style="text-align:justify"><img alt="" src="/upload/images/Chart%202.png" style="height:653px; width:1000px" /></p>
<p style="text-align:justify"><em><strong>Notes: </strong>The average growth in daily nominal wage rates for various categories of workers in rural India in the period from 2015-16 to 2020-21 has been calculated by the Inclusive Media for Change staff</em></p>
<p style="text-align:justify"><em>Please <a href="https://docs.google.com/spreadsheets/d/1avu0-WtaKV2RHXtz2eiP7iS8znGVBdKC/edit?usp=sharing&ouid=112233925171588304692&rtpof=true&sd=true">click here</a> to access the data in spreadsheet format</em></p>
<p style="text-align:justify"><em><strong>Source: </strong>Same as above</em><br />
<strong>---</strong></p>
<p style="text-align:justify">At the national level, the construction sector nominal wage rate grew slower than the non-agricultural wage rate on average for male labourers in rural areas during the period from 2015-16 to 2020-21. However, in states like Andhra Pradesh, Bihar, Himachal Pradesh, Maharashtra, Meghalaya, Punjab, Tamil Nadu, and Uttar Pradesh, the construction sector nominal wage rates grew faster than the non-farm wage rates on average for male workers in rural areas during the period from 2015-16 to 2020-21. Please take a look at chart-2. </p>
<p style="text-align:justify">At the national level, the agricultural wage rate in real terms grew faster than the non-farm wage rate on average for male labourers in rural areas during the period from 2015-16 to 2020-21. However, in states like Assam, Bihar, Haryana, Madhya Pradesh, Odisha, Punjab, and West Bengal, the non-farm wage rates in real terms grew faster than the farm wage rates on average for male workers in rural areas during the period from 2015-16 to 2020-21. Please see table-1.</p>
<p style="text-align:justify"><strong>Table 1: State-wise Growth in Average Daily Wage Rates in Real terms for Male Agricultural Labourers, Male Non-Agricultural Labourers, and Male Construction Workers in Rural India, in %</strong><br />
<img alt="" src="/upload/images/Table%201%20State-wise%20Growth%20in%20Average%20Daily%20Wage%20Rates%20in%20Real%20terms%20for%20Male%20Agricultural%20Labourers%20Male%20Non-Agricultural%20Labourers%20and%20Male%20Construction%20Workers%20in%20Rural%20India%20in%20percent.png" style="height:539px; width:750px" /></p>
<p style="text-align:justify"><em><strong>Notes: </strong>The average growth in daily wage rates in real terms for various categories of workers in rural India in the period from 2015-16 to 2020-21 has been calculated by the Inclusive Media for Change staff</em></p>
<p style="text-align:justify"><em>Please <a href="https://docs.google.com/spreadsheets/d/1avu0-WtaKV2RHXtz2eiP7iS8znGVBdKC/edit?usp=sharing&ouid=112233925171588304692&rtpof=true&sd=true">click here</a> to access the data in spreadsheet format</em></p>
<p style="text-align:justify"><em><strong>Source: </strong>Same as above</em><br />
<strong>---</strong></p>
<p style="text-align:justify">At the national level, the construction sector wage rate in real terms grew slower than the non-agricultural wage rate on average for male labourers in rural areas during the period from 2015-16 to 2020-21. However, in states like Andhra Pradesh, Bihar, Himachal Pradesh, Maharashtra, Meghalaya, Punjab, Tamil Nadu, and Uttar Pradesh, the construction sector wage rates in real terms grew faster than the non-farm wage rates on average for male workers in rural areas during the period from 2015-16 to 2020-21. Please take a look at table-1. </p>
<p style="text-align:justify">In the following paragraphs, we have discussed the trends in agricultural wage rates, non-farm wage rates, and construction sector wage rates <em>(in rural areas)</em> in detail. </p>
<p style="text-align:justify"><strong>Agricultural wages in rural areas</strong></p>
<p style="text-align:justify">The highest <a href="https://im4change.org/upload/files/State%20wise%20average%20daily%20nominal%20wage%20rates%20in%20rural%20india%20men%20farm%20labourers.JPG">average daily nominal wage rate</a> <a href="https://im4change.org/upload/files/State%20wise%20average%20daily%20nominal%20wage%20rates%20in%20rural%20india%20men%20farm%20labourers.JPG">for male agricultural labourers</a> in rural India during the period from 2014-15 to 2020-21 was found in Kerala <em>(Rs. 653.93)</em>, followed by Jammu and Kashmir <em>(Rs. 429.19)</em>, Tamil Nadu <em>(Rs. 385.6)</em>, Haryana <em>(Rs. 368.53)</em>, Himachal Pradesh <em>(Rs. 366.23)</em>, and Punjab <em>(Rs. 325.31)</em>. Please have a look at chart-1.</p>
<p style="text-align:justify">The lowest <a href="https://im4change.org/upload/files/State%20wise%20average%20daily%20nominal%20wage%20rates%20in%20rural%20india%20men%20farm%20labourers.JPG">average daily nominal wage rate</a> <a href="https://im4change.org/upload/files/State%20wise%20average%20daily%20nominal%20wage%20rates%20in%20rural%20india%20men%20farm%20labourers.JPG">for male agricultural labourers</a> in rural India during the period from 2014-15 to 2020-21 was observed in Madhya Pradesh <em>(Rs. 183.97)</em>, followed by Gujarat <em>(Rs. 190.07)</em>, Maharashtra <em>(Rs. 215.71)</em>, Odisha <em>(Rs. 216.87)</em>, Meghalaya <em>(Rs. 219.93)</em>, Bihar <em>(Rs. 230.43)</em>, Uttar Pradesh <em>(Rs. 230.5)</em>, and Assam <em>(Rs. 237.3)</em>. The related national level figure was Rs. 265.09 during the period from 2014-15 to 2020-21. Please consult chart-1. </p>
<p style="text-align:justify">The highest <a href="https://im4change.org/upload/files/State%20wise%20growth%20in%20average%20daily%20nominal%20wage%20rates%20in%20rural%20india%20men%20farm%20labourers.JPG">average annual growth rate in</a> <a href="https://im4change.org/upload/files/State%20wise%20growth%20in%20average%20daily%20nominal%20wage%20rates%20in%20rural%20india%20men%20farm%20labourers.JPG">nominal wage rates</a> during the period from 2015-16 to 2020-21 was found in Karnataka <em>(7.3 percent)</em>, followed by Andhra Pradesh <em>(6.8 percent)</em>, Madhya Pradesh <em>(6.4 percent)</em>, Uttar Pradesh <em>(6.2 percent)</em>, Odisha <em>(6.1 percent)</em>, and Meghalaya <em>(6.0 percent)</em>. Please see chart-2.</p>
<p style="text-align:justify">The lowest <a href="https://im4change.org/upload/files/State%20wise%20growth%20in%20average%20daily%20nominal%20wage%20rates%20in%20rural%20india%20men%20farm%20labourers.JPG">average annual growth rate</a> <a href="https://im4change.org/upload/files/State%20wise%20growth%20in%20average%20daily%20nominal%20wage%20rates%20in%20rural%20india%20men%20farm%20labourers.JPG">in nominal wage rates</a> during the same period was noticed in Haryana <em>(2.1 percent)</em>, followed by Rajasthan <em>(3.3 percent)</em>, Kerala <em>(3.5 percent)</em>, Punjab <em>(3.9 percent)</em>, and Tamil Nadu <em>(4.5 percent)</em>. Please consult chart-2.</p>
<p style="text-align:justify">The average annual <a href="https://im4change.org/upload/files/State%20wise%20growth%20in%20average%20daily%20wage%20rates%20in%20real%20terms%20for%20male%20farm%20labourers%20in%20rural%20India.JPG">growth of agricultural labourers’</a> <a href="https://im4change.org/upload/files/State%20wise%20growth%20in%20average%20daily%20wage%20rates%20in%20real%20terms%20for%20male%20farm%20labourers%20in%20rural%20India.JPG">wage rates in real terms</a> during the period from 2015-16 to 2020-21 were negative in Haryana <em>(-2.1 percent)</em>, Jammu and Kashmir <em>(-0.3 percent)</em>, Kerala <em>(-1.7 percent)</em>, Punjab <em>(-0.4 percent)</em>, Rajasthan <em>(-1.1 percent)</em>, Tamil Nadu <em>(-0.8 percent)</em>, Tripura <em>(-0.5 percent)</em>, and West Bengal <em>(-0.1 percent)</em>. It should be noted that the <a href="https://im4change.org/upload/files/State-wise%20Average%20Inflation%20CPI%20-%20Inflation.PDF">rate of inflation</a> in <a href="https://im4change.org/upload/files/State-wise%20Average%20Inflation%20CPI%20-%20Inflation.PDF">Consumer Price Index-General</a> has been used to get the average annual growth of agricultural labourers’ wage rates in real terms. Kindly consult table-1. </p>
<p style="text-align:justify">Some states witnessed negative <a href="https://im4change.org/upload/files/State%20wise%20growth%20in%20average%20daily%20wage%20rates%20in%20real%20terms%20for%20male%20farm%20labourers%20in%20rural%20India.JPG">growth in agricultural labourers’</a> <a href="https://im4change.org/upload/files/State%20wise%20growth%20in%20average%20daily%20wage%20rates%20in%20real%20terms%20for%20male%20farm%20labourers%20in%20rural%20India.JPG">wage rates in real terms</a> for more than two years between 2015-16 and 2020-21. For example, <a href="https://im4change.org/upload/files/State%20wise%20growth%20in%20average%20daily%20wage%20rates%20in%20real%20terms%20for%20male%20farm%20labourers%20in%20rural%20India.JPG">Haryana</a> experienced negative growth in 2015-16, 2016-17, 2017-18, 2019-20, and 2020-21. Likewise, <a href="https://im4change.org/upload/files/State%20wise%20growth%20in%20average%20daily%20wage%20rates%20in%20real%20terms%20for%20male%20farm%20labourers%20in%20rural%20India.JPG">Kerala</a> faced negative growth in 2017-18, 2018-19, 2019-20, and 2020-21. </p>
<p style="text-align:justify">At the national level, the <a href="https://im4change.org/upload/files/State%20wise%20growth%20in%20average%20daily%20wage%20rates%20in%20real%20terms%20for%20male%20farm%20labourers%20in%20rural%20India.JPG">agricultural labourers’</a> <a href="https://im4change.org/upload/files/State%20wise%20growth%20in%20average%20daily%20wage%20rates%20in%20real%20terms%20for%20male%20farm%20labourers%20in%20rural%20India.JPG">wage rates in real terms</a> on average grew by 1.0 percent annually during the period from 2015-16 to 2020-21.</p>
<p style="text-align:justify">Please <a href="https://docs.google.com/spreadsheets/d/1avu0-WtaKV2RHXtz2eiP7iS8znGVBdKC/edit?usp=sharing&ouid=112233925171588304692&rtpof=true&sd=true">click here</a> to access the spreadsheet in order to look at the trends in <a href="/upload/files/State%20wise%20average%20daily%20nominal%20wage%20rates%20in%20rural%20india%20men%20farm%20labourers.JPG">nominal wage rates</a>, <a href="/upload/files/State%20wise%20growth%20in%20average%20daily%20nominal%20wage%20rates%20in%20rural%20india%20men%20farm%20labourers.JPG">annual growth in nominal wage rates</a> and <a href="/upload/files/State%20wise%20growth%20in%20average%20daily%20wage%20rates%20in%20real%20terms%20for%20male%20farm%20labourers%20in%20rural%20India.JPG">annual growth in real wage rates</a> for farm labourers in rural areas. </p>
<p style="text-align:justify"><strong>Non-agricultural wages in rural areas</strong></p>
<p style="text-align:justify">The rural economy is not just about farming any longer. That is why we have looked at the wage growth in the non-farm sector too. The highest <a href="https://im4change.org/upload/files/State%20wise%20average%20daily%20nominal%20wage%20rates%20in%20rural%20india%20men%20non%20farm%20labourers.JPG">average daily nominal wage rate for male</a> <a href="https://im4change.org/upload/files/State%20wise%20average%20daily%20nominal%20wage%20rates%20in%20rural%20india%20men%20non%20farm%20labourers.JPG">non-agricultural labourers</a> in rural India during the period from 2014-15 to 2020-21 was detected in Kerala <em>(Rs. 639.01)</em>, followed by Jammu and Kashmir <em>(Rs. 426.37)</em>, Tamil Nadu <em>(Rs. 405.77)</em>, Haryana <em>(Rs. 359.24)</em>, Himachal Pradesh <em>(Rs. 311.10)</em>, and Punjab <em>(Rs. 309.09)</em>. Please see chart-1.</p>
<p style="text-align:justify">The lowest average <a href="https://im4change.org/upload/files/State%20wise%20average%20daily%20nominal%20wage%20rates%20in%20rural%20india%20men%20non%20farm%20labourers.JPG">daily nominal wage rate for male</a> <a href="https://im4change.org/upload/files/State%20wise%20average%20daily%20nominal%20wage%20rates%20in%20rural%20india%20men%20non%20farm%20labourers.JPG">non-agricultural labourers in rural India</a> during the period from 2014-15 to 2020-21 was found in Madhya Pradesh <em>(Rs. 191.47)</em>, followed by Meghalaya <em>(Rs. 210.26)</em>, Gujarat <em>(Rs. 213.51)</em>, Odisha <em>(Rs. 218.06)</em>, Maharashtra <em>(Rs. 226.70)</em>, Tripura <em>(Rs. 230.36)</em>, Bihar <em>(Rs. 243.51)</em>, and Uttar Pradesh <em>(Rs. 243.97)</em>. The related national level figure was Rs. 273.79 during the period from 2014-15 to 2020-21. Please see chart-1.</p>
<p style="text-align:justify">The highest <a href="https://im4change.org/upload/files/State%20wise%20growth%20in%20average%20daily%20nominal%20wage%20rates%20in%20rural%20india%20men%20non%20farm%20labourers.JPG">average annual growth rate in</a> <a href="https://im4change.org/upload/files/State%20wise%20growth%20in%20average%20daily%20nominal%20wage%20rates%20in%20rural%20india%20men%20non%20farm%20labourers.JPG">nominal wage rates</a> during the period from 2015-16 to 2020-21 was noticed in Odisha <em>(8.0 percent)</em>, followed by Madhya Pradesh <em>(7.6 percent)</em>, Assam <em>(6.6 percent)</em>, West Bengal <em>(5.9 percent)</em>, Uttar Pradesh and Andhra Pradesh <em>(5.6 percent each)</em>, and Bihar <em>(5.5 percent)</em>. Kindly consult chart-2.</p>
<p style="text-align:justify">The lowest <a href="https://im4change.org/upload/files/State%20wise%20growth%20in%20average%20daily%20nominal%20wage%20rates%20in%20rural%20india%20men%20non%20farm%20labourers.JPG">average annual growth rate</a> <a href="https://im4change.org/upload/files/State%20wise%20growth%20in%20average%20daily%20nominal%20wage%20rates%20in%20rural%20india%20men%20non%20farm%20labourers.JPG">in nominal wage rates</a> during the same period was observed in Kerala <em>(1.8 percent)</em>, followed by Haryana <em>(2.4 percent)</em>, Meghalaya <em>(2.8 percent)</em>, Tamil Nadu and Rajasthan <em>(3.2 percent each)</em>, Tripura and Jammu and Kashmir <em>(4.0 percent each),</em> and Maharashtra and Punjab <em>(4.2 percent each)</em>. Kindly consult chart-2. </p>
<p style="text-align:justify">The average annual <a href="https://im4change.org/upload/files/State%20wise%20growth%20in%20average%20daily%20wage%20rates%20in%20real%20terms%20for%20male%20non%20farm%20labourers%20in%20rural%20India.JPG">growth of non-agricultural labourers’</a> <a href="https://im4change.org/upload/files/State%20wise%20growth%20in%20average%20daily%20wage%20rates%20in%20real%20terms%20for%20male%20non%20farm%20labourers%20in%20rural%20India.JPG">wage rates in real terms</a> during the period from 2015-16 to 2020-21 were negative in Haryana <em>(-1.9 percent)</em>, Jammu and Kashmir <em>(-1.7 percent)</em>, Kerala <em>(-3.5 percent)</em>, Maharashtra <em>(-0.3 percent)</em>, Meghalaya <em>(-1.2 percent)</em>, Punjab <em>(-0.1 percent)</em>, Rajasthan <em>(-1.2 percent)</em>, Tamil Nadu <em>(-2.1 percent)</em>, and Tripura <em>(-1.1 percent)</em>. It should be noted that the <a href="https://im4change.org/upload/files/State-wise%20Average%20Inflation%20CPI%20-%20Inflation.PDF">rate of inflation</a> in <a href="https://im4change.org/upload/files/State-wise%20Average%20Inflation%20CPI%20-%20Inflation.PDF">CPI-General</a> has been used to get the average annual growth of non-agricultural labourers’ wage rates in real terms. Kindly have a look at table-1. </p>
<p style="text-align:justify">Some states experienced negative growth in <a href="https://im4change.org/upload/files/State%20wise%20growth%20in%20average%20daily%20wage%20rates%20in%20real%20terms%20for%20male%20non%20farm%20labourers%20in%20rural%20India.JPG">non-agricultural labourers’ wage</a> <a href="https://im4change.org/upload/files/State%20wise%20growth%20in%20average%20daily%20wage%20rates%20in%20real%20terms%20for%20male%20non%20farm%20labourers%20in%20rural%20India.JPG">rates in real terms</a> for more than two years between 2015-16 and 2020-21. For example, <a href="https://im4change.org/upload/files/State%20wise%20growth%20in%20average%20daily%20wage%20rates%20in%20real%20terms%20for%20male%20non%20farm%20labourers%20in%20rural%20India.JPG">Haryana</a> experienced negative <a href="https://im4change.org/upload/files/State%20wise%20growth%20in%20average%20daily%20wage%20rates%20in%20real%20terms%20for%20male%20non%20farm%20labourers%20in%20rural%20India.JPG">growth in wage rates</a> <a href="https://im4change.org/upload/files/State%20wise%20growth%20in%20average%20daily%20wage%20rates%20in%20real%20terms%20for%20male%20non%20farm%20labourers%20in%20rural%20India.JPG"><em>(in real terms)</em></a> during 2016-17, 2017-18, 2018-19, 2019-20, and 2020-21. Likewise, <a href="https://im4change.org/upload/files/State%20wise%20growth%20in%20average%20daily%20wage%20rates%20in%20real%20terms%20for%20male%20non%20farm%20labourers%20in%20rural%20India.JPG">Kerala</a> faced negative growth rates in 2015-16, 2016-17, 2017-18, 2019-20, and 2020-21. </p>
<p style="text-align:justify">At the national level, the <a href="https://im4change.org/upload/files/State%20wise%20growth%20in%20average%20daily%20wage%20rates%20in%20real%20terms%20for%20male%20non%20farm%20labourers%20in%20rural%20India.JPG">non-agricultural labourers’</a> <a href="https://im4change.org/upload/files/State%20wise%20growth%20in%20average%20daily%20wage%20rates%20in%20real%20terms%20for%20male%20non%20farm%20labourers%20in%20rural%20India.JPG">wage rates in real terms</a> on average grew by just 0.3 percent annually during the period from 2015-16 to 2020-21. </p>
<p style="text-align:justify">Please <a href="https://docs.google.com/spreadsheets/d/1avu0-WtaKV2RHXtz2eiP7iS8znGVBdKC/edit?usp=sharing&ouid=112233925171588304692&rtpof=true&sd=true">click here</a> to access the spreadsheet in order to look at the <a href="/upload/files/State%20wise%20average%20daily%20nominal%20wage%20rates%20in%20rural%20india%20men%20non%20farm%20labourers.JPG">trends in nominal wage rates</a>, <a href="/upload/files/State%20wise%20growth%20in%20average%20daily%20nominal%20wage%20rates%20in%20rural%20india%20men%20non%20farm%20labourers.JPG">annual growth in nominal wage rates</a>, and <a href="/upload/files/State%20wise%20growth%20in%20average%20daily%20wage%20rates%20in%20real%20terms%20for%20male%20non%20farm%20labourers%20in%20rural%20India.JPG">annual growth in real wage rates</a> for non-farm labourers in rural areas. </p>
<p style="text-align:justify"><strong>Construction sector wages in rural areas</strong></p>
<p style="text-align:justify">The <a href="https://im4change.org/upload/files/State%20wise%20average%20daily%20nominal%20wage%20rates%20in%20rural%20india%20men%20construction%20workers.JPG">highest average daily nominal wage rates</a> <a href="https://im4change.org/upload/files/State%20wise%20average%20daily%20nominal%20wage%20rates%20in%20rural%20india%20men%20construction%20workers.JPG">for male construction workers in rural India</a> during the period from 2014-15 to 2020-21 was detected in Kerala <em>(Rs. 810.3)</em>, followed by Jammu and Kashmir <em>(Rs. 445.1)</em>, Tamil Nadu <em>(Rs. 424.1)</em>, Haryana <em>(Rs. 379.9)</em>, Himachal Pradesh <em>(Rs. 368.7)</em>, Rajasthan <em>(Rs. 347.7)</em>, and Punjab <em>(Rs. 339.1)</em>. Kindly see chart-1. </p>
<p style="text-align:justify">The <a href="https://im4change.org/upload/files/State%20wise%20average%20daily%20nominal%20wage%20rates%20in%20rural%20india%20men%20construction%20workers.JPG">lowest average daily nominal wage rates</a> <a href="https://im4change.org/upload/files/State%20wise%20average%20daily%20nominal%20wage%20rates%20in%20rural%20india%20men%20construction%20workers.JPG">for male construction workers in rural areas</a> during the period from 2014-15 to 2020-21 was found in Madhya Pradesh <em>(Rs. 212.4)</em>, followed by Tripura <em>(Rs. 230.4)</em>, Meghalaya <em>(Rs. 231.7)</em>, Odisha <em>(Rs. 247.1)</em>, Gujarat <em>(Rs. 251.8)</em>, Uttar Pradesh <em>(Rs. 267.4)</em>, Bihar <em>(Rs. 270.8)</em>, and West Bengal <em>(Rs. 274.0)</em>. The related national level figure was Rs. 316.9 during the period from 2014-15 to 2020-21. Kindly consult chart-1.</p>
<p style="text-align:justify">The <a href="https://im4change.org/upload/files/State%20wise%20growth%20in%20average%20daily%20nominal%20wage%20rates%20in%20rural%20india%20men%20construction%20workers.JPG">highest average annual growth rates in</a> <a href="https://im4change.org/upload/files/State%20wise%20growth%20in%20average%20daily%20nominal%20wage%20rates%20in%20rural%20india%20men%20construction%20workers.JPG">nominal wage rates</a> during the period from 2015-16 to 2020-21 was noticed in Meghalaya <em>(20.9 percent)</em>, followed by Madhya Pradesh <em>(7.4 percent)</em>, Odisha and Andhra Pradesh <em>(6.8 percent each)</em>, Uttar Pradesh <em>(6.4 percent)</em>, and Bihar <em>(6.2 percent)</em>. Please see chart-2. </p>
<p style="text-align:justify">The <a href="https://im4change.org/upload/files/State%20wise%20growth%20in%20average%20daily%20nominal%20wage%20rates%20in%20rural%20india%20men%20construction%20workers.JPG">lowest average annual growth rates in</a> <a href="https://im4change.org/upload/files/State%20wise%20growth%20in%20average%20daily%20nominal%20wage%20rates%20in%20rural%20india%20men%20construction%20workers.JPG">nominal wage rates</a> during the same period was observed in Kerala <em>(0.9 percent)</em>, followed by Manipur <em>(2.0 percent)</em>, Haryana <em>(2.1 percent)</em>, Jammu and Kashmir <em>(3.0 percent)</em>, Rajasthan <em>(3.2 percent)</em>, and Gujarat <em>(3.6 percent)</em>. Please see chart-2.</p>
<p style="text-align:justify">The <a href="https://im4change.org/upload/files/State%20wise%20growth%20in%20average%20daily%20wage%20rates%20in%20real%20terms%20for%20male%20construction%20workers%20in%20rural%20India%281%29.JPG">average annual growth of construction workers’</a> <a href="https://im4change.org/upload/files/State%20wise%20growth%20in%20average%20daily%20wage%20rates%20in%20real%20terms%20for%20male%20construction%20workers%20in%20rural%20India%281%29.JPG">wage rates in real terms</a> during the period from 2015-16 to 2020-21 was negative in Assam <em>(-1.2 percent)</em>, Haryana <em>(-2.1 percent)</em>, Jammu and Kashmir <em>(-2.7 percent)</em>, Karnataka <em>(-0.6 percent)</em>, Kerala <em>(-4.4 percent)</em>, Manipur <em>(-6.3 percent)</em>, Rajasthan <em>(-1.2 percent)</em>, Tamil Nadu <em>(-0.9 percent)</em>, and Tripura <em>(-1.1 percent)</em>. Please note that the <a href="https://im4change.org/upload/files/State-wise%20Average%20Inflation%20CPI%20-%20Inflation.PDF">rate of inflation</a> in <a href="https://im4change.org/upload/files/State-wise%20Average%20Inflation%20CPI%20-%20Inflation.PDF">CPI-General</a> has been used to get the average annual growth of construction workers’ wage rates in real terms. Kindly have a look at table-1. </p>
<p style="text-align:justify">In the case of Meghalaya, the <a href="https://im4change.org/upload/files/State%20wise%20average%20daily%20nominal%20wage%20rates%20in%20rural%20india%20men%20construction%20workers.JPG">nominal daily wage rate of male construction</a> <a href="https://im4change.org/upload/files/State%20wise%20average%20daily%20nominal%20wage%20rates%20in%20rural%20india%20men%20construction%20workers.JPG">workers</a> fell from Rs. 186.0 in 2016-17 to Rs. 100.0 in 2017-18 i.e., a decline by -46.2 percent over previous year. However, the same bounced back to Rs. 273.2 in 2018-19 i.e., an increase by 173.2 percent over previous year. In <a href="https://im4change.org/upload/files/State%20wise%20growth%20in%20average%20daily%20wage%20rates%20in%20real%20terms%20for%20male%20construction%20workers%20in%20rural%20India%281%29.JPG">real terms, the construction sector</a> <a href="https://im4change.org/upload/files/State%20wise%20growth%20in%20average%20daily%20wage%20rates%20in%20real%20terms%20for%20male%20construction%20workers%20in%20rural%20India%281%29.JPG">wage rate in Meghalaya</a> grew by -47.7 percent in 2017-18 <em>(over previous year)</em> and 171.0 percent in 2018-19 <em>(over previous year)</em>.</p>
<p style="text-align:justify">Some states experienced negative <a href="https://im4change.org/upload/files/State%20wise%20growth%20in%20average%20daily%20wage%20rates%20in%20real%20terms%20for%20male%20construction%20workers%20in%20rural%20India%281%29.JPG">growth in construction workers’</a> <a href="https://im4change.org/upload/files/State%20wise%20growth%20in%20average%20daily%20wage%20rates%20in%20real%20terms%20for%20male%20construction%20workers%20in%20rural%20India%281%29.JPG">wage rates in real terms</a> for more than two years between 2015-16 and 2020-21. For example, <a href="https://im4change.org/upload/files/State%20wise%20growth%20in%20average%20daily%20wage%20rates%20in%20real%20terms%20for%20male%20construction%20workers%20in%20rural%20India%281%29.JPG">Assam</a> experienced negative growth in wage rates <em>(in real terms)</em> during 2017-18, 2018-19, 2019-20, and 2020-21. </p>
<p style="text-align:justify">At the national level, the <a href="https://im4change.org/upload/files/State%20wise%20growth%20in%20average%20daily%20wage%20rates%20in%20real%20terms%20for%20male%20construction%20workers%20in%20rural%20India%281%29.JPG">construction workers’ wage rates in real terms</a> on average grew by just 0.1 percent annually during the period from 2015-16 to 2020-21.</p>
<p style="text-align:justify">Kindly <a href="https://docs.google.com/spreadsheets/d/1avu0-WtaKV2RHXtz2eiP7iS8znGVBdKC/edit?usp=sharing&ouid=112233925171588304692&rtpof=true&sd=true">click here</a> to access the spreadsheet in order to look at the <a href="/upload/files/State%20wise%20average%20daily%20nominal%20wage%20rates%20in%20rural%20india%20men%20construction%20workers.JPG">trends in nominal wage rates</a>, <a href="/upload/files/State%20wise%20growth%20in%20average%20daily%20nominal%20wage%20rates%20in%20rural%20india%20men%20construction%20workers.JPG">annual growth in nominal wage rates</a>, and <a href="/upload/files/State%20wise%20growth%20in%20average%20daily%20wage%20rates%20in%20real%20terms%20for%20male%20construction%20workers%20in%20rural%20India%281%29.JPG">annual growth in real wage rates</a> for construction workers in rural areas. </p>
<p style="text-align:justify"><strong>Data collection methodology</strong></p>
<p style="text-align:justify">As a part of Rural Labour Enquiry, the <a href="https://im4change.org/upload/files/ilj_feb_2013.pdf">daily wage rates</a> in respect of eighteen agricultural and non-agricultural occupations are being collected along with rural retail price data by the Field Operations Division of the National Sample Survey Organisation since 1986-87, according to a February 2013 <a href="https://im4change.org/upload/files/ilj_feb_2013.pdf">edition of the Indian Labour Journal</a>. On the recommendations of the Governing Council of the National Sample Survey Organisation in its 61st meeting, the <a href="https://im4change.org/upload/files/ilj_feb_2013.pdf">Labour Bureau</a> started the compilation and analysis of wage rate data with effect from April, 1998. </p>
<p style="text-align:justify">The Field Operations Division of the National Sample Survey Organisation has been entrusted with the work of <a href="https://im4change.org/upload/files/METHOLOGY%20FOR%20COMPILATION%20OF%20THE%20WAGE%20RATE%20DATA.pdf">data collection</a>. The <a href="https://im4change.org/upload/files/METHOLOGY%20FOR%20COMPILATION%20OF%20THE%20WAGE%20RATE%20DATA.pdf">wage rate data</a> are being collected along with rural retail prices from 600 sample villages spread over 66 NSS regions of 20 States by canvassing Block-5 <em>(Annexure-I)</em> of Schedule 3.01(R). The data collection from these sample villages is staggered over the four weeks of a month with one-fourth of them being covered every week. The days of canvassing of Schedule 3.01(R) are fixed. The village functionaries like the Panchayat Secretary, Progress Assistant, Patwari and other Village or Block Officials are the primary informants for collection of data on wage rates. The data on normal working hours and the prevailing wage rates in cash and kind for the reported working hours are collected sex-wise for each of the 18 selected occupations in 20 states, indicates an old <a href="https://im4change.org/upload/files/METHOLOGY%20FOR%20COMPILATION%20OF%20THE%20WAGE%20RATE%20DATA.pdf">document</a> of the Labour Bureau. </p>
<p style="text-align:justify">The wage rates are sometimes reported for a duration that is less/more than the normal working hours. In such cases, they are <a href="https://im4change.org/upload/files/METHOLOGY%20FOR%20COMPILATION%20OF%20THE%20WAGE%20RATE%20DATA.pdf">first normalised for eight hours</a> working day. As regards the mode of payment of wages, it is made in both ways i.e., in cash and/or in kind. The payments made in kind are very common in rural areas, which include foodgrains, cooked food, tea, fuel, cigarette, beedi, fodder, etc. The wages reported in kind are evaluated at local retail prices. Thereafter, the data is thoroughly scrutinised and discrepant points are referred back to the field for clarification. In the next stage, the simple arithmetic average of these normalised daily wage rates is worked out occupation-wise and sex-wise for each state.</p>
<p style="text-align:justify"><a href="http://ras.org.in/methodology_of_data_collection_unsuited_to_changing_rural_reality">Up to June 2000</a>, the average wage rates at the national level were derived by taking the simple average of state figures; since July 2000, the averages have been obtained by dividing the sum total of wages of all 20 states by the number of centres or villages from which data were collected. The state-wise averages are restricted only to those occupations where the number of centres is five or more to avoid abnormal fluctuations and inconsistency in wages paid to different categories of workers on account of varying numbers of centres. However, in order to calculate the all-India averages, all neglected centres are taken into account to arrive at the total number of centres at the national level.</p>
<p style="text-align:justify">The <a href="/upload/files/RBI%20note%20Average%20Daily%20Wage%20rate%20Methodology.pdf">Reserve Bank of India</a> <em>(whose data we have used in writing this news alert)</em> has collated and is releasing monthly time series data on rural wage rates based on the data published by the Labour Bureau, Government of India. Starting from November 2013 the Labour Bureau is collecting the rural wage data in respect of 12 agricultural and 13 non-agricultural occupations across 20 major states, namely, Andhra Pradesh, Assam, Bihar, Gujarat, Haryana, Himachal Pradesh, Jammu & Kashmir, Karnataka, Kerala, Madhya Pradesh, Maharashtra, Manipur, Meghalaya, Orissa, Punjab, Rajasthan, Tamil Nadu, Tripura, Uttar Pradesh and West Bengal. The occupations for which the daily wage rates are collected every month are: <u>(A) Agricultural occupations</u> – (1) Ploughing/ Tilling workers, (2) Sowing <em>(including planting/ Transplanting/ Weeding)</em> workers, (3) Harvesting/ Winnowing/ Threshing workers, (4) Picking workers <em>(including Tea, Cotton, Tobacco and other commercial crops)</em>, (5) Horticulture workers <em>(including nursery growers)</em>, (6) Fishermen-inland, (7) Fishermen coastal/deep-sea, (8) Loggers and wood cutters, (9) Animal husbandry workers <em>(including poultry workers, dairy workers and herdsman)</em>, (10) Packaging labourers, agriculture, (11) General agricultural labourers <em>(including watering/ irrigation workers, etc.)</em>, (12) Plant protection workers <em>(applying pesticides, treating seeds, etc.)</em>; and <u>(B) Non-agricultural occupations</u> – (13) Carpenter, (14) Blacksmith, (15) Mason, (16) Weavers, (17) Beedi makers, (18) Bamboo, cane basket weavers, (19) Handicraft workers, (20) Plumbers, (21) Electrician, (22) Construction workers <em>(for roads, dams, industrial & project construction work and Well diggers)</em>, (23) LMV & Tractor drivers, (24) Non-agricultural labourers <em>(including porters, loaders)</em>, and (25) Sweeping/cleaning workers. </p>
<p style="text-align:justify"><strong><em>References </em></strong></p>
<p style="text-align:justify">Handbook of Statistics on Indian States 2020-21, released in November 2021, please <a href="https://m.rbi.org.in/scripts/AnnualPublications.aspx?head=Handbook%20of%20Statistics%20on%20Indian%20States">click here</a> to access</p>
<p style="text-align:justify">State-wise Average Daily Wage Rates in Rural India (Men - General Agricultural Labourers), RBI Handbook of Statistics on Indian States 2020-21, released in November 2021, please <a href="/upload/files/State-wise%20Average%20Daily%20Wage%20Rates%20in%20Rural%20India%20Men%20-%20General%20Agricultural%20Labourers.PDF">click here</a> to access </p>
<p style="text-align:justify">State-wise Average Daily Wage Rates in Rural India (Men - Non-Agricultural Labourers), RBI Handbook of Statistics on Indian States 2020-21, released in November 2021, please <a href="/upload/files/State-wise%20Average%20Daily%20Wage%20Rates%20in%20Rural%20India%20Men%20-%20Non%20Agricultural%20Labourers.PDF">click here</a> to access </p>
<p style="text-align:justify">State-wise Average Daily Wage Rates in Rural India (Men - Construction Workers), RBI Handbook of Statistics on Indian States 2020-21, released in November 2021, please <a href="/upload/files/State-wise%20Average%20Daily%20Wage%20Rates%20in%20Rural%20India%20Men%20-%20Construction%20Workers.PDF">click here</a> to access </p>
<p style="text-align:justify">State-wise Average Inflation (CPI) - Inflation, RBI Handbook of Statistics on Indian States 2020-21, released in November 2021, please <a href="/upload/files/State-wise%20Average%20Inflation%20CPI%20-%20Inflation.PDF">click here</a> to access </p>
<p style="text-align:justify">Indian Labour Journal, February 2013, please <a href="/upload/files/ilj_feb_2013.pdf">click here</a> to access </p>
<p style="text-align:justify">Wage Rates in Rural India 2003-04: Methodology for Compilation of the Wage Rate Data, Labour Bureau, please <a href="/upload/files/METHOLOGY%20FOR%20COMPILATION%20OF%20THE%20WAGE%20RATE%20DATA.pdf">click here</a> to access </p>
<p style="text-align:justify">Average Daily Wage Rates in Rural India: Methodology and coverage (From November 2013), Reserve Bank of India, please <a href="https://dbie.rbi.org.in">click here</a> and <a href="/upload/files/RBI%20note%20Average%20Daily%20Wage%20rate%20Methodology%281%29.pdf">here</a> to access </p>
<p style="text-align:justify">Consumer Price Index Numbers on Base 2012=100 for Rural, Urban and Combined for the month of January 2022, Ministry of Statistics and Programme Implementation (MoSPI), National Statistical Office (NSO), released on 14th February 2022, please <a href="/upload/files/CPI%20Press%20Release%20January%202022%281%29.pdf">click here</a> to access </p>
<p style="text-align:justify">Methodology of Data Collection Unsuited to Changing Rural Reality: A Study of Agricultural Wage Data in India -Yoshifumi Usami, Arindam Das, and Madhura Swaminathan, Review of Agrarian Studies, Vol. 10, No. 2, July-December, 2020, please <a href="http://ras.org.in/methodology_of_data_collection_unsuited_to_changing_rural_reality">click here</a> to access</p>
<p>Russia-ukraine crisis to push up fertiliser prices, govt subsidies, IANS/ Business Standard, 4 March, 2022, please <a href="https://www.business-standard.com/article/economy-policy/russia-ukraine-crisis-to-push-up-fertiliser-prices-govt-subsidies-122030400560_1.html">click here</a> to access </p>
<p>Cooking oil prices spike in India due to Russia-ukraine crisis -B Krishna Mohan, TelanganaToday.com, 3 March, 2022, please <a href="https://telanganatoday.com/cooking-oil-prices-spike-in-india-due-to-russia-ukraine-crisis">click here</a> to access </p>
<p>Govt reviews cooking oil imports as ukraine crisis disrupts supplies, prices shoot up -Amiti Sen and Prabhudutta Mishra, The Hindu Business Line, 4 March, 2022, please <a href="https://www.thehindubusinessline.com/markets/commodities/govt-reviews-cooking-oil-imports-as-ukraine-crisis-disrupts-supplies-prices-shoot-up/article65190879.ece">click here</a> to access </p>
<p>India's Economy Faces A Potential Stagflation Risk From Ukraine War -Sunil Prabhu, NDTV.com, 1 March, 2022, please <a href="https://www.ndtv.com/business/indias-economy-faces-a-potential-stagflation-risk-from-ukraine-war-2796624">click here</a> to access</p>
<p>India to be one of Asia’s ‘biggest losers’ from the Ukraine war as Russia slammed by global sanctions -Paran Balakrishnan, The Telegraph, 1 March, 2022, please <a href="https://www.telegraphindia.com/business/russia-ukraine-crisis-india-to-be-one-of-asias-biggest-losers-from-the-ukraine-war-as-russia-slammed-by-global-sanctions/cid/1854032">click here</a> to access</p>
<p>Crude Oil Prices Rise, Tracking Russia-Ukraine Conflict -Rahul Karunakar, NDTV.com <em>(with inputs from Agencies)</em>, 1 March, 2022, please <a href="https://www.ndtv.com/business/crude-oil-prices-rise-on-tuesday-tracking-russia-ukraine-conflict-2796187">click here</a> to access</p>
<p>Cooking Oil May Become Costlier Due to Russia-ukraine War. Know Why, News18.com, 27 February, 2022, please <a href="https://www.news18.com/news/business/markets/cooking-oil-may-become-costlier-due-to-russia-ukraine-war-know-why-4812740.html">click here</a> to access </p>
<p style="text-align:justify"><strong>Image Courtesy: Inclusive Media for Change/ Shambhu Ghatak</strong></p>
',
'credit_writer' => '',
'article_img' => 'Image construction worker 11 Mar 2022.jpg',
'article_img_thumb' => 'Image construction worker 11 Mar 2022.jpg',
'status' => (int) 1,
'show_on_home' => (int) 1,
'lang' => 'EN',
'category_id' => (int) 4,
'tag_keyword' => '',
'seo_url' => 'real-wage-rates-of-the-rural-workers-hardly-increased-during-the-past-6-years',
'meta_title' => '',
'meta_keywords' => '',
'meta_description' => '',
'noindex' => (int) 1,
'publish_date' => object(Cake\I18n\FrozenDate) {},
'most_visit_section_id' => null,
'article_big_img' => null,
'liveid' => null,
'created' => object(Cake\I18n\FrozenTime) {},
'modified' => object(Cake\I18n\FrozenTime) {},
'edate' => '',
'tags' => [
(int) 0 => object(Cake\ORM\Entity) {},
(int) 1 => object(Cake\ORM\Entity) {},
(int) 2 => object(Cake\ORM\Entity) {},
(int) 3 => object(Cake\ORM\Entity) {},
(int) 4 => object(Cake\ORM\Entity) {},
(int) 5 => object(Cake\ORM\Entity) {},
(int) 6 => object(Cake\ORM\Entity) {},
(int) 7 => object(Cake\ORM\Entity) {},
(int) 8 => object(Cake\ORM\Entity) {},
(int) 9 => object(Cake\ORM\Entity) {},
(int) 10 => object(Cake\ORM\Entity) {},
(int) 11 => object(Cake\ORM\Entity) {},
(int) 12 => object(Cake\ORM\Entity) {},
(int) 13 => object(Cake\ORM\Entity) {},
(int) 14 => object(Cake\ORM\Entity) {},
(int) 15 => object(Cake\ORM\Entity) {},
(int) 16 => object(Cake\ORM\Entity) {}
],
'category' => object(App\Model\Entity\Category) {},
'[new]' => false,
'[accessible]' => [
'*' => true,
'id' => false
],
'[dirty]' => [],
'[original]' => [],
'[virtual]' => [],
'[hasErrors]' => false,
'[errors]' => [],
'[invalid]' => [],
'[repository]' => 'Articles'
}
$articleid = (int) 62349
$metaTitle = 'NEWS ALERTS | Real wage rates of the rural workers hardly increased during the last 6 years'
$metaKeywords = 'Construction Workers,Consumer Price Index,CPI Rural,CPI Urban,Farm Labourers,Farm Workers,Food Inflation,Food Prices,Fuel Inflation,Fuel Prices,Nominal Wage Rate,Non-Farm Labourers,Non-Farm Workers,Real Wage Growth,Real Wages,Retail Inflation,Rural Workers'
$metaDesc = 'In the absence of income or expenditure-based headcount ratio, the growth in the real wages (i.e., nominal wages adjusted against retail inflation) of the manual workers is considered to be a good proxy to assess the trends in poverty. This...'
$disp = '<p style="text-align:justify">In the absence of income or expenditure-based headcount ratio, the growth in the real wages <em>(i.e., nominal wages adjusted against retail inflation)</em> of the manual workers is considered to be a good proxy to assess the trends in poverty. This is because the manual, unskilled/ semi-skilled labourers exist at the bottom of the pyramid or economic hierarchy, and most of them belong to the social categories Scheduled Castes (SCs) and Scheduled Tribes (STs). A positive growth in their real wages <em>(or real wage rates) </em>is anticipated to improve their purchasing power <em>(i.e., income or consumption expenditure)</em> and lift them out of the poverty trap. </p><p style="text-align:justify">Clearly, there exists inter-state differences in nominal wage rates, growth in nominal wage rates and growth in real wage rates, which we will see in this news alert. </p><p style="text-align:justify">Against the backdrop of the <a href="https://www.thehindubusinessline.com/markets/commodities/govt-reviews-cooking-oil-imports-as-ukraine-crisis-disrupts-supplies-prices-shoot-up/article65190879.ece" title="https://www.thehindubusinessline.com/markets/commodities/govt-reviews-cooking-oil-imports-as-ukraine-crisis-disrupts-supplies-prices-shoot-up/article65190879.ece">Russia-Ukraine conflict</a>, which is anticipated to cause both <a href="https://www.ndtv.com/business/indias-economy-faces-a-potential-stagflation-risk-from-ukraine-war-2796624" title="https://www.ndtv.com/business/indias-economy-faces-a-potential-stagflation-risk-from-ukraine-war-2796624">food and fuel retail inflation</a> in India in the coming times, it is even more important to look at the past trends in wage rate growth of the rural workers. It should be noted that the <a href="https://public.flourish.studio/visualisation/8706137" title="https://public.flourish.studio/visualisation/8706137">year-on-year inflation</a> in <a href="https://public.flourish.studio/visualisation/8706137" title="https://public.flourish.studio/visualisation/8706137">Consumer</a> <a href="https://public.flourish.studio/visualisation/8706137" title="https://public.flourish.studio/visualisation/8706137">Price Index Rural</a> exceeded the <a href="https://public.flourish.studio/visualisation/8706137" title="https://public.flourish.studio/visualisation/8706137">year-on-year inflation</a> in <a href="https://public.flourish.studio/visualisation/8706137" title="https://public.flourish.studio/visualisation/8706137">CPI Urban</a> during January 2022 at the national level. Even before the beginning of Russia-Ukraine conflict <em>(i.e., during January 2022)</em>, in rural areas, <a href="https://im4change.org/upload/files/CPI%20Press%20Release%20January%202022%281%29.pdf" title="https://im4change.org/upload/files/CPI%20Press%20Release%20January%202022%281%29.pdf">retail inflation rate of 20.6 percent</a> was noticed for 'oils and fats', aside from <a href="https://im4change.org/upload/files/CPI%20Press%20Release%20January%202022%281%29.pdf" title="https://im4change.org/upload/files/CPI%20Press%20Release%20January%202022%281%29.pdf">8.44 percent retail inflation for 'fuel and light'</a>, <a href="https://im4change.org/upload/files/CPI%20Press%20Release%20January%202022%281%29.pdf" title="https://im4change.org/upload/files/CPI%20Press%20Release%20January%202022%281%29.pdf">8.27 percent</a> for 'transport and communication', and <a href="https://im4change.org/upload/files/CPI%20Press%20Release%20January%202022%281%29.pdf" title="https://im4change.org/upload/files/CPI%20Press%20Release%20January%202022%281%29.pdf">9.65 percent for 'clothing and footwear'</a>. </p><p style="text-align:justify">At the national level, the average daily nominal wage rate for male construction workers in rural areas during the period from 2014-15 to 2020-21 was Rs. 316.9, which was greater than that of the male non-farm workers in rural areas. The average daily nominal wage rate for male non-agricultural labourers in rural areas during the period from 2014-15 to 2020-21 was Rs. 273.8, which exceeded the average daily nominal wage rates for male farm labourers in rural areas <em>(i.e., Rs. 265.1)</em>. However, in Andhra Pradesh, Haryana, Himachal Pradesh, Jammu and Kashmir, Karnataka, Kerala, Meghalaya, Punjab, and Tripura, the average daily nominal wage rates for male agricultural labourers in rural areas during the period from 2014-15 to 2020-21 exceeded the average daily nominal wage rates for male non-farm labourers in rural areas. Please see chart-1.</p><p style="text-align:justify"><img alt="" src="/upload/images/Chart%201.png" style="height:670px; width:1000px" /></p><p style="text-align:justify"><em><strong>Notes:</strong> The average (i.e., arithmetic mean) daily nominal wage rates for various categories of workers in rural India in the period from 2014-15 to 2020-21 has been calculated by the Inclusive Media for Change staff</em></p><p style="text-align:justify"><em>Please <a href="https://docs.google.com/spreadsheets/d/1avu0-WtaKV2RHXtz2eiP7iS8znGVBdKC/edit?usp=sharing&ouid=112233925171588304692&rtpof=true&sd=true" title="https://docs.google.com/spreadsheets/d/1avu0-WtaKV2RHXtz2eiP7iS8znGVBdKC/edit?usp=sharing&ouid=112233925171588304692&rtpof=true&sd=true">click here</a> to access the data in spreadsheet format</em></p><p style="text-align:justify"><em><strong>Source: </strong>Handbook of Statistics on Indian States 2020-21, released in November 2021, please <a href="https://m.rbi.org.in/scripts/AnnualPublications.aspx?head=Handbook%20of%20Statistics%20on%20Indian%20States" title="https://m.rbi.org.in/scripts/AnnualPublications.aspx?head=Handbook%20of%20Statistics%20on%20Indian%20States">click here</a> to access</em></p><p style="text-align:justify"><em>State-wise Average Daily Wage Rates in Rural India (Men - General Agricultural Labourers), RBI Handbook of Statistics on Indian States 2020-21, released in November 2021, please <a href="/upload/files/State-wise%20Average%20Daily%20Wage%20Rates%20in%20Rural%20India%20Men%20-%20General%20Agricultural%20Labourers.PDF" title="/upload/files/State-wise%20Average%20Daily%20Wage%20Rates%20in%20Rural%20India%20Men%20-%20General%20Agricultural%20Labourers.PDF">click here</a> to access </em></p><p style="text-align:justify"><em>State-wise Average Daily Wage Rates in Rural India (Men - Non-Agricultural Labourers), RBI Handbook of Statistics on Indian States 2020-21, released in November 2021, please <a href="/upload/files/State-wise%20Average%20Daily%20Wage%20Rates%20in%20Rural%20India%20Men%20-%20Non%20Agricultural%20Labourers.PDF" title="/upload/files/State-wise%20Average%20Daily%20Wage%20Rates%20in%20Rural%20India%20Men%20-%20Non%20Agricultural%20Labourers.PDF">click here</a> to access </em></p><p style="text-align:justify"><em>State-wise Average Daily Wage Rates in Rural India (Men - Construction Workers), RBI Handbook of Statistics on Indian States 2020-21, released in November 2021, please <a href="/upload/files/State-wise%20Average%20Daily%20Wage%20Rates%20in%20Rural%20India%20Men%20-%20Construction%20Workers.PDF" title="/upload/files/State-wise%20Average%20Daily%20Wage%20Rates%20in%20Rural%20India%20Men%20-%20Construction%20Workers.PDF">click here</a> to access </em></p><p style="text-align:justify"><em>State-wise Average Inflation (CPI) - Inflation, RBI Handbook of Statistics on Indian States 2020-21, released in November 2021, please <a href="/upload/files/State-wise%20Average%20Inflation%20CPI%20-%20Inflation.PDF" title="/upload/files/State-wise%20Average%20Inflation%20CPI%20-%20Inflation.PDF">click here</a> to access </em></p><p style="text-align:justify"><strong>---</strong></p><p style="text-align:justify">At the national level, the agricultural nominal wage rate grew faster than the non-farm wage rate on average for male labourers in rural areas during the period from 2015-16 to 2020-21. However, in states like Assam, Bihar, Haryana, Madhya Pradesh, Odisha, Punjab, and West Bengal, the non-farm nominal wage rates grew faster than the farm wage rates on average for male workers in rural areas during the period from 2015-16 to 2020-21. Please see chart-2. </p><p style="text-align:justify"><img alt="" src="/upload/images/Chart%202.png" style="height:653px; width:1000px" /></p><p style="text-align:justify"><em><strong>Notes: </strong>The average growth in daily nominal wage rates for various categories of workers in rural India in the period from 2015-16 to 2020-21 has been calculated by the Inclusive Media for Change staff</em></p><p style="text-align:justify"><em>Please <a href="https://docs.google.com/spreadsheets/d/1avu0-WtaKV2RHXtz2eiP7iS8znGVBdKC/edit?usp=sharing&ouid=112233925171588304692&rtpof=true&sd=true" title="https://docs.google.com/spreadsheets/d/1avu0-WtaKV2RHXtz2eiP7iS8znGVBdKC/edit?usp=sharing&ouid=112233925171588304692&rtpof=true&sd=true">click here</a> to access the data in spreadsheet format</em></p><p style="text-align:justify"><em><strong>Source: </strong>Same as above</em><br /><strong>---</strong></p><p style="text-align:justify">At the national level, the construction sector nominal wage rate grew slower than the non-agricultural wage rate on average for male labourers in rural areas during the period from 2015-16 to 2020-21. However, in states like Andhra Pradesh, Bihar, Himachal Pradesh, Maharashtra, Meghalaya, Punjab, Tamil Nadu, and Uttar Pradesh, the construction sector nominal wage rates grew faster than the non-farm wage rates on average for male workers in rural areas during the period from 2015-16 to 2020-21. Please take a look at chart-2. </p><p style="text-align:justify">At the national level, the agricultural wage rate in real terms grew faster than the non-farm wage rate on average for male labourers in rural areas during the period from 2015-16 to 2020-21. However, in states like Assam, Bihar, Haryana, Madhya Pradesh, Odisha, Punjab, and West Bengal, the non-farm wage rates in real terms grew faster than the farm wage rates on average for male workers in rural areas during the period from 2015-16 to 2020-21. Please see table-1.</p><p style="text-align:justify"><strong>Table 1: State-wise Growth in Average Daily Wage Rates in Real terms for Male Agricultural Labourers, Male Non-Agricultural Labourers, and Male Construction Workers in Rural India, in %</strong><br /><img alt="" src="/upload/images/Table%201%20State-wise%20Growth%20in%20Average%20Daily%20Wage%20Rates%20in%20Real%20terms%20for%20Male%20Agricultural%20Labourers%20Male%20Non-Agricultural%20Labourers%20and%20Male%20Construction%20Workers%20in%20Rural%20India%20in%20percent.png" style="height:539px; width:750px" /></p><p style="text-align:justify"><em><strong>Notes: </strong>The average growth in daily wage rates in real terms for various categories of workers in rural India in the period from 2015-16 to 2020-21 has been calculated by the Inclusive Media for Change staff</em></p><p style="text-align:justify"><em>Please <a href="https://docs.google.com/spreadsheets/d/1avu0-WtaKV2RHXtz2eiP7iS8znGVBdKC/edit?usp=sharing&ouid=112233925171588304692&rtpof=true&sd=true" title="https://docs.google.com/spreadsheets/d/1avu0-WtaKV2RHXtz2eiP7iS8znGVBdKC/edit?usp=sharing&ouid=112233925171588304692&rtpof=true&sd=true">click here</a> to access the data in spreadsheet format</em></p><p style="text-align:justify"><em><strong>Source: </strong>Same as above</em><br /><strong>---</strong></p><p style="text-align:justify">At the national level, the construction sector wage rate in real terms grew slower than the non-agricultural wage rate on average for male labourers in rural areas during the period from 2015-16 to 2020-21. However, in states like Andhra Pradesh, Bihar, Himachal Pradesh, Maharashtra, Meghalaya, Punjab, Tamil Nadu, and Uttar Pradesh, the construction sector wage rates in real terms grew faster than the non-farm wage rates on average for male workers in rural areas during the period from 2015-16 to 2020-21. Please take a look at table-1. </p><p style="text-align:justify">In the following paragraphs, we have discussed the trends in agricultural wage rates, non-farm wage rates, and construction sector wage rates <em>(in rural areas)</em> in detail. </p><p style="text-align:justify"><strong>Agricultural wages in rural areas</strong></p><p style="text-align:justify">The highest <a href="https://im4change.org/upload/files/State%20wise%20average%20daily%20nominal%20wage%20rates%20in%20rural%20india%20men%20farm%20labourers.JPG" title="https://im4change.org/upload/files/State%20wise%20average%20daily%20nominal%20wage%20rates%20in%20rural%20india%20men%20farm%20labourers.JPG">average daily nominal wage rate</a> <a href="https://im4change.org/upload/files/State%20wise%20average%20daily%20nominal%20wage%20rates%20in%20rural%20india%20men%20farm%20labourers.JPG" title="https://im4change.org/upload/files/State%20wise%20average%20daily%20nominal%20wage%20rates%20in%20rural%20india%20men%20farm%20labourers.JPG">for male agricultural labourers</a> in rural India during the period from 2014-15 to 2020-21 was found in Kerala <em>(Rs. 653.93)</em>, followed by Jammu and Kashmir <em>(Rs. 429.19)</em>, Tamil Nadu <em>(Rs. 385.6)</em>, Haryana <em>(Rs. 368.53)</em>, Himachal Pradesh <em>(Rs. 366.23)</em>, and Punjab <em>(Rs. 325.31)</em>. Please have a look at chart-1.</p><p style="text-align:justify">The lowest <a href="https://im4change.org/upload/files/State%20wise%20average%20daily%20nominal%20wage%20rates%20in%20rural%20india%20men%20farm%20labourers.JPG" title="https://im4change.org/upload/files/State%20wise%20average%20daily%20nominal%20wage%20rates%20in%20rural%20india%20men%20farm%20labourers.JPG">average daily nominal wage rate</a> <a href="https://im4change.org/upload/files/State%20wise%20average%20daily%20nominal%20wage%20rates%20in%20rural%20india%20men%20farm%20labourers.JPG" title="https://im4change.org/upload/files/State%20wise%20average%20daily%20nominal%20wage%20rates%20in%20rural%20india%20men%20farm%20labourers.JPG">for male agricultural labourers</a> in rural India during the period from 2014-15 to 2020-21 was observed in Madhya Pradesh <em>(Rs. 183.97)</em>, followed by Gujarat <em>(Rs. 190.07)</em>, Maharashtra <em>(Rs. 215.71)</em>, Odisha <em>(Rs. 216.87)</em>, Meghalaya <em>(Rs. 219.93)</em>, Bihar <em>(Rs. 230.43)</em>, Uttar Pradesh <em>(Rs. 230.5)</em>, and Assam <em>(Rs. 237.3)</em>. The related national level figure was Rs. 265.09 during the period from 2014-15 to 2020-21. Please consult chart-1. </p><p style="text-align:justify">The highest <a href="https://im4change.org/upload/files/State%20wise%20growth%20in%20average%20daily%20nominal%20wage%20rates%20in%20rural%20india%20men%20farm%20labourers.JPG" title="https://im4change.org/upload/files/State%20wise%20growth%20in%20average%20daily%20nominal%20wage%20rates%20in%20rural%20india%20men%20farm%20labourers.JPG">average annual growth rate in</a> <a href="https://im4change.org/upload/files/State%20wise%20growth%20in%20average%20daily%20nominal%20wage%20rates%20in%20rural%20india%20men%20farm%20labourers.JPG" title="https://im4change.org/upload/files/State%20wise%20growth%20in%20average%20daily%20nominal%20wage%20rates%20in%20rural%20india%20men%20farm%20labourers.JPG">nominal wage rates</a> during the period from 2015-16 to 2020-21 was found in Karnataka <em>(7.3 percent)</em>, followed by Andhra Pradesh <em>(6.8 percent)</em>, Madhya Pradesh <em>(6.4 percent)</em>, Uttar Pradesh <em>(6.2 percent)</em>, Odisha <em>(6.1 percent)</em>, and Meghalaya <em>(6.0 percent)</em>. Please see chart-2.</p><p style="text-align:justify">The lowest <a href="https://im4change.org/upload/files/State%20wise%20growth%20in%20average%20daily%20nominal%20wage%20rates%20in%20rural%20india%20men%20farm%20labourers.JPG" title="https://im4change.org/upload/files/State%20wise%20growth%20in%20average%20daily%20nominal%20wage%20rates%20in%20rural%20india%20men%20farm%20labourers.JPG">average annual growth rate</a> <a href="https://im4change.org/upload/files/State%20wise%20growth%20in%20average%20daily%20nominal%20wage%20rates%20in%20rural%20india%20men%20farm%20labourers.JPG" title="https://im4change.org/upload/files/State%20wise%20growth%20in%20average%20daily%20nominal%20wage%20rates%20in%20rural%20india%20men%20farm%20labourers.JPG">in nominal wage rates</a> during the same period was noticed in Haryana <em>(2.1 percent)</em>, followed by Rajasthan <em>(3.3 percent)</em>, Kerala <em>(3.5 percent)</em>, Punjab <em>(3.9 percent)</em>, and Tamil Nadu <em>(4.5 percent)</em>. Please consult chart-2.</p><p style="text-align:justify">The average annual <a href="https://im4change.org/upload/files/State%20wise%20growth%20in%20average%20daily%20wage%20rates%20in%20real%20terms%20for%20male%20farm%20labourers%20in%20rural%20India.JPG" title="https://im4change.org/upload/files/State%20wise%20growth%20in%20average%20daily%20wage%20rates%20in%20real%20terms%20for%20male%20farm%20labourers%20in%20rural%20India.JPG">growth of agricultural labourers’</a> <a href="https://im4change.org/upload/files/State%20wise%20growth%20in%20average%20daily%20wage%20rates%20in%20real%20terms%20for%20male%20farm%20labourers%20in%20rural%20India.JPG" title="https://im4change.org/upload/files/State%20wise%20growth%20in%20average%20daily%20wage%20rates%20in%20real%20terms%20for%20male%20farm%20labourers%20in%20rural%20India.JPG">wage rates in real terms</a> during the period from 2015-16 to 2020-21 were negative in Haryana <em>(-2.1 percent)</em>, Jammu and Kashmir <em>(-0.3 percent)</em>, Kerala <em>(-1.7 percent)</em>, Punjab <em>(-0.4 percent)</em>, Rajasthan <em>(-1.1 percent)</em>, Tamil Nadu <em>(-0.8 percent)</em>, Tripura <em>(-0.5 percent)</em>, and West Bengal <em>(-0.1 percent)</em>. It should be noted that the <a href="https://im4change.org/upload/files/State-wise%20Average%20Inflation%20CPI%20-%20Inflation.PDF" title="https://im4change.org/upload/files/State-wise%20Average%20Inflation%20CPI%20-%20Inflation.PDF">rate of inflation</a> in <a href="https://im4change.org/upload/files/State-wise%20Average%20Inflation%20CPI%20-%20Inflation.PDF" title="https://im4change.org/upload/files/State-wise%20Average%20Inflation%20CPI%20-%20Inflation.PDF">Consumer Price Index-General</a> has been used to get the average annual growth of agricultural labourers’ wage rates in real terms. Kindly consult table-1. </p><p style="text-align:justify">Some states witnessed negative <a href="https://im4change.org/upload/files/State%20wise%20growth%20in%20average%20daily%20wage%20rates%20in%20real%20terms%20for%20male%20farm%20labourers%20in%20rural%20India.JPG" title="https://im4change.org/upload/files/State%20wise%20growth%20in%20average%20daily%20wage%20rates%20in%20real%20terms%20for%20male%20farm%20labourers%20in%20rural%20India.JPG">growth in agricultural labourers’</a> <a href="https://im4change.org/upload/files/State%20wise%20growth%20in%20average%20daily%20wage%20rates%20in%20real%20terms%20for%20male%20farm%20labourers%20in%20rural%20India.JPG" title="https://im4change.org/upload/files/State%20wise%20growth%20in%20average%20daily%20wage%20rates%20in%20real%20terms%20for%20male%20farm%20labourers%20in%20rural%20India.JPG">wage rates in real terms</a> for more than two years between 2015-16 and 2020-21. For example, <a href="https://im4change.org/upload/files/State%20wise%20growth%20in%20average%20daily%20wage%20rates%20in%20real%20terms%20for%20male%20farm%20labourers%20in%20rural%20India.JPG" title="https://im4change.org/upload/files/State%20wise%20growth%20in%20average%20daily%20wage%20rates%20in%20real%20terms%20for%20male%20farm%20labourers%20in%20rural%20India.JPG">Haryana</a> experienced negative growth in 2015-16, 2016-17, 2017-18, 2019-20, and 2020-21. Likewise, <a href="https://im4change.org/upload/files/State%20wise%20growth%20in%20average%20daily%20wage%20rates%20in%20real%20terms%20for%20male%20farm%20labourers%20in%20rural%20India.JPG" title="https://im4change.org/upload/files/State%20wise%20growth%20in%20average%20daily%20wage%20rates%20in%20real%20terms%20for%20male%20farm%20labourers%20in%20rural%20India.JPG">Kerala</a> faced negative growth in 2017-18, 2018-19, 2019-20, and 2020-21. </p><p style="text-align:justify">At the national level, the <a href="https://im4change.org/upload/files/State%20wise%20growth%20in%20average%20daily%20wage%20rates%20in%20real%20terms%20for%20male%20farm%20labourers%20in%20rural%20India.JPG" title="https://im4change.org/upload/files/State%20wise%20growth%20in%20average%20daily%20wage%20rates%20in%20real%20terms%20for%20male%20farm%20labourers%20in%20rural%20India.JPG">agricultural labourers’</a> <a href="https://im4change.org/upload/files/State%20wise%20growth%20in%20average%20daily%20wage%20rates%20in%20real%20terms%20for%20male%20farm%20labourers%20in%20rural%20India.JPG" title="https://im4change.org/upload/files/State%20wise%20growth%20in%20average%20daily%20wage%20rates%20in%20real%20terms%20for%20male%20farm%20labourers%20in%20rural%20India.JPG">wage rates in real terms</a> on average grew by 1.0 percent annually during the period from 2015-16 to 2020-21.</p><p style="text-align:justify">Please <a href="https://docs.google.com/spreadsheets/d/1avu0-WtaKV2RHXtz2eiP7iS8znGVBdKC/edit?usp=sharing&ouid=112233925171588304692&rtpof=true&sd=true" title="https://docs.google.com/spreadsheets/d/1avu0-WtaKV2RHXtz2eiP7iS8znGVBdKC/edit?usp=sharing&ouid=112233925171588304692&rtpof=true&sd=true">click here</a> to access the spreadsheet in order to look at the trends in <a href="/upload/files/State%20wise%20average%20daily%20nominal%20wage%20rates%20in%20rural%20india%20men%20farm%20labourers.JPG" title="/upload/files/State%20wise%20average%20daily%20nominal%20wage%20rates%20in%20rural%20india%20men%20farm%20labourers.JPG">nominal wage rates</a>, <a href="/upload/files/State%20wise%20growth%20in%20average%20daily%20nominal%20wage%20rates%20in%20rural%20india%20men%20farm%20labourers.JPG" title="/upload/files/State%20wise%20growth%20in%20average%20daily%20nominal%20wage%20rates%20in%20rural%20india%20men%20farm%20labourers.JPG">annual growth in nominal wage rates</a> and <a href="/upload/files/State%20wise%20growth%20in%20average%20daily%20wage%20rates%20in%20real%20terms%20for%20male%20farm%20labourers%20in%20rural%20India.JPG" title="/upload/files/State%20wise%20growth%20in%20average%20daily%20wage%20rates%20in%20real%20terms%20for%20male%20farm%20labourers%20in%20rural%20India.JPG">annual growth in real wage rates</a> for farm labourers in rural areas. </p><p style="text-align:justify"><strong>Non-agricultural wages in rural areas</strong></p><p style="text-align:justify">The rural economy is not just about farming any longer. That is why we have looked at the wage growth in the non-farm sector too. The highest <a href="https://im4change.org/upload/files/State%20wise%20average%20daily%20nominal%20wage%20rates%20in%20rural%20india%20men%20non%20farm%20labourers.JPG" title="https://im4change.org/upload/files/State%20wise%20average%20daily%20nominal%20wage%20rates%20in%20rural%20india%20men%20non%20farm%20labourers.JPG">average daily nominal wage rate for male</a> <a href="https://im4change.org/upload/files/State%20wise%20average%20daily%20nominal%20wage%20rates%20in%20rural%20india%20men%20non%20farm%20labourers.JPG" title="https://im4change.org/upload/files/State%20wise%20average%20daily%20nominal%20wage%20rates%20in%20rural%20india%20men%20non%20farm%20labourers.JPG">non-agricultural labourers</a> in rural India during the period from 2014-15 to 2020-21 was detected in Kerala <em>(Rs. 639.01)</em>, followed by Jammu and Kashmir <em>(Rs. 426.37)</em>, Tamil Nadu <em>(Rs. 405.77)</em>, Haryana <em>(Rs. 359.24)</em>, Himachal Pradesh <em>(Rs. 311.10)</em>, and Punjab <em>(Rs. 309.09)</em>. Please see chart-1.</p><p style="text-align:justify">The lowest average <a href="https://im4change.org/upload/files/State%20wise%20average%20daily%20nominal%20wage%20rates%20in%20rural%20india%20men%20non%20farm%20labourers.JPG" title="https://im4change.org/upload/files/State%20wise%20average%20daily%20nominal%20wage%20rates%20in%20rural%20india%20men%20non%20farm%20labourers.JPG">daily nominal wage rate for male</a> <a href="https://im4change.org/upload/files/State%20wise%20average%20daily%20nominal%20wage%20rates%20in%20rural%20india%20men%20non%20farm%20labourers.JPG" title="https://im4change.org/upload/files/State%20wise%20average%20daily%20nominal%20wage%20rates%20in%20rural%20india%20men%20non%20farm%20labourers.JPG">non-agricultural labourers in rural India</a> during the period from 2014-15 to 2020-21 was found in Madhya Pradesh <em>(Rs. 191.47)</em>, followed by Meghalaya <em>(Rs. 210.26)</em>, Gujarat <em>(Rs. 213.51)</em>, Odisha <em>(Rs. 218.06)</em>, Maharashtra <em>(Rs. 226.70)</em>, Tripura <em>(Rs. 230.36)</em>, Bihar <em>(Rs. 243.51)</em>, and Uttar Pradesh <em>(Rs. 243.97)</em>. The related national level figure was Rs. 273.79 during the period from 2014-15 to 2020-21. Please see chart-1.</p><p style="text-align:justify">The highest <a href="https://im4change.org/upload/files/State%20wise%20growth%20in%20average%20daily%20nominal%20wage%20rates%20in%20rural%20india%20men%20non%20farm%20labourers.JPG" title="https://im4change.org/upload/files/State%20wise%20growth%20in%20average%20daily%20nominal%20wage%20rates%20in%20rural%20india%20men%20non%20farm%20labourers.JPG">average annual growth rate in</a> <a href="https://im4change.org/upload/files/State%20wise%20growth%20in%20average%20daily%20nominal%20wage%20rates%20in%20rural%20india%20men%20non%20farm%20labourers.JPG" title="https://im4change.org/upload/files/State%20wise%20growth%20in%20average%20daily%20nominal%20wage%20rates%20in%20rural%20india%20men%20non%20farm%20labourers.JPG">nominal wage rates</a> during the period from 2015-16 to 2020-21 was noticed in Odisha <em>(8.0 percent)</em>, followed by Madhya Pradesh <em>(7.6 percent)</em>, Assam <em>(6.6 percent)</em>, West Bengal <em>(5.9 percent)</em>, Uttar Pradesh and Andhra Pradesh <em>(5.6 percent each)</em>, and Bihar <em>(5.5 percent)</em>. Kindly consult chart-2.</p><p style="text-align:justify">The lowest <a href="https://im4change.org/upload/files/State%20wise%20growth%20in%20average%20daily%20nominal%20wage%20rates%20in%20rural%20india%20men%20non%20farm%20labourers.JPG" title="https://im4change.org/upload/files/State%20wise%20growth%20in%20average%20daily%20nominal%20wage%20rates%20in%20rural%20india%20men%20non%20farm%20labourers.JPG">average annual growth rate</a> <a href="https://im4change.org/upload/files/State%20wise%20growth%20in%20average%20daily%20nominal%20wage%20rates%20in%20rural%20india%20men%20non%20farm%20labourers.JPG" title="https://im4change.org/upload/files/State%20wise%20growth%20in%20average%20daily%20nominal%20wage%20rates%20in%20rural%20india%20men%20non%20farm%20labourers.JPG">in nominal wage rates</a> during the same period was observed in Kerala <em>(1.8 percent)</em>, followed by Haryana <em>(2.4 percent)</em>, Meghalaya <em>(2.8 percent)</em>, Tamil Nadu and Rajasthan <em>(3.2 percent each)</em>, Tripura and Jammu and Kashmir <em>(4.0 percent each),</em> and Maharashtra and Punjab <em>(4.2 percent each)</em>. Kindly consult chart-2. </p><p style="text-align:justify">The average annual <a href="https://im4change.org/upload/files/State%20wise%20growth%20in%20average%20daily%20wage%20rates%20in%20real%20terms%20for%20male%20non%20farm%20labourers%20in%20rural%20India.JPG" title="https://im4change.org/upload/files/State%20wise%20growth%20in%20average%20daily%20wage%20rates%20in%20real%20terms%20for%20male%20non%20farm%20labourers%20in%20rural%20India.JPG">growth of non-agricultural labourers’</a> <a href="https://im4change.org/upload/files/State%20wise%20growth%20in%20average%20daily%20wage%20rates%20in%20real%20terms%20for%20male%20non%20farm%20labourers%20in%20rural%20India.JPG" title="https://im4change.org/upload/files/State%20wise%20growth%20in%20average%20daily%20wage%20rates%20in%20real%20terms%20for%20male%20non%20farm%20labourers%20in%20rural%20India.JPG">wage rates in real terms</a> during the period from 2015-16 to 2020-21 were negative in Haryana <em>(-1.9 percent)</em>, Jammu and Kashmir <em>(-1.7 percent)</em>, Kerala <em>(-3.5 percent)</em>, Maharashtra <em>(-0.3 percent)</em>, Meghalaya <em>(-1.2 percent)</em>, Punjab <em>(-0.1 percent)</em>, Rajasthan <em>(-1.2 percent)</em>, Tamil Nadu <em>(-2.1 percent)</em>, and Tripura <em>(-1.1 percent)</em>. It should be noted that the <a href="https://im4change.org/upload/files/State-wise%20Average%20Inflation%20CPI%20-%20Inflation.PDF" title="https://im4change.org/upload/files/State-wise%20Average%20Inflation%20CPI%20-%20Inflation.PDF">rate of inflation</a> in <a href="https://im4change.org/upload/files/State-wise%20Average%20Inflation%20CPI%20-%20Inflation.PDF" title="https://im4change.org/upload/files/State-wise%20Average%20Inflation%20CPI%20-%20Inflation.PDF">CPI-General</a> has been used to get the average annual growth of non-agricultural labourers’ wage rates in real terms. Kindly have a look at table-1. </p><p style="text-align:justify">Some states experienced negative growth in <a href="https://im4change.org/upload/files/State%20wise%20growth%20in%20average%20daily%20wage%20rates%20in%20real%20terms%20for%20male%20non%20farm%20labourers%20in%20rural%20India.JPG" title="https://im4change.org/upload/files/State%20wise%20growth%20in%20average%20daily%20wage%20rates%20in%20real%20terms%20for%20male%20non%20farm%20labourers%20in%20rural%20India.JPG">non-agricultural labourers’ wage</a> <a href="https://im4change.org/upload/files/State%20wise%20growth%20in%20average%20daily%20wage%20rates%20in%20real%20terms%20for%20male%20non%20farm%20labourers%20in%20rural%20India.JPG" title="https://im4change.org/upload/files/State%20wise%20growth%20in%20average%20daily%20wage%20rates%20in%20real%20terms%20for%20male%20non%20farm%20labourers%20in%20rural%20India.JPG">rates in real terms</a> for more than two years between 2015-16 and 2020-21. For example, <a href="https://im4change.org/upload/files/State%20wise%20growth%20in%20average%20daily%20wage%20rates%20in%20real%20terms%20for%20male%20non%20farm%20labourers%20in%20rural%20India.JPG" title="https://im4change.org/upload/files/State%20wise%20growth%20in%20average%20daily%20wage%20rates%20in%20real%20terms%20for%20male%20non%20farm%20labourers%20in%20rural%20India.JPG">Haryana</a> experienced negative <a href="https://im4change.org/upload/files/State%20wise%20growth%20in%20average%20daily%20wage%20rates%20in%20real%20terms%20for%20male%20non%20farm%20labourers%20in%20rural%20India.JPG" title="https://im4change.org/upload/files/State%20wise%20growth%20in%20average%20daily%20wage%20rates%20in%20real%20terms%20for%20male%20non%20farm%20labourers%20in%20rural%20India.JPG">growth in wage rates</a> <a href="https://im4change.org/upload/files/State%20wise%20growth%20in%20average%20daily%20wage%20rates%20in%20real%20terms%20for%20male%20non%20farm%20labourers%20in%20rural%20India.JPG" title="https://im4change.org/upload/files/State%20wise%20growth%20in%20average%20daily%20wage%20rates%20in%20real%20terms%20for%20male%20non%20farm%20labourers%20in%20rural%20India.JPG">(in real terms)</a> during 2016-17, 2017-18, 2018-19, 2019-20, and 2020-21. Likewise, <a href="https://im4change.org/upload/files/State%20wise%20growth%20in%20average%20daily%20wage%20rates%20in%20real%20terms%20for%20male%20non%20farm%20labourers%20in%20rural%20India.JPG" title="https://im4change.org/upload/files/State%20wise%20growth%20in%20average%20daily%20wage%20rates%20in%20real%20terms%20for%20male%20non%20farm%20labourers%20in%20rural%20India.JPG">Kerala</a> faced negative growth rates in 2015-16, 2016-17, 2017-18, 2019-20, and 2020-21. </p><p style="text-align:justify">At the national level, the <a href="https://im4change.org/upload/files/State%20wise%20growth%20in%20average%20daily%20wage%20rates%20in%20real%20terms%20for%20male%20non%20farm%20labourers%20in%20rural%20India.JPG" title="https://im4change.org/upload/files/State%20wise%20growth%20in%20average%20daily%20wage%20rates%20in%20real%20terms%20for%20male%20non%20farm%20labourers%20in%20rural%20India.JPG">non-agricultural labourers’</a> <a href="https://im4change.org/upload/files/State%20wise%20growth%20in%20average%20daily%20wage%20rates%20in%20real%20terms%20for%20male%20non%20farm%20labourers%20in%20rural%20India.JPG" title="https://im4change.org/upload/files/State%20wise%20growth%20in%20average%20daily%20wage%20rates%20in%20real%20terms%20for%20male%20non%20farm%20labourers%20in%20rural%20India.JPG">wage rates in real terms</a> on average grew by just 0.3 percent annually during the period from 2015-16 to 2020-21. </p><p style="text-align:justify">Please <a href="https://docs.google.com/spreadsheets/d/1avu0-WtaKV2RHXtz2eiP7iS8znGVBdKC/edit?usp=sharing&ouid=112233925171588304692&rtpof=true&sd=true" title="https://docs.google.com/spreadsheets/d/1avu0-WtaKV2RHXtz2eiP7iS8znGVBdKC/edit?usp=sharing&ouid=112233925171588304692&rtpof=true&sd=true">click here</a> to access the spreadsheet in order to look at the <a href="/upload/files/State%20wise%20average%20daily%20nominal%20wage%20rates%20in%20rural%20india%20men%20non%20farm%20labourers.JPG" title="/upload/files/State%20wise%20average%20daily%20nominal%20wage%20rates%20in%20rural%20india%20men%20non%20farm%20labourers.JPG">trends in nominal wage rates</a>, <a href="/upload/files/State%20wise%20growth%20in%20average%20daily%20nominal%20wage%20rates%20in%20rural%20india%20men%20non%20farm%20labourers.JPG" title="/upload/files/State%20wise%20growth%20in%20average%20daily%20nominal%20wage%20rates%20in%20rural%20india%20men%20non%20farm%20labourers.JPG">annual growth in nominal wage rates</a>, and <a href="/upload/files/State%20wise%20growth%20in%20average%20daily%20wage%20rates%20in%20real%20terms%20for%20male%20non%20farm%20labourers%20in%20rural%20India.JPG" title="/upload/files/State%20wise%20growth%20in%20average%20daily%20wage%20rates%20in%20real%20terms%20for%20male%20non%20farm%20labourers%20in%20rural%20India.JPG">annual growth in real wage rates</a> for non-farm labourers in rural areas. </p><p style="text-align:justify"><strong>Construction sector wages in rural areas</strong></p><p style="text-align:justify">The <a href="https://im4change.org/upload/files/State%20wise%20average%20daily%20nominal%20wage%20rates%20in%20rural%20india%20men%20construction%20workers.JPG" title="https://im4change.org/upload/files/State%20wise%20average%20daily%20nominal%20wage%20rates%20in%20rural%20india%20men%20construction%20workers.JPG">highest average daily nominal wage rates</a> <a href="https://im4change.org/upload/files/State%20wise%20average%20daily%20nominal%20wage%20rates%20in%20rural%20india%20men%20construction%20workers.JPG" title="https://im4change.org/upload/files/State%20wise%20average%20daily%20nominal%20wage%20rates%20in%20rural%20india%20men%20construction%20workers.JPG">for male construction workers in rural India</a> during the period from 2014-15 to 2020-21 was detected in Kerala <em>(Rs. 810.3)</em>, followed by Jammu and Kashmir <em>(Rs. 445.1)</em>, Tamil Nadu <em>(Rs. 424.1)</em>, Haryana <em>(Rs. 379.9)</em>, Himachal Pradesh <em>(Rs. 368.7)</em>, Rajasthan <em>(Rs. 347.7)</em>, and Punjab <em>(Rs. 339.1)</em>. Kindly see chart-1. </p><p style="text-align:justify">The <a href="https://im4change.org/upload/files/State%20wise%20average%20daily%20nominal%20wage%20rates%20in%20rural%20india%20men%20construction%20workers.JPG" title="https://im4change.org/upload/files/State%20wise%20average%20daily%20nominal%20wage%20rates%20in%20rural%20india%20men%20construction%20workers.JPG">lowest average daily nominal wage rates</a> <a href="https://im4change.org/upload/files/State%20wise%20average%20daily%20nominal%20wage%20rates%20in%20rural%20india%20men%20construction%20workers.JPG" title="https://im4change.org/upload/files/State%20wise%20average%20daily%20nominal%20wage%20rates%20in%20rural%20india%20men%20construction%20workers.JPG">for male construction workers in rural areas</a> during the period from 2014-15 to 2020-21 was found in Madhya Pradesh <em>(Rs. 212.4)</em>, followed by Tripura <em>(Rs. 230.4)</em>, Meghalaya <em>(Rs. 231.7)</em>, Odisha <em>(Rs. 247.1)</em>, Gujarat <em>(Rs. 251.8)</em>, Uttar Pradesh <em>(Rs. 267.4)</em>, Bihar <em>(Rs. 270.8)</em>, and West Bengal <em>(Rs. 274.0)</em>. The related national level figure was Rs. 316.9 during the period from 2014-15 to 2020-21. Kindly consult chart-1.</p><p style="text-align:justify">The <a href="https://im4change.org/upload/files/State%20wise%20growth%20in%20average%20daily%20nominal%20wage%20rates%20in%20rural%20india%20men%20construction%20workers.JPG" title="https://im4change.org/upload/files/State%20wise%20growth%20in%20average%20daily%20nominal%20wage%20rates%20in%20rural%20india%20men%20construction%20workers.JPG">highest average annual growth rates in</a> <a href="https://im4change.org/upload/files/State%20wise%20growth%20in%20average%20daily%20nominal%20wage%20rates%20in%20rural%20india%20men%20construction%20workers.JPG" title="https://im4change.org/upload/files/State%20wise%20growth%20in%20average%20daily%20nominal%20wage%20rates%20in%20rural%20india%20men%20construction%20workers.JPG">nominal wage rates</a> during the period from 2015-16 to 2020-21 was noticed in Meghalaya <em>(20.9 percent)</em>, followed by Madhya Pradesh <em>(7.4 percent)</em>, Odisha and Andhra Pradesh <em>(6.8 percent each)</em>, Uttar Pradesh <em>(6.4 percent)</em>, and Bihar <em>(6.2 percent)</em>. Please see chart-2. </p><p style="text-align:justify">The <a href="https://im4change.org/upload/files/State%20wise%20growth%20in%20average%20daily%20nominal%20wage%20rates%20in%20rural%20india%20men%20construction%20workers.JPG" title="https://im4change.org/upload/files/State%20wise%20growth%20in%20average%20daily%20nominal%20wage%20rates%20in%20rural%20india%20men%20construction%20workers.JPG">lowest average annual growth rates in</a> <a href="https://im4change.org/upload/files/State%20wise%20growth%20in%20average%20daily%20nominal%20wage%20rates%20in%20rural%20india%20men%20construction%20workers.JPG" title="https://im4change.org/upload/files/State%20wise%20growth%20in%20average%20daily%20nominal%20wage%20rates%20in%20rural%20india%20men%20construction%20workers.JPG">nominal wage rates</a> during the same period was observed in Kerala <em>(0.9 percent)</em>, followed by Manipur <em>(2.0 percent)</em>, Haryana <em>(2.1 percent)</em>, Jammu and Kashmir <em>(3.0 percent)</em>, Rajasthan <em>(3.2 percent)</em>, and Gujarat <em>(3.6 percent)</em>. Please see chart-2.</p><p style="text-align:justify">The <a href="https://im4change.org/upload/files/State%20wise%20growth%20in%20average%20daily%20wage%20rates%20in%20real%20terms%20for%20male%20construction%20workers%20in%20rural%20India%281%29.JPG" title="https://im4change.org/upload/files/State%20wise%20growth%20in%20average%20daily%20wage%20rates%20in%20real%20terms%20for%20male%20construction%20workers%20in%20rural%20India%281%29.JPG">average annual growth of construction workers’</a> <a href="https://im4change.org/upload/files/State%20wise%20growth%20in%20average%20daily%20wage%20rates%20in%20real%20terms%20for%20male%20construction%20workers%20in%20rural%20India%281%29.JPG" title="https://im4change.org/upload/files/State%20wise%20growth%20in%20average%20daily%20wage%20rates%20in%20real%20terms%20for%20male%20construction%20workers%20in%20rural%20India%281%29.JPG">wage rates in real terms</a> during the period from 2015-16 to 2020-21 was negative in Assam <em>(-1.2 percent)</em>, Haryana <em>(-2.1 percent)</em>, Jammu and Kashmir <em>(-2.7 percent)</em>, Karnataka <em>(-0.6 percent)</em>, Kerala <em>(-4.4 percent)</em>, Manipur <em>(-6.3 percent)</em>, Rajasthan <em>(-1.2 percent)</em>, Tamil Nadu <em>(-0.9 percent)</em>, and Tripura <em>(-1.1 percent)</em>. Please note that the <a href="https://im4change.org/upload/files/State-wise%20Average%20Inflation%20CPI%20-%20Inflation.PDF" title="https://im4change.org/upload/files/State-wise%20Average%20Inflation%20CPI%20-%20Inflation.PDF">rate of inflation</a> in <a href="https://im4change.org/upload/files/State-wise%20Average%20Inflation%20CPI%20-%20Inflation.PDF" title="https://im4change.org/upload/files/State-wise%20Average%20Inflation%20CPI%20-%20Inflation.PDF">CPI-General</a> has been used to get the average annual growth of construction workers’ wage rates in real terms. Kindly have a look at table-1. </p><p style="text-align:justify">In the case of Meghalaya, the <a href="https://im4change.org/upload/files/State%20wise%20average%20daily%20nominal%20wage%20rates%20in%20rural%20india%20men%20construction%20workers.JPG" title="https://im4change.org/upload/files/State%20wise%20average%20daily%20nominal%20wage%20rates%20in%20rural%20india%20men%20construction%20workers.JPG">nominal daily wage rate of male construction</a> <a href="https://im4change.org/upload/files/State%20wise%20average%20daily%20nominal%20wage%20rates%20in%20rural%20india%20men%20construction%20workers.JPG" title="https://im4change.org/upload/files/State%20wise%20average%20daily%20nominal%20wage%20rates%20in%20rural%20india%20men%20construction%20workers.JPG">workers</a> fell from Rs. 186.0 in 2016-17 to Rs. 100.0 in 2017-18 i.e., a decline by -46.2 percent over previous year. However, the same bounced back to Rs. 273.2 in 2018-19 i.e., an increase by 173.2 percent over previous year. In <a href="https://im4change.org/upload/files/State%20wise%20growth%20in%20average%20daily%20wage%20rates%20in%20real%20terms%20for%20male%20construction%20workers%20in%20rural%20India%281%29.JPG" title="https://im4change.org/upload/files/State%20wise%20growth%20in%20average%20daily%20wage%20rates%20in%20real%20terms%20for%20male%20construction%20workers%20in%20rural%20India%281%29.JPG">real terms, the construction sector</a> <a href="https://im4change.org/upload/files/State%20wise%20growth%20in%20average%20daily%20wage%20rates%20in%20real%20terms%20for%20male%20construction%20workers%20in%20rural%20India%281%29.JPG" title="https://im4change.org/upload/files/State%20wise%20growth%20in%20average%20daily%20wage%20rates%20in%20real%20terms%20for%20male%20construction%20workers%20in%20rural%20India%281%29.JPG">wage rate in Meghalaya</a> grew by -47.7 percent in 2017-18 <em>(over previous year)</em> and 171.0 percent in 2018-19 <em>(over previous year)</em>.</p><p style="text-align:justify">Some states experienced negative <a href="https://im4change.org/upload/files/State%20wise%20growth%20in%20average%20daily%20wage%20rates%20in%20real%20terms%20for%20male%20construction%20workers%20in%20rural%20India%281%29.JPG" title="https://im4change.org/upload/files/State%20wise%20growth%20in%20average%20daily%20wage%20rates%20in%20real%20terms%20for%20male%20construction%20workers%20in%20rural%20India%281%29.JPG">growth in construction workers’</a> <a href="https://im4change.org/upload/files/State%20wise%20growth%20in%20average%20daily%20wage%20rates%20in%20real%20terms%20for%20male%20construction%20workers%20in%20rural%20India%281%29.JPG" title="https://im4change.org/upload/files/State%20wise%20growth%20in%20average%20daily%20wage%20rates%20in%20real%20terms%20for%20male%20construction%20workers%20in%20rural%20India%281%29.JPG">wage rates in real terms</a> for more than two years between 2015-16 and 2020-21. For example, <a href="https://im4change.org/upload/files/State%20wise%20growth%20in%20average%20daily%20wage%20rates%20in%20real%20terms%20for%20male%20construction%20workers%20in%20rural%20India%281%29.JPG" title="https://im4change.org/upload/files/State%20wise%20growth%20in%20average%20daily%20wage%20rates%20in%20real%20terms%20for%20male%20construction%20workers%20in%20rural%20India%281%29.JPG">Assam</a> experienced negative growth in wage rates <em>(in real terms)</em> during 2017-18, 2018-19, 2019-20, and 2020-21. </p><p style="text-align:justify">At the national level, the <a href="https://im4change.org/upload/files/State%20wise%20growth%20in%20average%20daily%20wage%20rates%20in%20real%20terms%20for%20male%20construction%20workers%20in%20rural%20India%281%29.JPG" title="https://im4change.org/upload/files/State%20wise%20growth%20in%20average%20daily%20wage%20rates%20in%20real%20terms%20for%20male%20construction%20workers%20in%20rural%20India%281%29.JPG">construction workers’ wage rates in real terms</a> on average grew by just 0.1 percent annually during the period from 2015-16 to 2020-21.</p><p style="text-align:justify">Kindly <a href="https://docs.google.com/spreadsheets/d/1avu0-WtaKV2RHXtz2eiP7iS8znGVBdKC/edit?usp=sharing&ouid=112233925171588304692&rtpof=true&sd=true" title="https://docs.google.com/spreadsheets/d/1avu0-WtaKV2RHXtz2eiP7iS8znGVBdKC/edit?usp=sharing&ouid=112233925171588304692&rtpof=true&sd=true">click here</a> to access the spreadsheet in order to look at the <a href="/upload/files/State%20wise%20average%20daily%20nominal%20wage%20rates%20in%20rural%20india%20men%20construction%20workers.JPG" title="/upload/files/State%20wise%20average%20daily%20nominal%20wage%20rates%20in%20rural%20india%20men%20construction%20workers.JPG">trends in nominal wage rates</a>, <a href="/upload/files/State%20wise%20growth%20in%20average%20daily%20nominal%20wage%20rates%20in%20rural%20india%20men%20construction%20workers.JPG" title="/upload/files/State%20wise%20growth%20in%20average%20daily%20nominal%20wage%20rates%20in%20rural%20india%20men%20construction%20workers.JPG">annual growth in nominal wage rates</a>, and <a href="/upload/files/State%20wise%20growth%20in%20average%20daily%20wage%20rates%20in%20real%20terms%20for%20male%20construction%20workers%20in%20rural%20India%281%29.JPG" title="/upload/files/State%20wise%20growth%20in%20average%20daily%20wage%20rates%20in%20real%20terms%20for%20male%20construction%20workers%20in%20rural%20India%281%29.JPG">annual growth in real wage rates</a> for construction workers in rural areas. </p><p style="text-align:justify"><strong>Data collection methodology</strong></p><p style="text-align:justify">As a part of Rural Labour Enquiry, the <a href="https://im4change.org/upload/files/ilj_feb_2013.pdf" title="https://im4change.org/upload/files/ilj_feb_2013.pdf">daily wage rates</a> in respect of eighteen agricultural and non-agricultural occupations are being collected along with rural retail price data by the Field Operations Division of the National Sample Survey Organisation since 1986-87, according to a February 2013 <a href="https://im4change.org/upload/files/ilj_feb_2013.pdf" title="https://im4change.org/upload/files/ilj_feb_2013.pdf">edition of the Indian Labour Journal</a>. On the recommendations of the Governing Council of the National Sample Survey Organisation in its 61st meeting, the <a href="https://im4change.org/upload/files/ilj_feb_2013.pdf" title="https://im4change.org/upload/files/ilj_feb_2013.pdf">Labour Bureau</a> started the compilation and analysis of wage rate data with effect from April, 1998. </p><p style="text-align:justify">The Field Operations Division of the National Sample Survey Organisation has been entrusted with the work of <a href="https://im4change.org/upload/files/METHOLOGY%20FOR%20COMPILATION%20OF%20THE%20WAGE%20RATE%20DATA.pdf" title="https://im4change.org/upload/files/METHOLOGY%20FOR%20COMPILATION%20OF%20THE%20WAGE%20RATE%20DATA.pdf">data collection</a>. The <a href="https://im4change.org/upload/files/METHOLOGY%20FOR%20COMPILATION%20OF%20THE%20WAGE%20RATE%20DATA.pdf" title="https://im4change.org/upload/files/METHOLOGY%20FOR%20COMPILATION%20OF%20THE%20WAGE%20RATE%20DATA.pdf">wage rate data</a> are being collected along with rural retail prices from 600 sample villages spread over 66 NSS regions of 20 States by canvassing Block-5 <em>(Annexure-I)</em> of Schedule 3.01(R). The data collection from these sample villages is staggered over the four weeks of a month with one-fourth of them being covered every week. The days of canvassing of Schedule 3.01(R) are fixed. The village functionaries like the Panchayat Secretary, Progress Assistant, Patwari and other Village or Block Officials are the primary informants for collection of data on wage rates. The data on normal working hours and the prevailing wage rates in cash and kind for the reported working hours are collected sex-wise for each of the 18 selected occupations in 20 states, indicates an old <a href="https://im4change.org/upload/files/METHOLOGY%20FOR%20COMPILATION%20OF%20THE%20WAGE%20RATE%20DATA.pdf" title="https://im4change.org/upload/files/METHOLOGY%20FOR%20COMPILATION%20OF%20THE%20WAGE%20RATE%20DATA.pdf">document</a> of the Labour Bureau. </p><p style="text-align:justify">The wage rates are sometimes reported for a duration that is less/more than the normal working hours. In such cases, they are <a href="https://im4change.org/upload/files/METHOLOGY%20FOR%20COMPILATION%20OF%20THE%20WAGE%20RATE%20DATA.pdf" title="https://im4change.org/upload/files/METHOLOGY%20FOR%20COMPILATION%20OF%20THE%20WAGE%20RATE%20DATA.pdf">first normalised for eight hours</a> working day. As regards the mode of payment of wages, it is made in both ways i.e., in cash and/or in kind. The payments made in kind are very common in rural areas, which include foodgrains, cooked food, tea, fuel, cigarette, beedi, fodder, etc. The wages reported in kind are evaluated at local retail prices. Thereafter, the data is thoroughly scrutinised and discrepant points are referred back to the field for clarification. In the next stage, the simple arithmetic average of these normalised daily wage rates is worked out occupation-wise and sex-wise for each state.</p><p style="text-align:justify"><a href="http://ras.org.in/methodology_of_data_collection_unsuited_to_changing_rural_reality" title="http://ras.org.in/methodology_of_data_collection_unsuited_to_changing_rural_reality">Up to June 2000</a>, the average wage rates at the national level were derived by taking the simple average of state figures; since July 2000, the averages have been obtained by dividing the sum total of wages of all 20 states by the number of centres or villages from which data were collected. The state-wise averages are restricted only to those occupations where the number of centres is five or more to avoid abnormal fluctuations and inconsistency in wages paid to different categories of workers on account of varying numbers of centres. However, in order to calculate the all-India averages, all neglected centres are taken into account to arrive at the total number of centres at the national level.</p><p style="text-align:justify">The <a href="/upload/files/RBI%20note%20Average%20Daily%20Wage%20rate%20Methodology.pdf" title="/upload/files/RBI%20note%20Average%20Daily%20Wage%20rate%20Methodology.pdf">Reserve Bank of India</a> <em>(whose data we have used in writing this news alert)</em> has collated and is releasing monthly time series data on rural wage rates based on the data published by the Labour Bureau, Government of India. Starting from November 2013 the Labour Bureau is collecting the rural wage data in respect of 12 agricultural and 13 non-agricultural occupations across 20 major states, namely, Andhra Pradesh, Assam, Bihar, Gujarat, Haryana, Himachal Pradesh, Jammu & Kashmir, Karnataka, Kerala, Madhya Pradesh, Maharashtra, Manipur, Meghalaya, Orissa, Punjab, Rajasthan, Tamil Nadu, Tripura, Uttar Pradesh and West Bengal. The occupations for which the daily wage rates are collected every month are: <u>(A) Agricultural occupations</u> – (1) Ploughing/ Tilling workers, (2) Sowing <em>(including planting/ Transplanting/ Weeding)</em> workers, (3) Harvesting/ Winnowing/ Threshing workers, (4) Picking workers <em>(including Tea, Cotton, Tobacco and other commercial crops)</em>, (5) Horticulture workers <em>(including nursery growers)</em>, (6) Fishermen-inland, (7) Fishermen coastal/deep-sea, (8) Loggers and wood cutters, (9) Animal husbandry workers <em>(including poultry workers, dairy workers and herdsman)</em>, (10) Packaging labourers, agriculture, (11) General agricultural labourers <em>(including watering/ irrigation workers, etc.)</em>, (12) Plant protection workers <em>(applying pesticides, treating seeds, etc.)</em>; and <u>(B) Non-agricultural occupations</u> – (13) Carpenter, (14) Blacksmith, (15) Mason, (16) Weavers, (17) Beedi makers, (18) Bamboo, cane basket weavers, (19) Handicraft workers, (20) Plumbers, (21) Electrician, (22) Construction workers <em>(for roads, dams, industrial & project construction work and Well diggers)</em>, (23) LMV & Tractor drivers, (24) Non-agricultural labourers <em>(including porters, loaders)</em>, and (25) Sweeping/cleaning workers. </p><p style="text-align:justify"><strong><em>References </em></strong></p><p style="text-align:justify">Handbook of Statistics on Indian States 2020-21, released in November 2021, please <a href="https://m.rbi.org.in/scripts/AnnualPublications.aspx?head=Handbook%20of%20Statistics%20on%20Indian%20States" title="https://m.rbi.org.in/scripts/AnnualPublications.aspx?head=Handbook%20of%20Statistics%20on%20Indian%20States">click here</a> to access</p><p style="text-align:justify">State-wise Average Daily Wage Rates in Rural India (Men - General Agricultural Labourers), RBI Handbook of Statistics on Indian States 2020-21, released in November 2021, please <a href="/upload/files/State-wise%20Average%20Daily%20Wage%20Rates%20in%20Rural%20India%20Men%20-%20General%20Agricultural%20Labourers.PDF" title="/upload/files/State-wise%20Average%20Daily%20Wage%20Rates%20in%20Rural%20India%20Men%20-%20General%20Agricultural%20Labourers.PDF">click here</a> to access </p><p style="text-align:justify">State-wise Average Daily Wage Rates in Rural India (Men - Non-Agricultural Labourers), RBI Handbook of Statistics on Indian States 2020-21, released in November 2021, please <a href="/upload/files/State-wise%20Average%20Daily%20Wage%20Rates%20in%20Rural%20India%20Men%20-%20Non%20Agricultural%20Labourers.PDF" title="/upload/files/State-wise%20Average%20Daily%20Wage%20Rates%20in%20Rural%20India%20Men%20-%20Non%20Agricultural%20Labourers.PDF">click here</a> to access </p><p style="text-align:justify">State-wise Average Daily Wage Rates in Rural India (Men - Construction Workers), RBI Handbook of Statistics on Indian States 2020-21, released in November 2021, please <a href="/upload/files/State-wise%20Average%20Daily%20Wage%20Rates%20in%20Rural%20India%20Men%20-%20Construction%20Workers.PDF" title="/upload/files/State-wise%20Average%20Daily%20Wage%20Rates%20in%20Rural%20India%20Men%20-%20Construction%20Workers.PDF">click here</a> to access </p><p style="text-align:justify">State-wise Average Inflation (CPI) - Inflation, RBI Handbook of Statistics on Indian States 2020-21, released in November 2021, please <a href="/upload/files/State-wise%20Average%20Inflation%20CPI%20-%20Inflation.PDF" title="/upload/files/State-wise%20Average%20Inflation%20CPI%20-%20Inflation.PDF">click here</a> to access </p><p style="text-align:justify">Indian Labour Journal, February 2013, please <a href="/upload/files/ilj_feb_2013.pdf" title="/upload/files/ilj_feb_2013.pdf">click here</a> to access </p><p style="text-align:justify">Wage Rates in Rural India 2003-04: Methodology for Compilation of the Wage Rate Data, Labour Bureau, please <a href="/upload/files/METHOLOGY%20FOR%20COMPILATION%20OF%20THE%20WAGE%20RATE%20DATA.pdf" title="/upload/files/METHOLOGY%20FOR%20COMPILATION%20OF%20THE%20WAGE%20RATE%20DATA.pdf">click here</a> to access </p><p style="text-align:justify">Average Daily Wage Rates in Rural India: Methodology and coverage (From November 2013), Reserve Bank of India, please <a href="https://dbie.rbi.org.in" title="https://dbie.rbi.org.in">click here</a> and <a href="/upload/files/RBI%20note%20Average%20Daily%20Wage%20rate%20Methodology%281%29.pdf" title="/upload/files/RBI%20note%20Average%20Daily%20Wage%20rate%20Methodology%281%29.pdf">here</a> to access </p><p style="text-align:justify">Consumer Price Index Numbers on Base 2012=100 for Rural, Urban and Combined for the month of January 2022, Ministry of Statistics and Programme Implementation (MoSPI), National Statistical Office (NSO), released on 14th February 2022, please <a href="/upload/files/CPI%20Press%20Release%20January%202022%281%29.pdf" title="/upload/files/CPI%20Press%20Release%20January%202022%281%29.pdf">click here</a> to access </p><p style="text-align:justify">Methodology of Data Collection Unsuited to Changing Rural Reality: A Study of Agricultural Wage Data in India -Yoshifumi Usami, Arindam Das, and Madhura Swaminathan, Review of Agrarian Studies, Vol. 10, No. 2, July-December, 2020, please <a href="http://ras.org.in/methodology_of_data_collection_unsuited_to_changing_rural_reality" title="http://ras.org.in/methodology_of_data_collection_unsuited_to_changing_rural_reality">click here</a> to access</p><p>Russia-ukraine crisis to push up fertiliser prices, govt subsidies, IANS/ Business Standard, 4 March, 2022, please <a href="https://www.business-standard.com/article/economy-policy/russia-ukraine-crisis-to-push-up-fertiliser-prices-govt-subsidies-122030400560_1.html" title="https://www.business-standard.com/article/economy-policy/russia-ukraine-crisis-to-push-up-fertiliser-prices-govt-subsidies-122030400560_1.html">click here</a> to access </p><p>Cooking oil prices spike in India due to Russia-ukraine crisis -B Krishna Mohan, TelanganaToday.com, 3 March, 2022, please <a href="https://telanganatoday.com/cooking-oil-prices-spike-in-india-due-to-russia-ukraine-crisis" title="https://telanganatoday.com/cooking-oil-prices-spike-in-india-due-to-russia-ukraine-crisis">click here</a> to access </p><p>Govt reviews cooking oil imports as ukraine crisis disrupts supplies, prices shoot up -Amiti Sen and Prabhudutta Mishra, The Hindu Business Line, 4 March, 2022, please <a href="https://www.thehindubusinessline.com/markets/commodities/govt-reviews-cooking-oil-imports-as-ukraine-crisis-disrupts-supplies-prices-shoot-up/article65190879.ece" title="https://www.thehindubusinessline.com/markets/commodities/govt-reviews-cooking-oil-imports-as-ukraine-crisis-disrupts-supplies-prices-shoot-up/article65190879.ece">click here</a> to access </p><p>India's Economy Faces A Potential Stagflation Risk From Ukraine War -Sunil Prabhu, NDTV.com, 1 March, 2022, please <a href="https://www.ndtv.com/business/indias-economy-faces-a-potential-stagflation-risk-from-ukraine-war-2796624" title="https://www.ndtv.com/business/indias-economy-faces-a-potential-stagflation-risk-from-ukraine-war-2796624">click here</a> to access</p><p>India to be one of Asia’s ‘biggest losers’ from the Ukraine war as Russia slammed by global sanctions -Paran Balakrishnan, The Telegraph, 1 March, 2022, please <a href="https://www.telegraphindia.com/business/russia-ukraine-crisis-india-to-be-one-of-asias-biggest-losers-from-the-ukraine-war-as-russia-slammed-by-global-sanctions/cid/1854032" title="https://www.telegraphindia.com/business/russia-ukraine-crisis-india-to-be-one-of-asias-biggest-losers-from-the-ukraine-war-as-russia-slammed-by-global-sanctions/cid/1854032">click here</a> to access</p><p>Crude Oil Prices Rise, Tracking Russia-Ukraine Conflict -Rahul Karunakar, NDTV.com <em>(with inputs from Agencies)</em>, 1 March, 2022, please <a href="https://www.ndtv.com/business/crude-oil-prices-rise-on-tuesday-tracking-russia-ukraine-conflict-2796187" title="https://www.ndtv.com/business/crude-oil-prices-rise-on-tuesday-tracking-russia-ukraine-conflict-2796187">click here</a> to access</p><p>Cooking Oil May Become Costlier Due to Russia-ukraine War. Know Why, News18.com, 27 February, 2022, please <a href="https://www.news18.com/news/business/markets/cooking-oil-may-become-costlier-due-to-russia-ukraine-war-know-why-4812740.html" title="https://www.news18.com/news/business/markets/cooking-oil-may-become-costlier-due-to-russia-ukraine-war-know-why-4812740.html">click here</a> to access </p><p style="text-align:justify"><strong>Image Courtesy: Inclusive Media for Change/ Shambhu Ghatak</strong></p>'
$lang = 'English'
$SITE_URL = 'https://im4change.in/'
$site_title = 'im4change'
$adminprix = 'admin'
include - APP/Template/Layout/printlayout.ctp, line 8
Cake\View\View::_evaluate() - CORE/src/View/View.php, line 1413
Cake\View\View::_render() - CORE/src/View/View.php, line 1374
Cake\View\View::renderLayout() - CORE/src/View/View.php, line 927
Cake\View\View::render() - CORE/src/View/View.php, line 885
Cake\Controller\Controller::render() - CORE/src/Controller/Controller.php, line 791
Cake\Http\ActionDispatcher::_invoke() - CORE/src/Http/ActionDispatcher.php, line 126
Cake\Http\ActionDispatcher::dispatch() - CORE/src/Http/ActionDispatcher.php, line 94
Cake\Http\BaseApplication::__invoke() - CORE/src/Http/BaseApplication.php, line 235
Cake\Http\Runner::__invoke() - CORE/src/Http/Runner.php, line 65
Cake\Routing\Middleware\RoutingMiddleware::__invoke() - CORE/src/Routing/Middleware/RoutingMiddleware.php, line 162
Cake\Http\Runner::__invoke() - CORE/src/Http/Runner.php, line 65
Cake\Routing\Middleware\AssetMiddleware::__invoke() - CORE/src/Routing/Middleware/AssetMiddleware.php, line 88
Cake\Http\Runner::__invoke() - CORE/src/Http/Runner.php, line 65
Cake\Error\Middleware\ErrorHandlerMiddleware::__invoke() - CORE/src/Error/Middleware/ErrorHandlerMiddleware.php, line 96
Cake\Http\Runner::__invoke() - CORE/src/Http/Runner.php, line 65
Cake\Http\Runner::run() - CORE/src/Http/Runner.php, line 51
news-alerts-57/real-wage-rates-of-the-rural-workers-hardly-increased-during-the-past-6-years.html"/>
NEWS ALERTS | Real wage rates of the rural workers hardly increased during the last 6 years | Im4change.org
Real wage rates of the rural workers hardly increased during the last 6 years
In the absence of income or expenditure-based headcount ratio, the growth in the real wages (i.e., nominal wages adjusted against retail inflation) of the manual workers is considered to be a good proxy to assess the trends in poverty. This is because the manual, unskilled/ semi-skilled labourers exist at the bottom of the pyramid or economic hierarchy, and most of them belong to the social categories Scheduled Castes (SCs) and Scheduled Tribes (STs). A positive growth in their real wages (or real wage rates) is anticipated to improve their purchasing power (i.e., income or consumption expenditure) and lift them out of the poverty trap.
Clearly, there exists inter-state differences in nominal wage rates, growth in nominal wage rates and growth in real wage rates, which we will see in this news alert.
At the national level, the average daily nominal wage rate for male construction workers in rural areas during the period from 2014-15 to 2020-21 was Rs. 316.9, which was greater than that of the male non-farm workers in rural areas. The average daily nominal wage rate for male non-agricultural labourers in rural areas during the period from 2014-15 to 2020-21 was Rs. 273.8, which exceeded the average daily nominal wage rates for male farm labourers in rural areas (i.e., Rs. 265.1). However, in Andhra Pradesh, Haryana, Himachal Pradesh, Jammu and Kashmir, Karnataka, Kerala, Meghalaya, Punjab, and Tripura, the average daily nominal wage rates for male agricultural labourers in rural areas during the period from 2014-15 to 2020-21 exceeded the average daily nominal wage rates for male non-farm labourers in rural areas. Please see chart-1.
Notes: The average (i.e., arithmetic mean) daily nominal wage rates for various categories of workers in rural India in the period from 2014-15 to 2020-21 has been calculated by the Inclusive Media for Change staff
Please click here to access the data in spreadsheet format
Source: Handbook of Statistics on Indian States 2020-21, released in November 2021, please click here to access
State-wise Average Daily Wage Rates in Rural India (Men - General Agricultural Labourers), RBI Handbook of Statistics on Indian States 2020-21, released in November 2021, please click here to access
State-wise Average Daily Wage Rates in Rural India (Men - Non-Agricultural Labourers), RBI Handbook of Statistics on Indian States 2020-21, released in November 2021, please click here to access
State-wise Average Daily Wage Rates in Rural India (Men - Construction Workers), RBI Handbook of Statistics on Indian States 2020-21, released in November 2021, please click here to access
State-wise Average Inflation (CPI) - Inflation, RBI Handbook of Statistics on Indian States 2020-21, released in November 2021, please click here to access
---
At the national level, the agricultural nominal wage rate grew faster than the non-farm wage rate on average for male labourers in rural areas during the period from 2015-16 to 2020-21. However, in states like Assam, Bihar, Haryana, Madhya Pradesh, Odisha, Punjab, and West Bengal, the non-farm nominal wage rates grew faster than the farm wage rates on average for male workers in rural areas during the period from 2015-16 to 2020-21. Please see chart-2.
Notes: The average growth in daily nominal wage rates for various categories of workers in rural India in the period from 2015-16 to 2020-21 has been calculated by the Inclusive Media for Change staff
Please click here to access the data in spreadsheet format
Source: Same as above ---
At the national level, the construction sector nominal wage rate grew slower than the non-agricultural wage rate on average for male labourers in rural areas during the period from 2015-16 to 2020-21. However, in states like Andhra Pradesh, Bihar, Himachal Pradesh, Maharashtra, Meghalaya, Punjab, Tamil Nadu, and Uttar Pradesh, the construction sector nominal wage rates grew faster than the non-farm wage rates on average for male workers in rural areas during the period from 2015-16 to 2020-21. Please take a look at chart-2.
At the national level, the agricultural wage rate in real terms grew faster than the non-farm wage rate on average for male labourers in rural areas during the period from 2015-16 to 2020-21. However, in states like Assam, Bihar, Haryana, Madhya Pradesh, Odisha, Punjab, and West Bengal, the non-farm wage rates in real terms grew faster than the farm wage rates on average for male workers in rural areas during the period from 2015-16 to 2020-21. Please see table-1.
Table 1: State-wise Growth in Average Daily Wage Rates in Real terms for Male Agricultural Labourers, Male Non-Agricultural Labourers, and Male Construction Workers in Rural India, in %
Notes: The average growth in daily wage rates in real terms for various categories of workers in rural India in the period from 2015-16 to 2020-21 has been calculated by the Inclusive Media for Change staff
Please click here to access the data in spreadsheet format
Source: Same as above ---
At the national level, the construction sector wage rate in real terms grew slower than the non-agricultural wage rate on average for male labourers in rural areas during the period from 2015-16 to 2020-21. However, in states like Andhra Pradesh, Bihar, Himachal Pradesh, Maharashtra, Meghalaya, Punjab, Tamil Nadu, and Uttar Pradesh, the construction sector wage rates in real terms grew faster than the non-farm wage rates on average for male workers in rural areas during the period from 2015-16 to 2020-21. Please take a look at table-1.
In the following paragraphs, we have discussed the trends in agricultural wage rates, non-farm wage rates, and construction sector wage rates (in rural areas) in detail.
Agricultural wages in rural areas
The highest average daily nominal wage ratefor male agricultural labourers in rural India during the period from 2014-15 to 2020-21 was found in Kerala (Rs. 653.93), followed by Jammu and Kashmir (Rs. 429.19), Tamil Nadu (Rs. 385.6), Haryana (Rs. 368.53), Himachal Pradesh (Rs. 366.23), and Punjab (Rs. 325.31). Please have a look at chart-1.
The lowest average daily nominal wage ratefor male agricultural labourers in rural India during the period from 2014-15 to 2020-21 was observed in Madhya Pradesh (Rs. 183.97), followed by Gujarat (Rs. 190.07), Maharashtra (Rs. 215.71), Odisha (Rs. 216.87), Meghalaya (Rs. 219.93), Bihar (Rs. 230.43), Uttar Pradesh (Rs. 230.5), and Assam (Rs. 237.3). The related national level figure was Rs. 265.09 during the period from 2014-15 to 2020-21. Please consult chart-1.
The highest average annual growth rate innominal wage rates during the period from 2015-16 to 2020-21 was found in Karnataka (7.3 percent), followed by Andhra Pradesh (6.8 percent), Madhya Pradesh (6.4 percent), Uttar Pradesh (6.2 percent), Odisha (6.1 percent), and Meghalaya (6.0 percent). Please see chart-2.
The lowest average annual growth ratein nominal wage rates during the same period was noticed in Haryana (2.1 percent), followed by Rajasthan (3.3 percent), Kerala (3.5 percent), Punjab (3.9 percent), and Tamil Nadu (4.5 percent). Please consult chart-2.
The average annual growth of agricultural labourers’wage rates in real terms during the period from 2015-16 to 2020-21 were negative in Haryana (-2.1 percent), Jammu and Kashmir (-0.3 percent), Kerala (-1.7 percent), Punjab (-0.4 percent), Rajasthan (-1.1 percent), Tamil Nadu (-0.8 percent), Tripura (-0.5 percent), and West Bengal (-0.1 percent). It should be noted that the rate of inflation in Consumer Price Index-General has been used to get the average annual growth of agricultural labourers’ wage rates in real terms. Kindly consult table-1.
Some states witnessed negative growth in agricultural labourers’wage rates in real terms for more than two years between 2015-16 and 2020-21. For example, Haryana experienced negative growth in 2015-16, 2016-17, 2017-18, 2019-20, and 2020-21. Likewise, Kerala faced negative growth in 2017-18, 2018-19, 2019-20, and 2020-21.
The rural economy is not just about farming any longer. That is why we have looked at the wage growth in the non-farm sector too. The highest average daily nominal wage rate for malenon-agricultural labourers in rural India during the period from 2014-15 to 2020-21 was detected in Kerala (Rs. 639.01), followed by Jammu and Kashmir (Rs. 426.37), Tamil Nadu (Rs. 405.77), Haryana (Rs. 359.24), Himachal Pradesh (Rs. 311.10), and Punjab (Rs. 309.09). Please see chart-1.
The lowest average daily nominal wage rate for malenon-agricultural labourers in rural India during the period from 2014-15 to 2020-21 was found in Madhya Pradesh (Rs. 191.47), followed by Meghalaya (Rs. 210.26), Gujarat (Rs. 213.51), Odisha (Rs. 218.06), Maharashtra (Rs. 226.70), Tripura (Rs. 230.36), Bihar (Rs. 243.51), and Uttar Pradesh (Rs. 243.97). The related national level figure was Rs. 273.79 during the period from 2014-15 to 2020-21. Please see chart-1.
The highest average annual growth rate innominal wage rates during the period from 2015-16 to 2020-21 was noticed in Odisha (8.0 percent), followed by Madhya Pradesh (7.6 percent), Assam (6.6 percent), West Bengal (5.9 percent), Uttar Pradesh and Andhra Pradesh (5.6 percent each), and Bihar (5.5 percent). Kindly consult chart-2.
The lowest average annual growth ratein nominal wage rates during the same period was observed in Kerala (1.8 percent), followed by Haryana (2.4 percent), Meghalaya (2.8 percent), Tamil Nadu and Rajasthan (3.2 percent each), Tripura and Jammu and Kashmir (4.0 percent each), and Maharashtra and Punjab (4.2 percent each). Kindly consult chart-2.
The average annual growth of non-agricultural labourers’wage rates in real terms during the period from 2015-16 to 2020-21 were negative in Haryana (-1.9 percent), Jammu and Kashmir (-1.7 percent), Kerala (-3.5 percent), Maharashtra (-0.3 percent), Meghalaya (-1.2 percent), Punjab (-0.1 percent), Rajasthan (-1.2 percent), Tamil Nadu (-2.1 percent), and Tripura (-1.1 percent). It should be noted that the rate of inflation in CPI-General has been used to get the average annual growth of non-agricultural labourers’ wage rates in real terms. Kindly have a look at table-1.
The highest average daily nominal wage ratesfor male construction workers in rural India during the period from 2014-15 to 2020-21 was detected in Kerala (Rs. 810.3), followed by Jammu and Kashmir (Rs. 445.1), Tamil Nadu (Rs. 424.1), Haryana (Rs. 379.9), Himachal Pradesh (Rs. 368.7), Rajasthan (Rs. 347.7), and Punjab (Rs. 339.1). Kindly see chart-1.
The lowest average daily nominal wage ratesfor male construction workers in rural areas during the period from 2014-15 to 2020-21 was found in Madhya Pradesh (Rs. 212.4), followed by Tripura (Rs. 230.4), Meghalaya (Rs. 231.7), Odisha (Rs. 247.1), Gujarat (Rs. 251.8), Uttar Pradesh (Rs. 267.4), Bihar (Rs. 270.8), and West Bengal (Rs. 274.0). The related national level figure was Rs. 316.9 during the period from 2014-15 to 2020-21. Kindly consult chart-1.
The highest average annual growth rates innominal wage rates during the period from 2015-16 to 2020-21 was noticed in Meghalaya (20.9 percent), followed by Madhya Pradesh (7.4 percent), Odisha and Andhra Pradesh (6.8 percent each), Uttar Pradesh (6.4 percent), and Bihar (6.2 percent). Please see chart-2.
The lowest average annual growth rates innominal wage rates during the same period was observed in Kerala (0.9 percent), followed by Manipur (2.0 percent), Haryana (2.1 percent), Jammu and Kashmir (3.0 percent), Rajasthan (3.2 percent), and Gujarat (3.6 percent). Please see chart-2.
The average annual growth of construction workers’wage rates in real terms during the period from 2015-16 to 2020-21 was negative in Assam (-1.2 percent), Haryana (-2.1 percent), Jammu and Kashmir (-2.7 percent), Karnataka (-0.6 percent), Kerala (-4.4 percent), Manipur (-6.3 percent), Rajasthan (-1.2 percent), Tamil Nadu (-0.9 percent), and Tripura (-1.1 percent). Please note that the rate of inflation in CPI-General has been used to get the average annual growth of construction workers’ wage rates in real terms. Kindly have a look at table-1.
In the case of Meghalaya, the nominal daily wage rate of male constructionworkers fell from Rs. 186.0 in 2016-17 to Rs. 100.0 in 2017-18 i.e., a decline by -46.2 percent over previous year. However, the same bounced back to Rs. 273.2 in 2018-19 i.e., an increase by 173.2 percent over previous year. In real terms, the construction sectorwage rate in Meghalaya grew by -47.7 percent in 2017-18 (over previous year) and 171.0 percent in 2018-19 (over previous year).
Some states experienced negative growth in construction workers’wage rates in real terms for more than two years between 2015-16 and 2020-21. For example, Assam experienced negative growth in wage rates (in real terms) during 2017-18, 2018-19, 2019-20, and 2020-21.
As a part of Rural Labour Enquiry, the daily wage rates in respect of eighteen agricultural and non-agricultural occupations are being collected along with rural retail price data by the Field Operations Division of the National Sample Survey Organisation since 1986-87, according to a February 2013 edition of the Indian Labour Journal. On the recommendations of the Governing Council of the National Sample Survey Organisation in its 61st meeting, the Labour Bureau started the compilation and analysis of wage rate data with effect from April, 1998.
The Field Operations Division of the National Sample Survey Organisation has been entrusted with the work of data collection. The wage rate data are being collected along with rural retail prices from 600 sample villages spread over 66 NSS regions of 20 States by canvassing Block-5 (Annexure-I) of Schedule 3.01(R). The data collection from these sample villages is staggered over the four weeks of a month with one-fourth of them being covered every week. The days of canvassing of Schedule 3.01(R) are fixed. The village functionaries like the Panchayat Secretary, Progress Assistant, Patwari and other Village or Block Officials are the primary informants for collection of data on wage rates. The data on normal working hours and the prevailing wage rates in cash and kind for the reported working hours are collected sex-wise for each of the 18 selected occupations in 20 states, indicates an old document of the Labour Bureau.
The wage rates are sometimes reported for a duration that is less/more than the normal working hours. In such cases, they are first normalised for eight hours working day. As regards the mode of payment of wages, it is made in both ways i.e., in cash and/or in kind. The payments made in kind are very common in rural areas, which include foodgrains, cooked food, tea, fuel, cigarette, beedi, fodder, etc. The wages reported in kind are evaluated at local retail prices. Thereafter, the data is thoroughly scrutinised and discrepant points are referred back to the field for clarification. In the next stage, the simple arithmetic average of these normalised daily wage rates is worked out occupation-wise and sex-wise for each state.
Up to June 2000, the average wage rates at the national level were derived by taking the simple average of state figures; since July 2000, the averages have been obtained by dividing the sum total of wages of all 20 states by the number of centres or villages from which data were collected. The state-wise averages are restricted only to those occupations where the number of centres is five or more to avoid abnormal fluctuations and inconsistency in wages paid to different categories of workers on account of varying numbers of centres. However, in order to calculate the all-India averages, all neglected centres are taken into account to arrive at the total number of centres at the national level.
The Reserve Bank of India(whose data we have used in writing this news alert) has collated and is releasing monthly time series data on rural wage rates based on the data published by the Labour Bureau, Government of India. Starting from November 2013 the Labour Bureau is collecting the rural wage data in respect of 12 agricultural and 13 non-agricultural occupations across 20 major states, namely, Andhra Pradesh, Assam, Bihar, Gujarat, Haryana, Himachal Pradesh, Jammu & Kashmir, Karnataka, Kerala, Madhya Pradesh, Maharashtra, Manipur, Meghalaya, Orissa, Punjab, Rajasthan, Tamil Nadu, Tripura, Uttar Pradesh and West Bengal. The occupations for which the daily wage rates are collected every month are: (A) Agricultural occupations – (1) Ploughing/ Tilling workers, (2) Sowing (including planting/ Transplanting/ Weeding) workers, (3) Harvesting/ Winnowing/ Threshing workers, (4) Picking workers (including Tea, Cotton, Tobacco and other commercial crops), (5) Horticulture workers (including nursery growers), (6) Fishermen-inland, (7) Fishermen coastal/deep-sea, (8) Loggers and wood cutters, (9) Animal husbandry workers (including poultry workers, dairy workers and herdsman), (10) Packaging labourers, agriculture, (11) General agricultural labourers (including watering/ irrigation workers, etc.), (12) Plant protection workers (applying pesticides, treating seeds, etc.); and (B) Non-agricultural occupations – (13) Carpenter, (14) Blacksmith, (15) Mason, (16) Weavers, (17) Beedi makers, (18) Bamboo, cane basket weavers, (19) Handicraft workers, (20) Plumbers, (21) Electrician, (22) Construction workers (for roads, dams, industrial & project construction work and Well diggers), (23) LMV & Tractor drivers, (24) Non-agricultural labourers (including porters, loaders), and (25) Sweeping/cleaning workers.
References
Handbook of Statistics on Indian States 2020-21, released in November 2021, please click here to access
State-wise Average Daily Wage Rates in Rural India (Men - General Agricultural Labourers), RBI Handbook of Statistics on Indian States 2020-21, released in November 2021, please click here to access
State-wise Average Daily Wage Rates in Rural India (Men - Non-Agricultural Labourers), RBI Handbook of Statistics on Indian States 2020-21, released in November 2021, please click here to access
State-wise Average Daily Wage Rates in Rural India (Men - Construction Workers), RBI Handbook of Statistics on Indian States 2020-21, released in November 2021, please click here to access
State-wise Average Inflation (CPI) - Inflation, RBI Handbook of Statistics on Indian States 2020-21, released in November 2021, please click here to access
Indian Labour Journal, February 2013, please click here to access
Wage Rates in Rural India 2003-04: Methodology for Compilation of the Wage Rate Data, Labour Bureau, please click here to access
Average Daily Wage Rates in Rural India: Methodology and coverage (From November 2013), Reserve Bank of India, please click here and here to access
Consumer Price Index Numbers on Base 2012=100 for Rural, Urban and Combined for the month of January 2022, Ministry of Statistics and Programme Implementation (MoSPI), National Statistical Office (NSO), released on 14th February 2022, please click here to access
Methodology of Data Collection Unsuited to Changing Rural Reality: A Study of Agricultural Wage Data in India -Yoshifumi Usami, Arindam Das, and Madhura Swaminathan, Review of Agrarian Studies, Vol. 10, No. 2, July-December, 2020, please click here to access
Russia-ukraine crisis to push up fertiliser prices, govt subsidies, IANS/ Business Standard, 4 March, 2022, please click here to access
Cooking oil prices spike in India due to Russia-ukraine crisis -B Krishna Mohan, TelanganaToday.com, 3 March, 2022, please click here to access
Govt reviews cooking oil imports as ukraine crisis disrupts supplies, prices shoot up -Amiti Sen and Prabhudutta Mishra, The Hindu Business Line, 4 March, 2022, please click here to access
India's Economy Faces A Potential Stagflation Risk From Ukraine War -Sunil Prabhu, NDTV.com, 1 March, 2022, please click here to access
India to be one of Asia’s ‘biggest losers’ from the Ukraine war as Russia slammed by global sanctions -Paran Balakrishnan, The Telegraph, 1 March, 2022, please click here to access
Crude Oil Prices Rise, Tracking Russia-Ukraine Conflict -Rahul Karunakar, NDTV.com (with inputs from Agencies), 1 March, 2022, please click here to access
Cooking Oil May Become Costlier Due to Russia-ukraine War. Know Why, News18.com, 27 February, 2022, please click here to access
Image Courtesy: Inclusive Media for Change/ Shambhu Ghatak
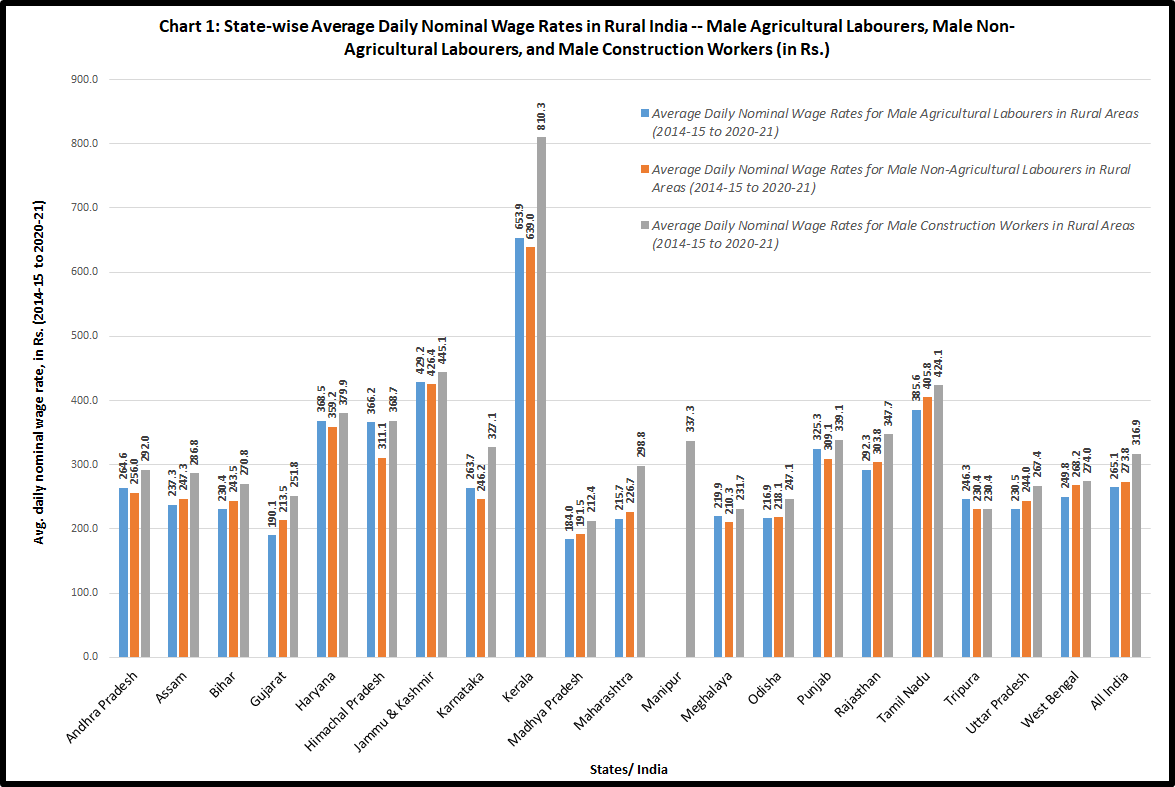
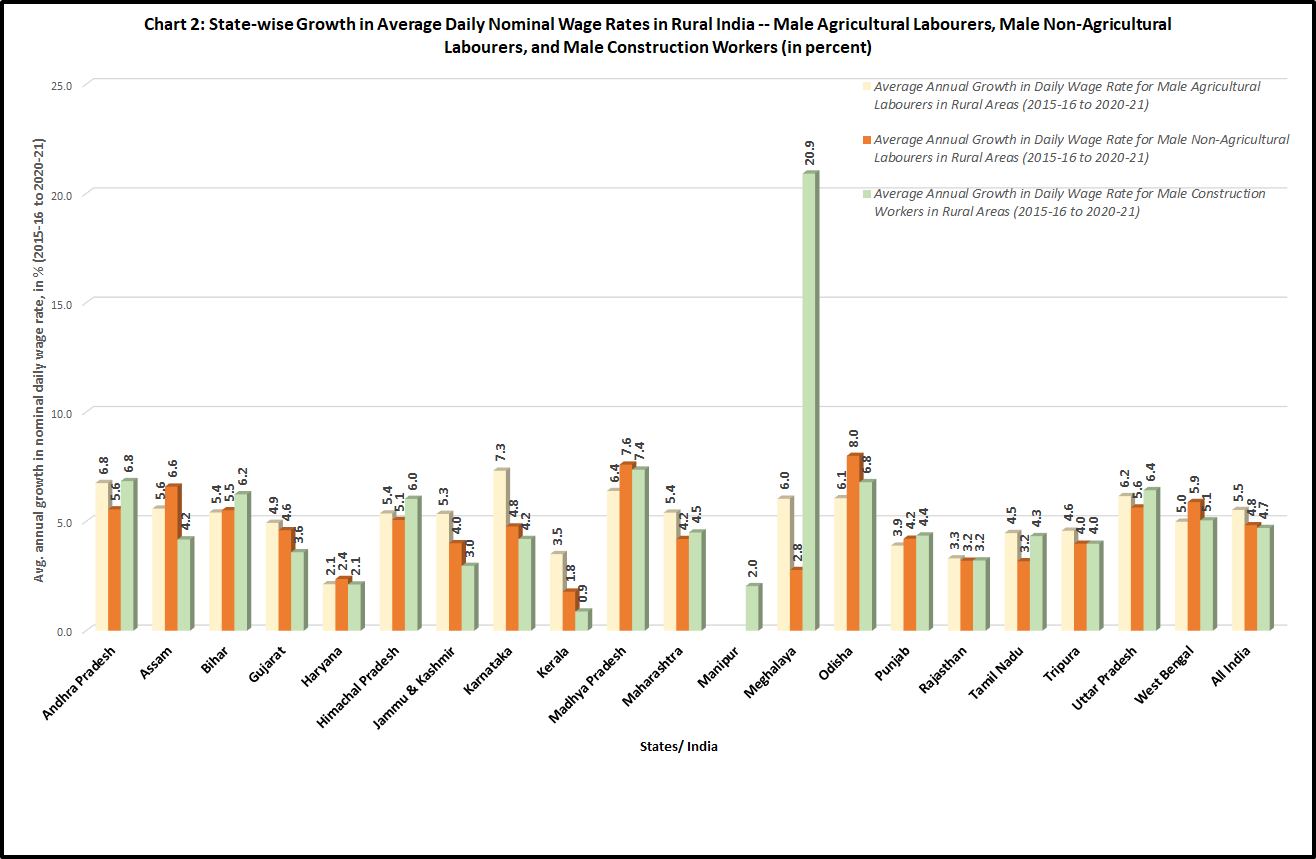
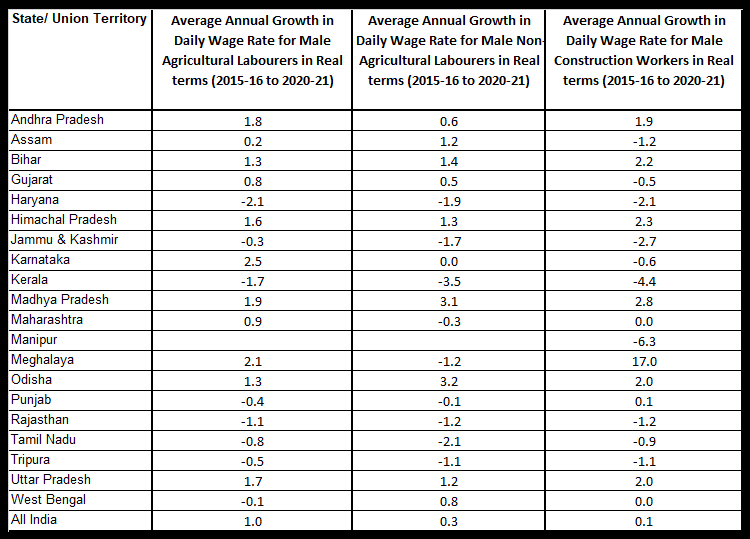
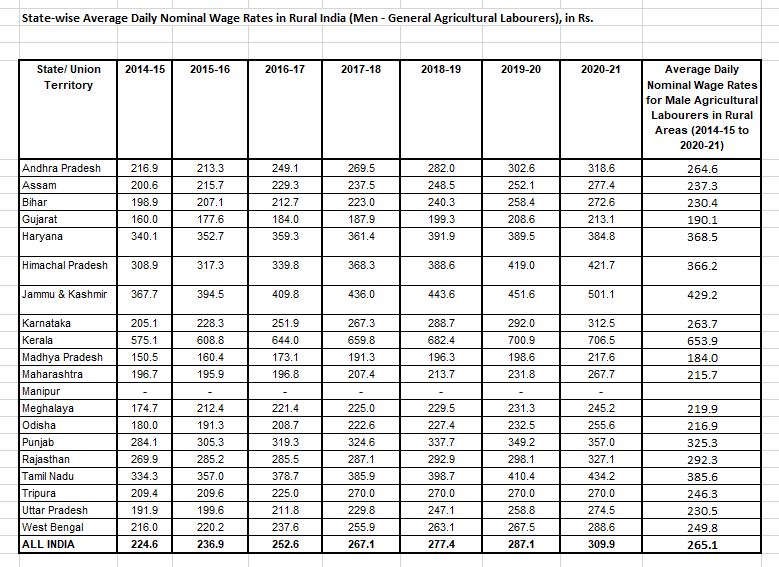
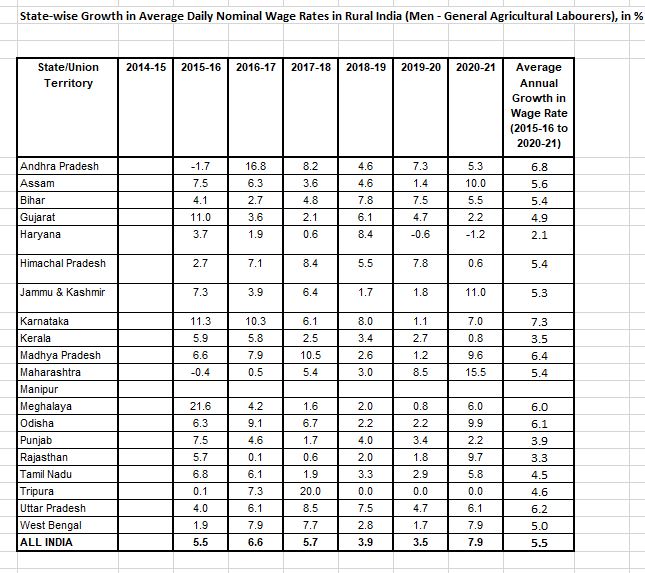
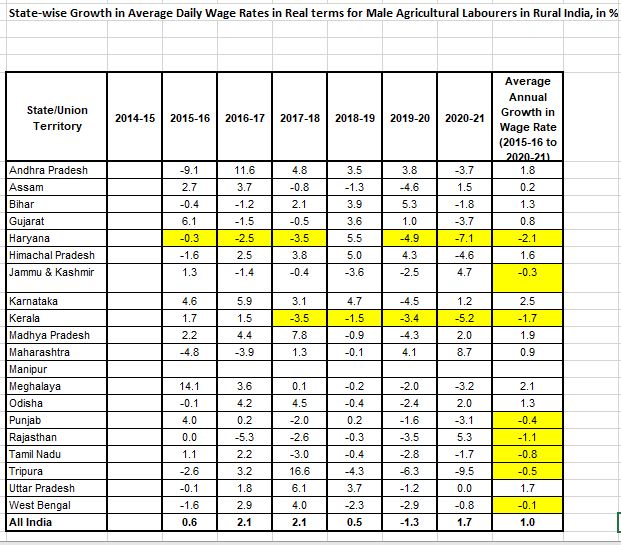
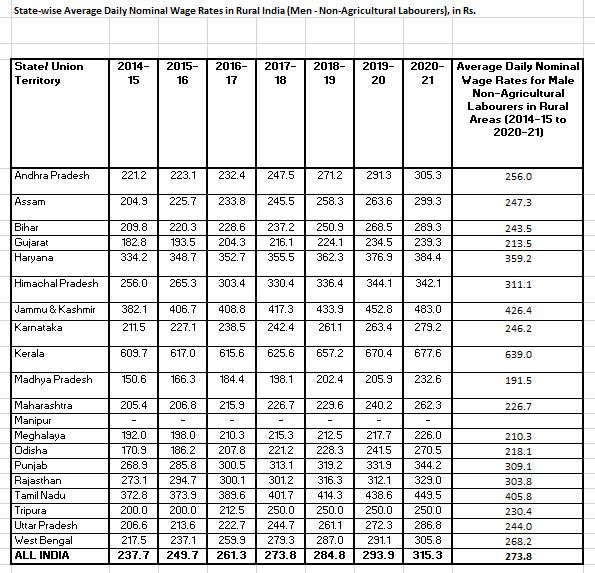
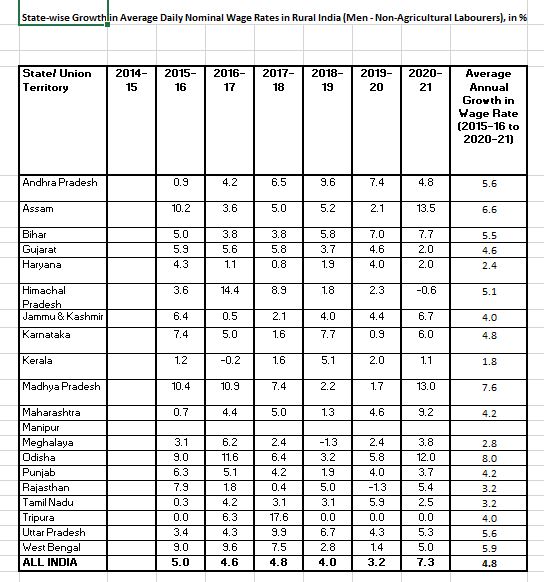
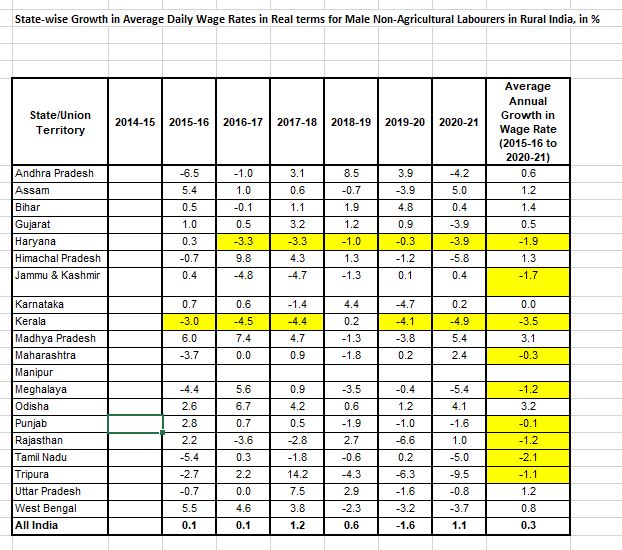
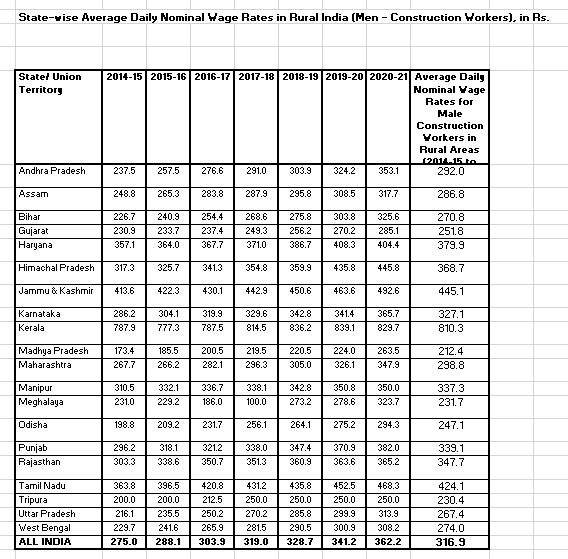
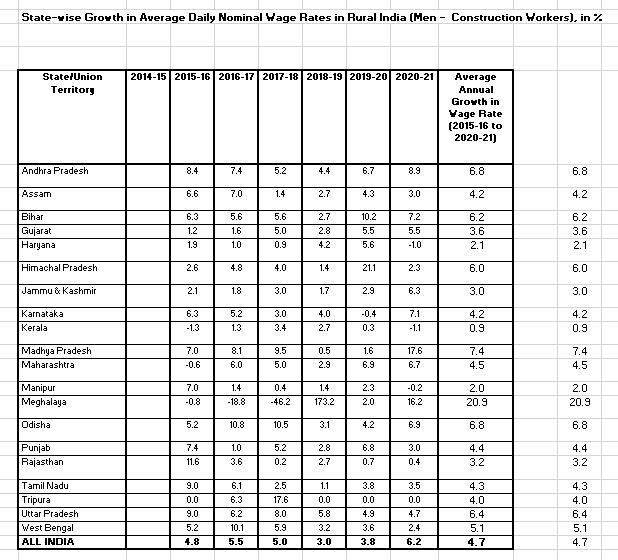
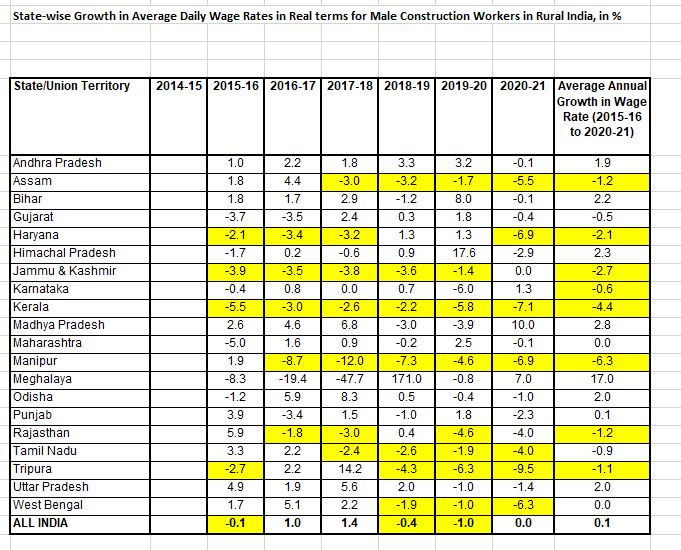