Deprecated (16384): The ArrayAccess methods will be removed in 4.0.0.Use getParam(), getData() and getQuery() instead. - /home/brlfuser/public_html/src/Controller/ArtileDetailController.php, line: 73
You can disable deprecation warnings by setting `Error.errorLevel` to `E_ALL & ~E_USER_DEPRECATED` in your config/app.php. [CORE/src/Core/functions.php, line 311]
deprecationWarning - CORE/src/Core/functions.php, line 311
Cake\Http\ServerRequest::offsetGet() - CORE/src/Http/ServerRequest.php, line 2421
App\Controller\ArtileDetailController::printArticle() - APP/Controller/ArtileDetailController.php, line 73
Cake\Controller\Controller::invokeAction() - CORE/src/Controller/Controller.php, line 610
Cake\Http\ActionDispatcher::_invoke() - CORE/src/Http/ActionDispatcher.php, line 120
Cake\Http\ActionDispatcher::dispatch() - CORE/src/Http/ActionDispatcher.php, line 94
Cake\Http\BaseApplication::__invoke() - CORE/src/Http/BaseApplication.php, line 235
Cake\Http\Runner::__invoke() - CORE/src/Http/Runner.php, line 65
Cake\Routing\Middleware\RoutingMiddleware::__invoke() - CORE/src/Routing/Middleware/RoutingMiddleware.php, line 162
Cake\Http\Runner::__invoke() - CORE/src/Http/Runner.php, line 65
Cake\Routing\Middleware\AssetMiddleware::__invoke() - CORE/src/Routing/Middleware/AssetMiddleware.php, line 88
Cake\Http\Runner::__invoke() - CORE/src/Http/Runner.php, line 65
Cake\Error\Middleware\ErrorHandlerMiddleware::__invoke() - CORE/src/Error/Middleware/ErrorHandlerMiddleware.php, line 96
Cake\Http\Runner::__invoke() - CORE/src/Http/Runner.php, line 65
Cake\Http\Runner::run() - CORE/src/Http/Runner.php, line 51
Cake\Http\Server::run() - CORE/src/Http/Server.php, line 98
Deprecated (16384): The ArrayAccess methods will be removed in 4.0.0.Use getParam(), getData() and getQuery() instead. - /home/brlfuser/public_html/src/Controller/ArtileDetailController.php, line: 74
You can disable deprecation warnings by setting `Error.errorLevel` to `E_ALL & ~E_USER_DEPRECATED` in your config/app.php. [CORE/src/Core/functions.php, line 311]
deprecationWarning - CORE/src/Core/functions.php, line 311
Cake\Http\ServerRequest::offsetGet() - CORE/src/Http/ServerRequest.php, line 2421
App\Controller\ArtileDetailController::printArticle() - APP/Controller/ArtileDetailController.php, line 74
Cake\Controller\Controller::invokeAction() - CORE/src/Controller/Controller.php, line 610
Cake\Http\ActionDispatcher::_invoke() - CORE/src/Http/ActionDispatcher.php, line 120
Cake\Http\ActionDispatcher::dispatch() - CORE/src/Http/ActionDispatcher.php, line 94
Cake\Http\BaseApplication::__invoke() - CORE/src/Http/BaseApplication.php, line 235
Cake\Http\Runner::__invoke() - CORE/src/Http/Runner.php, line 65
Cake\Routing\Middleware\RoutingMiddleware::__invoke() - CORE/src/Routing/Middleware/RoutingMiddleware.php, line 162
Cake\Http\Runner::__invoke() - CORE/src/Http/Runner.php, line 65
Cake\Routing\Middleware\AssetMiddleware::__invoke() - CORE/src/Routing/Middleware/AssetMiddleware.php, line 88
Cake\Http\Runner::__invoke() - CORE/src/Http/Runner.php, line 65
Cake\Error\Middleware\ErrorHandlerMiddleware::__invoke() - CORE/src/Error/Middleware/ErrorHandlerMiddleware.php, line 96
Cake\Http\Runner::__invoke() - CORE/src/Http/Runner.php, line 65
Cake\Http\Runner::run() - CORE/src/Http/Runner.php, line 51
Cake\Http\Server::run() - CORE/src/Http/Server.php, line 98
Warning (512): Unable to emit headers. Headers sent in file=/home/brlfuser/public_html/vendor/cakephp/cakephp/src/Error/Debugger.php line=853 [CORE/src/Http/ResponseEmitter.php, line 48]
if (Configure::read('debug')) {
trigger_error($message, E_USER_WARNING);
} else {
$response = object(Cake\Http\Response) {
'status' => (int) 200,
'contentType' => 'text/html',
'headers' => [
'Content-Type' => [
[maximum depth reached]
]
],
'file' => null,
'fileRange' => [],
'cookies' => object(Cake\Http\Cookie\CookieCollection) {},
'cacheDirectives' => [],
'body' => '<!DOCTYPE html PUBLIC "-//W3C//DTD XHTML 1.0 Transitional//EN"
"http://www.w3.org/TR/xhtml1/DTD/xhtml1-transitional.dtd">
<html xmlns="http://www.w3.org/1999/xhtml">
<head>
<link rel="canonical" href="https://im4change.in/<pre class="cake-error"><a href="javascript:void(0);" onclick="document.getElementById('cakeErr67ec661ed5632-trace').style.display = (document.getElementById('cakeErr67ec661ed5632-trace').style.display == 'none' ? '' : 'none');"><b>Notice</b> (8)</a>: Undefined variable: urlPrefix [<b>APP/Template/Layout/printlayout.ctp</b>, line <b>8</b>]<div id="cakeErr67ec661ed5632-trace" class="cake-stack-trace" style="display: none;"><a href="javascript:void(0);" onclick="document.getElementById('cakeErr67ec661ed5632-code').style.display = (document.getElementById('cakeErr67ec661ed5632-code').style.display == 'none' ? '' : 'none')">Code</a> <a href="javascript:void(0);" onclick="document.getElementById('cakeErr67ec661ed5632-context').style.display = (document.getElementById('cakeErr67ec661ed5632-context').style.display == 'none' ? '' : 'none')">Context</a><pre id="cakeErr67ec661ed5632-code" class="cake-code-dump" style="display: none;"><code><span style="color: #000000"><span style="color: #0000BB"></span><span style="color: #007700"><</span><span style="color: #0000BB">head</span><span style="color: #007700">>
</span></span></code>
<span class="code-highlight"><code><span style="color: #000000"> <link rel="canonical" href="<span style="color: #0000BB"><?php </span><span style="color: #007700">echo </span><span style="color: #0000BB">Configure</span><span style="color: #007700">::</span><span style="color: #0000BB">read</span><span style="color: #007700">(</span><span style="color: #DD0000">'SITE_URL'</span><span style="color: #007700">); </span><span style="color: #0000BB">?><?php </span><span style="color: #007700">echo </span><span style="color: #0000BB">$urlPrefix</span><span style="color: #007700">;</span><span style="color: #0000BB">?><?php </span><span style="color: #007700">echo </span><span style="color: #0000BB">$article_current</span><span style="color: #007700">-></span><span style="color: #0000BB">category</span><span style="color: #007700">-></span><span style="color: #0000BB">slug</span><span style="color: #007700">; </span><span style="color: #0000BB">?></span>/<span style="color: #0000BB"><?php </span><span style="color: #007700">echo </span><span style="color: #0000BB">$article_current</span><span style="color: #007700">-></span><span style="color: #0000BB">seo_url</span><span style="color: #007700">; </span><span style="color: #0000BB">?></span>.html"/>
</span></code></span>
<code><span style="color: #000000"><span style="color: #0000BB"> </span><span style="color: #007700"><</span><span style="color: #0000BB">meta http</span><span style="color: #007700">-</span><span style="color: #0000BB">equiv</span><span style="color: #007700">=</span><span style="color: #DD0000">"Content-Type" </span><span style="color: #0000BB">content</span><span style="color: #007700">=</span><span style="color: #DD0000">"text/html; charset=utf-8"</span><span style="color: #007700">/>
</span></span></code></pre><pre id="cakeErr67ec661ed5632-context" class="cake-context" style="display: none;">$viewFile = '/home/brlfuser/public_html/src/Template/Layout/printlayout.ctp'
$dataForView = [
'article_current' => object(App\Model\Entity\Article) {
'id' => (int) 64906,
'title' => 'Top 10% of Urban Indian Households has 7,517 Times the Assets of the Bottom Decile',
'subheading' => null,
'description' => '<p>The average value of assets (AVA) of the top ten percent of urban households in India is more than seven thousand five hundred times greater than what the bottom ten percent owns. The AVA of the top decile was Rs. 1.5 crores, while the lowest decile owned an average of Rs. 2,000 of assets. The data is part of the <a href="https://mospi.gov.in/sites/default/files/publication_reports/Report_no588-AIDIS-77R-SeptFinal_0.pdf">All India Debt and Investment Survey - 2019</a>,&nbsp;the survey for which was carried out between January-December, 2019 by the National Sample Survey Organization in its 77th round. Information on the assets and liabilities of households as of 30 June, 2018. The survey was spread over 5,940 villages covering 69,455 households in the rural sector and 3,995 blocks covering 47,006 households in the urban sector.</p>
<p><strong>Figure 1: Average value of Assets (000&#39; Rs.) by decile class of asset holding</strong></p>
<p><iframe class="flourish-embed-iframe" frameborder="0" scrolling="no" src="https://flo.uri.sh/visualisation/13083254/embed" style="width:100%;height:600px;" title="Interactive or visual content"></iframe></p>
<div style="margin-top:4px!important; text-align:right!important; width:100%!"><a class="flourish-credit" href="https://public.flourish.studio/visualisation/13083254/?utm_source=embed&amp;utm_campaign=visualisation/13083254" style="text-decoration:none!important" target="_top"><img alt="Made with Flourish" src="https://public.flourish.studio/resources/made_with_flourish.svg" style="border:none!important; height:16px!important; margin:0!important; width:105px!important" /> </a></div>
<p><strong>Source:</strong> <em>NSS Report no. 588: All India Debt &amp; Investment Survey-2019, Ministry of Statistics &amp; Programme Implementation</em></p>
<p>&nbsp;</p>
<p>The chart shows the average value of assets per decile. Up till the fourth decile (30-40 percent) urban&nbsp;Indians are worse off than rural Indians, but from the fifth decile onwards the AVA of city dwellers starts outstripping rural residents. The survey suggests that rural households are better off than urban ones at the lower deciles. &nbsp; &nbsp;</p>
<p>Rural inequality is not as stark as in urban areas. The difference between the top and the bottom declines is 198. Meaning the top 10 percent of rural households owns on average 198 times the assets of the bottom 10 percent. The AVA of the 10th decile of rural households is Rs. 81.17 lakh while households in the 1st decile hold on average Rs. 41,000.&nbsp;<br />
<br />
Household assets are defined in the report as everything owned by the household that has monetary value. This includes physical assets like land, buildings, livestock, agricultural machinery and implements, non-farm business equipment, all transport equipment, and financial assets like receivable on loans advanced in cash or in kind, shares in companies and cooperative societies, banks, etc., national saving certificates and the like, deposits in companies, banks, post offices and with individuals.</p>
<p>What about a breakdown by social group? The report has gathered caste-wise data on ownership of assets.&nbsp;</p>
<p>&nbsp;</p>
<p><strong>Table 1: Average Value of Assets by Social Group</strong><br />
<img alt="" src="/upload/images/AVA%20social%20group.PNG" style="height:288px; width:851px" /></p>
<p><strong>Source:</strong> NSS Report no. 588: All India Debt &amp; Investment Survey-2019, Ministry of Statistics &amp; Programme Implementation</p>
<p>&nbsp;</p>
<p>The table above shows that Scheduled Castes (SCs) are the worst off when it comes to asset ownership. The average assets of a rural SC households are equivalent to Rs. 8.79 lakh, while the figure for urban households is Rs. 13.15 lakh. Scheduled Tribes&nbsp;(STs) are slightly better off at Rs. 8.84 lakh and Rs. 18.9 lakh respectively. Other Backward Classes (OBC) households in rural areas own twice the assets of SCs and STs, at Rs. 16.45 lakh while their urban counterparts own an average of Rs. 21.2 lakhs in assets. The Upper Castes, classified as &lsquo;Others&rsquo; in the report, are the richest. Rural households own an average of Rs. 26.03 lakh while urban households own Rs. 40.54 lakh in assets.&nbsp;</p>
<p>&nbsp;</p>
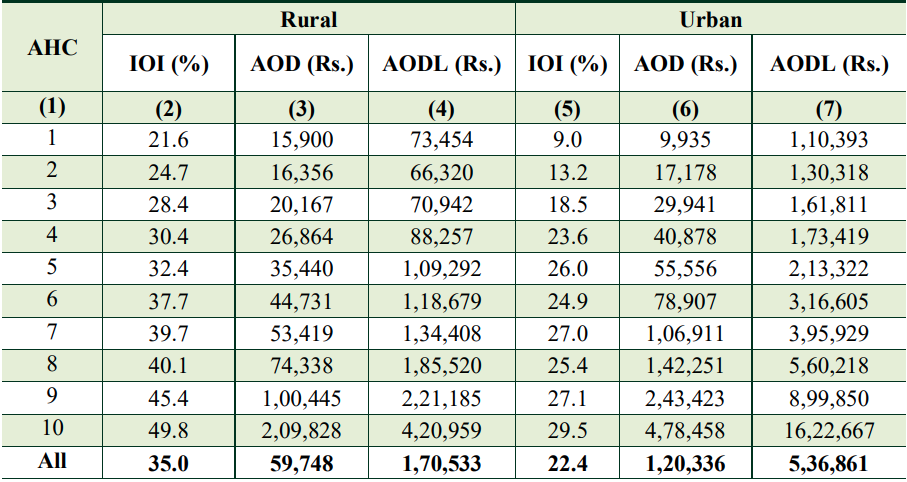
<p><strong>Table 2: Incidence of indebtedness (IOI), Average amount of Debt (AOD) per household &amp; AOD per indebted household</strong></p>
<p><strong><img alt="" src="/upload/images/Household%20indebtedness.PNG" style="height:482px; width:907px" /></strong></p>
<p><strong>Source: </strong>NSS Report no. 588: All India Debt &amp; Investment Survey-2019, Ministry of Statistics &amp; Programme Implementation</p>
<p>&nbsp;</p>
<p>This table shows us that rural indebtedness is higher than urban indebtedness, with 35 percent of rural households reporting being in debt compared to 22.4 percent of urban households. However, the average amount of debt of rural households is lower than their urban counterparts: Rs. 59,748 (rural) and Rs. 1,20,336 (urban). &nbsp;&nbsp;<br />
<br />
We have three different data points, if from 2018. In the intervening period the Covid-19 pandemic induced lockdowns precipitated a reverse migration and disrupted economic activity. We don&rsquo;t have data on debt and investment for the post-pandemic period, but let us try and put these numbers in context.<br />
<br />
The India supplement of the Oxfam Inequality report, released in January 2023, states that the gap between the rich and the poor in India has been rising. In 2020 the income share of the bottom 50 percent of the population is estimated to have fallen to 13 percent of the national income and less than 3 per cent of the total wealth. This is in stark contrast to the top 30 percent who own more than 90 per cent of the total wealth. Of this, the wealthiest 10 per cent own more than 72 percent of the total wealth while the top 1 percent own nearly 40.6 per cent of the total wealth in India. &nbsp;<br />
<br />
According to the Oxfam report, &ldquo;The country still has the world&rsquo;s highest number of poor at 228.9 million. On the other hand, the total number of billionaires in India increased from 102 in 2020 to 166 billionaires in 2022&rdquo;.&nbsp;<br />
The impact of this wealth concentration has been &ldquo;exceptionally poor diets, increase in debt and deaths&rdquo;. Furthermore, &ldquo;the concentration of wealth continues to be around primordial characteristics such as caste, with some communities such as the Scheduled Tribes (STs) suffering from physical remoteness and systematic exclusion&rdquo;.</p>
<p><strong>References</strong><br />
All India Debt and Investment Survey - 2019, NSS 77th Round, Ministry of Statistics &amp; Programme Implementation. Please click here to read the&nbsp;<a href="https://mospi.gov.in/sites/default/files/publication_reports/Report_no588-AIDIS-77R-SeptFinal_0.pdf">report</a>&nbsp;<br />
Survival of the Richest, the India Story, 2023, Oxfam India. Please click here for the <a href="https://d1ns4ht6ytuzzo.cloudfront.net/oxfamdata/oxfamdatapublic/2023-01/India%20Supplement%202023_digital.pdf?kz3wav0jbhJdvkJ.fK1rj1k1_5ap9FhQ%C2%A0">report&nbsp;</a></p>
',
'credit_writer' => 'Inclusive Media for Change, 23 March, 2023',
'article_img' => 'Mazdoor sangharsh.jpeg',
'article_img_thumb' => 'Mazdoor sangharsh.jpeg',
'status' => (int) 1,
'show_on_home' => (int) 1,
'lang' => 'EN',
'category_id' => (int) 4,
'tag_keyword' => '',
'seo_url' => 'top-10-of-urban-indian-households-has-7-517-times-the-assets-of-the-bottom-decile',
'meta_title' => '',
'meta_keywords' => '',
'meta_description' => '',
'noindex' => (int) 1,
'publish_date' => object(Cake\I18n\FrozenDate) {},
'most_visit_section_id' => null,
'article_big_img' => null,
'liveid' => null,
'created' => object(Cake\I18n\FrozenTime) {},
'modified' => object(Cake\I18n\FrozenTime) {},
'edate' => '',
'tags' => [
[maximum depth reached]
],
'category' => object(App\Model\Entity\Category) {},
'[new]' => false,
'[accessible]' => [
[maximum depth reached]
],
'[dirty]' => [[maximum depth reached]],
'[original]' => [[maximum depth reached]],
'[virtual]' => [[maximum depth reached]],
'[hasErrors]' => false,
'[errors]' => [[maximum depth reached]],
'[invalid]' => [[maximum depth reached]],
'[repository]' => 'Articles'
},
'articleid' => (int) 64906,
'metaTitle' => 'NEWS ALERTS | Top 10% of Urban Indian Households has 7,517 Times the Assets of the Bottom Decile',
'metaKeywords' => 'Average Value of Assets,Debt,Debt and Investment,Indebtedness,India,Inequality,National Sample Survey Organisation,NSSO,Oxfam,Urban Poverty,Wealth disparity',
'metaDesc' => 'The average value of assets (AVA) of the top ten percent of urban households in India is more than seven thousand five hundred times greater than what the bottom ten percent owns. The AVA of the top decile was Rs....',
'disp' => '<p>The average value of assets (AVA) of the top ten percent of urban households in India is more than seven thousand five hundred times greater than what the bottom ten percent owns. The AVA of the top decile was Rs. 1.5 crores, while the lowest decile owned an average of Rs. 2,000 of assets. The data is part of the <a href="https://mospi.gov.in/sites/default/files/publication_reports/Report_no588-AIDIS-77R-SeptFinal_0.pdf" title="https://mospi.gov.in/sites/default/files/publication_reports/Report_no588-AIDIS-77R-SeptFinal_0.pdf">All India Debt and Investment Survey - 2019</a>,&nbsp;the survey for which was carried out between January-December, 2019 by the National Sample Survey Organization in its 77th round. Information on the assets and liabilities of households as of 30 June, 2018. The survey was spread over 5,940 villages covering 69,455 households in the rural sector and 3,995 blocks covering 47,006 households in the urban sector.</p><p><strong>Figure 1: Average value of Assets (000&#39; Rs.) by decile class of asset holding</strong></p><p><iframe class="flourish-embed-iframe" frameborder="0" scrolling="no" src="https://flo.uri.sh/visualisation/13083254/embed" style="width:100%;height:600px;" title="Interactive or visual content"></iframe></p><div style="margin-top:4px!important; text-align:right!important; width:100%!"><a href="https://public.flourish.studio/visualisation/13083254/?utm_source=embed&amp;utm_campaign=visualisation/13083254" style="text-decoration:none!important" target="_top" title="https://public.flourish.studio/visualisation/13083254/?utm_source=embed&amp;utm_campaign=visualisation/13083254" style="text-decoration:none!important" target="_top"> </a></div><p><strong>Source:</strong> <em>NSS Report no. 588: All India Debt &amp; Investment Survey-2019, Ministry of Statistics &amp; Programme Implementation</em></p><p>&nbsp;</p><p>The chart shows the average value of assets per decile. Up till the fourth decile (30-40 percent) urban&nbsp;Indians are worse off than rural Indians, but from the fifth decile onwards the AVA of city dwellers starts outstripping rural residents. The survey suggests that rural households are better off than urban ones at the lower deciles. &nbsp; &nbsp;</p><p>Rural inequality is not as stark as in urban areas. The difference between the top and the bottom declines is 198. Meaning the top 10 percent of rural households owns on average 198 times the assets of the bottom 10 percent. The AVA of the 10th decile of rural households is Rs. 81.17 lakh while households in the 1st decile hold on average Rs. 41,000.&nbsp;<br /><br />Household assets are defined in the report as everything owned by the household that has monetary value. This includes physical assets like land, buildings, livestock, agricultural machinery and implements, non-farm business equipment, all transport equipment, and financial assets like receivable on loans advanced in cash or in kind, shares in companies and cooperative societies, banks, etc., national saving certificates and the like, deposits in companies, banks, post offices and with individuals.</p><p>What about a breakdown by social group? The report has gathered caste-wise data on ownership of assets.&nbsp;</p><p>&nbsp;</p><p><strong>Table 1: Average Value of Assets by Social Group</strong><br /><img alt="" src="/upload/images/AVA%20social%20group.PNG" style="height:288px; width:851px" /></p><p><strong>Source:</strong> NSS Report no. 588: All India Debt &amp; Investment Survey-2019, Ministry of Statistics &amp; Programme Implementation</p><p>&nbsp;</p><p>The table above shows that Scheduled Castes (SCs) are the worst off when it comes to asset ownership. The average assets of a rural SC households are equivalent to Rs. 8.79 lakh, while the figure for urban households is Rs. 13.15 lakh. Scheduled Tribes&nbsp;(STs) are slightly better off at Rs. 8.84 lakh and Rs. 18.9 lakh respectively. Other Backward Classes (OBC) households in rural areas own twice the assets of SCs and STs, at Rs. 16.45 lakh while their urban counterparts own an average of Rs. 21.2 lakhs in assets. The Upper Castes, classified as &lsquo;Others&rsquo; in the report, are the richest. Rural households own an average of Rs. 26.03 lakh while urban households own Rs. 40.54 lakh in assets.&nbsp;</p><p>&nbsp;</p><p><strong>Table 2: Incidence of indebtedness (IOI), Average amount of Debt (AOD) per household &amp; AOD per indebted household</strong></p><p><strong><img alt="" src="/upload/images/Household%20indebtedness.PNG" style="height:482px; width:907px" /></strong></p><p><strong>Source: </strong>NSS Report no. 588: All India Debt &amp; Investment Survey-2019, Ministry of Statistics &amp; Programme Implementation</p><p>&nbsp;</p><p>This table shows us that rural indebtedness is higher than urban indebtedness, with 35 percent of rural households reporting being in debt compared to 22.4 percent of urban households. However, the average amount of debt of rural households is lower than their urban counterparts: Rs. 59,748 (rural) and Rs. 1,20,336 (urban). &nbsp;&nbsp;<br /><br />We have three different data points, if from 2018. In the intervening period the Covid-19 pandemic induced lockdowns precipitated a reverse migration and disrupted economic activity. We don&rsquo;t have data on debt and investment for the post-pandemic period, but let us try and put these numbers in context.<br /><br />The India supplement of the Oxfam Inequality report, released in January 2023, states that the gap between the rich and the poor in India has been rising. In 2020 the income share of the bottom 50 percent of the population is estimated to have fallen to 13 percent of the national income and less than 3 per cent of the total wealth. This is in stark contrast to the top 30 percent who own more than 90 per cent of the total wealth. Of this, the wealthiest 10 per cent own more than 72 percent of the total wealth while the top 1 percent own nearly 40.6 per cent of the total wealth in India. &nbsp;<br /><br />According to the Oxfam report, &ldquo;The country still has the world&rsquo;s highest number of poor at 228.9 million. On the other hand, the total number of billionaires in India increased from 102 in 2020 to 166 billionaires in 2022&rdquo;.&nbsp;<br />The impact of this wealth concentration has been &ldquo;exceptionally poor diets, increase in debt and deaths&rdquo;. Furthermore, &ldquo;the concentration of wealth continues to be around primordial characteristics such as caste, with some communities such as the Scheduled Tribes (STs) suffering from physical remoteness and systematic exclusion&rdquo;.</p><p><strong>References</strong><br />All India Debt and Investment Survey - 2019, NSS 77th Round, Ministry of Statistics &amp; Programme Implementation. Please click here to read the&nbsp;<a href="https://mospi.gov.in/sites/default/files/publication_reports/Report_no588-AIDIS-77R-SeptFinal_0.pdf" title="https://mospi.gov.in/sites/default/files/publication_reports/Report_no588-AIDIS-77R-SeptFinal_0.pdf">report</a>&nbsp;<br />Survival of the Richest, the India Story, 2023, Oxfam India. Please click here for the <a href="https://d1ns4ht6ytuzzo.cloudfront.net/oxfamdata/oxfamdatapublic/2023-01/India%20Supplement%202023_digital.pdf?kz3wav0jbhJdvkJ.fK1rj1k1_5ap9FhQ%C2%A0" title="https://d1ns4ht6ytuzzo.cloudfront.net/oxfamdata/oxfamdatapublic/2023-01/India%20Supplement%202023_digital.pdf?kz3wav0jbhJdvkJ.fK1rj1k1_5ap9FhQ%C2%A0">report&nbsp;</a></p>',
'lang' => 'English',
'SITE_URL' => 'https://im4change.in/',
'site_title' => 'im4change',
'adminprix' => 'admin'
]
$article_current = object(App\Model\Entity\Article) {
'id' => (int) 64906,
'title' => 'Top 10% of Urban Indian Households has 7,517 Times the Assets of the Bottom Decile',
'subheading' => null,
'description' => '<p>The average value of assets (AVA) of the top ten percent of urban households in India is more than seven thousand five hundred times greater than what the bottom ten percent owns. The AVA of the top decile was Rs. 1.5 crores, while the lowest decile owned an average of Rs. 2,000 of assets. The data is part of the <a href="https://mospi.gov.in/sites/default/files/publication_reports/Report_no588-AIDIS-77R-SeptFinal_0.pdf">All India Debt and Investment Survey - 2019</a>,&nbsp;the survey for which was carried out between January-December, 2019 by the National Sample Survey Organization in its 77th round. Information on the assets and liabilities of households as of 30 June, 2018. The survey was spread over 5,940 villages covering 69,455 households in the rural sector and 3,995 blocks covering 47,006 households in the urban sector.</p>
<p><strong>Figure 1: Average value of Assets (000&#39; Rs.) by decile class of asset holding</strong></p>
<p><iframe class="flourish-embed-iframe" frameborder="0" scrolling="no" src="https://flo.uri.sh/visualisation/13083254/embed" style="width:100%;height:600px;" title="Interactive or visual content"></iframe></p>
<div style="margin-top:4px!important; text-align:right!important; width:100%!"><a class="flourish-credit" href="https://public.flourish.studio/visualisation/13083254/?utm_source=embed&amp;utm_campaign=visualisation/13083254" style="text-decoration:none!important" target="_top"><img alt="Made with Flourish" src="https://public.flourish.studio/resources/made_with_flourish.svg" style="border:none!important; height:16px!important; margin:0!important; width:105px!important" /> </a></div>
<p><strong>Source:</strong> <em>NSS Report no. 588: All India Debt &amp; Investment Survey-2019, Ministry of Statistics &amp; Programme Implementation</em></p>
<p>&nbsp;</p>
<p>The chart shows the average value of assets per decile. Up till the fourth decile (30-40 percent) urban&nbsp;Indians are worse off than rural Indians, but from the fifth decile onwards the AVA of city dwellers starts outstripping rural residents. The survey suggests that rural households are better off than urban ones at the lower deciles. &nbsp; &nbsp;</p>
<p>Rural inequality is not as stark as in urban areas. The difference between the top and the bottom declines is 198. Meaning the top 10 percent of rural households owns on average 198 times the assets of the bottom 10 percent. The AVA of the 10th decile of rural households is Rs. 81.17 lakh while households in the 1st decile hold on average Rs. 41,000.&nbsp;<br />
<br />
Household assets are defined in the report as everything owned by the household that has monetary value. This includes physical assets like land, buildings, livestock, agricultural machinery and implements, non-farm business equipment, all transport equipment, and financial assets like receivable on loans advanced in cash or in kind, shares in companies and cooperative societies, banks, etc., national saving certificates and the like, deposits in companies, banks, post offices and with individuals.</p>
<p>What about a breakdown by social group? The report has gathered caste-wise data on ownership of assets.&nbsp;</p>
<p>&nbsp;</p>
<p><strong>Table 1: Average Value of Assets by Social Group</strong><br />
<img alt="" src="/upload/images/AVA%20social%20group.PNG" style="height:288px; width:851px" /></p>
<p><strong>Source:</strong> NSS Report no. 588: All India Debt &amp; Investment Survey-2019, Ministry of Statistics &amp; Programme Implementation</p>
<p>&nbsp;</p>
<p>The table above shows that Scheduled Castes (SCs) are the worst off when it comes to asset ownership. The average assets of a rural SC households are equivalent to Rs. 8.79 lakh, while the figure for urban households is Rs. 13.15 lakh. Scheduled Tribes&nbsp;(STs) are slightly better off at Rs. 8.84 lakh and Rs. 18.9 lakh respectively. Other Backward Classes (OBC) households in rural areas own twice the assets of SCs and STs, at Rs. 16.45 lakh while their urban counterparts own an average of Rs. 21.2 lakhs in assets. The Upper Castes, classified as &lsquo;Others&rsquo; in the report, are the richest. Rural households own an average of Rs. 26.03 lakh while urban households own Rs. 40.54 lakh in assets.&nbsp;</p>
<p>&nbsp;</p>
<p><strong>Table 2: Incidence of indebtedness (IOI), Average amount of Debt (AOD) per household &amp; AOD per indebted household</strong></p>
<p><strong><img alt="" src="/upload/images/Household%20indebtedness.PNG" style="height:482px; width:907px" /></strong></p>
<p><strong>Source: </strong>NSS Report no. 588: All India Debt &amp; Investment Survey-2019, Ministry of Statistics &amp; Programme Implementation</p>
<p>&nbsp;</p>
<p>This table shows us that rural indebtedness is higher than urban indebtedness, with 35 percent of rural households reporting being in debt compared to 22.4 percent of urban households. However, the average amount of debt of rural households is lower than their urban counterparts: Rs. 59,748 (rural) and Rs. 1,20,336 (urban). &nbsp;&nbsp;<br />
<br />
We have three different data points, if from 2018. In the intervening period the Covid-19 pandemic induced lockdowns precipitated a reverse migration and disrupted economic activity. We don&rsquo;t have data on debt and investment for the post-pandemic period, but let us try and put these numbers in context.<br />
<br />
The India supplement of the Oxfam Inequality report, released in January 2023, states that the gap between the rich and the poor in India has been rising. In 2020 the income share of the bottom 50 percent of the population is estimated to have fallen to 13 percent of the national income and less than 3 per cent of the total wealth. This is in stark contrast to the top 30 percent who own more than 90 per cent of the total wealth. Of this, the wealthiest 10 per cent own more than 72 percent of the total wealth while the top 1 percent own nearly 40.6 per cent of the total wealth in India. &nbsp;<br />
<br />
According to the Oxfam report, &ldquo;The country still has the world&rsquo;s highest number of poor at 228.9 million. On the other hand, the total number of billionaires in India increased from 102 in 2020 to 166 billionaires in 2022&rdquo;.&nbsp;<br />
The impact of this wealth concentration has been &ldquo;exceptionally poor diets, increase in debt and deaths&rdquo;. Furthermore, &ldquo;the concentration of wealth continues to be around primordial characteristics such as caste, with some communities such as the Scheduled Tribes (STs) suffering from physical remoteness and systematic exclusion&rdquo;.</p>
<p><strong>References</strong><br />
All India Debt and Investment Survey - 2019, NSS 77th Round, Ministry of Statistics &amp; Programme Implementation. Please click here to read the&nbsp;<a href="https://mospi.gov.in/sites/default/files/publication_reports/Report_no588-AIDIS-77R-SeptFinal_0.pdf">report</a>&nbsp;<br />
Survival of the Richest, the India Story, 2023, Oxfam India. Please click here for the <a href="https://d1ns4ht6ytuzzo.cloudfront.net/oxfamdata/oxfamdatapublic/2023-01/India%20Supplement%202023_digital.pdf?kz3wav0jbhJdvkJ.fK1rj1k1_5ap9FhQ%C2%A0">report&nbsp;</a></p>
',
'credit_writer' => 'Inclusive Media for Change, 23 March, 2023',
'article_img' => 'Mazdoor sangharsh.jpeg',
'article_img_thumb' => 'Mazdoor sangharsh.jpeg',
'status' => (int) 1,
'show_on_home' => (int) 1,
'lang' => 'EN',
'category_id' => (int) 4,
'tag_keyword' => '',
'seo_url' => 'top-10-of-urban-indian-households-has-7-517-times-the-assets-of-the-bottom-decile',
'meta_title' => '',
'meta_keywords' => '',
'meta_description' => '',
'noindex' => (int) 1,
'publish_date' => object(Cake\I18n\FrozenDate) {},
'most_visit_section_id' => null,
'article_big_img' => null,
'liveid' => null,
'created' => object(Cake\I18n\FrozenTime) {},
'modified' => object(Cake\I18n\FrozenTime) {},
'edate' => '',
'tags' => [
(int) 0 => object(Cake\ORM\Entity) {},
(int) 1 => object(Cake\ORM\Entity) {},
(int) 2 => object(Cake\ORM\Entity) {},
(int) 3 => object(Cake\ORM\Entity) {},
(int) 4 => object(Cake\ORM\Entity) {},
(int) 5 => object(Cake\ORM\Entity) {},
(int) 6 => object(Cake\ORM\Entity) {},
(int) 7 => object(Cake\ORM\Entity) {},
(int) 8 => object(Cake\ORM\Entity) {},
(int) 9 => object(Cake\ORM\Entity) {},
(int) 10 => object(Cake\ORM\Entity) {}
],
'category' => object(App\Model\Entity\Category) {},
'[new]' => false,
'[accessible]' => [
'*' => true,
'id' => false
],
'[dirty]' => [],
'[original]' => [],
'[virtual]' => [],
'[hasErrors]' => false,
'[errors]' => [],
'[invalid]' => [],
'[repository]' => 'Articles'
}
$articleid = (int) 64906
$metaTitle = 'NEWS ALERTS | Top 10% of Urban Indian Households has 7,517 Times the Assets of the Bottom Decile'
$metaKeywords = 'Average Value of Assets,Debt,Debt and Investment,Indebtedness,India,Inequality,National Sample Survey Organisation,NSSO,Oxfam,Urban Poverty,Wealth disparity'
$metaDesc = 'The average value of assets (AVA) of the top ten percent of urban households in India is more than seven thousand five hundred times greater than what the bottom ten percent owns. The AVA of the top decile was Rs....'
$disp = '<p>The average value of assets (AVA) of the top ten percent of urban households in India is more than seven thousand five hundred times greater than what the bottom ten percent owns. The AVA of the top decile was Rs. 1.5 crores, while the lowest decile owned an average of Rs. 2,000 of assets. The data is part of the <a href="https://mospi.gov.in/sites/default/files/publication_reports/Report_no588-AIDIS-77R-SeptFinal_0.pdf" title="https://mospi.gov.in/sites/default/files/publication_reports/Report_no588-AIDIS-77R-SeptFinal_0.pdf">All India Debt and Investment Survey - 2019</a>,&nbsp;the survey for which was carried out between January-December, 2019 by the National Sample Survey Organization in its 77th round. Information on the assets and liabilities of households as of 30 June, 2018. The survey was spread over 5,940 villages covering 69,455 households in the rural sector and 3,995 blocks covering 47,006 households in the urban sector.</p><p><strong>Figure 1: Average value of Assets (000&#39; Rs.) by decile class of asset holding</strong></p><p><iframe class="flourish-embed-iframe" frameborder="0" scrolling="no" src="https://flo.uri.sh/visualisation/13083254/embed" style="width:100%;height:600px;" title="Interactive or visual content"></iframe></p><div style="margin-top:4px!important; text-align:right!important; width:100%!"><a href="https://public.flourish.studio/visualisation/13083254/?utm_source=embed&amp;utm_campaign=visualisation/13083254" style="text-decoration:none!important" target="_top" title="https://public.flourish.studio/visualisation/13083254/?utm_source=embed&amp;utm_campaign=visualisation/13083254" style="text-decoration:none!important" target="_top"> </a></div><p><strong>Source:</strong> <em>NSS Report no. 588: All India Debt &amp; Investment Survey-2019, Ministry of Statistics &amp; Programme Implementation</em></p><p>&nbsp;</p><p>The chart shows the average value of assets per decile. Up till the fourth decile (30-40 percent) urban&nbsp;Indians are worse off than rural Indians, but from the fifth decile onwards the AVA of city dwellers starts outstripping rural residents. The survey suggests that rural households are better off than urban ones at the lower deciles. &nbsp; &nbsp;</p><p>Rural inequality is not as stark as in urban areas. The difference between the top and the bottom declines is 198. Meaning the top 10 percent of rural households owns on average 198 times the assets of the bottom 10 percent. The AVA of the 10th decile of rural households is Rs. 81.17 lakh while households in the 1st decile hold on average Rs. 41,000.&nbsp;<br /><br />Household assets are defined in the report as everything owned by the household that has monetary value. This includes physical assets like land, buildings, livestock, agricultural machinery and implements, non-farm business equipment, all transport equipment, and financial assets like receivable on loans advanced in cash or in kind, shares in companies and cooperative societies, banks, etc., national saving certificates and the like, deposits in companies, banks, post offices and with individuals.</p><p>What about a breakdown by social group? The report has gathered caste-wise data on ownership of assets.&nbsp;</p><p>&nbsp;</p><p><strong>Table 1: Average Value of Assets by Social Group</strong><br /><img alt="" src="/upload/images/AVA%20social%20group.PNG" style="height:288px; width:851px" /></p><p><strong>Source:</strong> NSS Report no. 588: All India Debt &amp; Investment Survey-2019, Ministry of Statistics &amp; Programme Implementation</p><p>&nbsp;</p><p>The table above shows that Scheduled Castes (SCs) are the worst off when it comes to asset ownership. The average assets of a rural SC households are equivalent to Rs. 8.79 lakh, while the figure for urban households is Rs. 13.15 lakh. Scheduled Tribes&nbsp;(STs) are slightly better off at Rs. 8.84 lakh and Rs. 18.9 lakh respectively. Other Backward Classes (OBC) households in rural areas own twice the assets of SCs and STs, at Rs. 16.45 lakh while their urban counterparts own an average of Rs. 21.2 lakhs in assets. The Upper Castes, classified as &lsquo;Others&rsquo; in the report, are the richest. Rural households own an average of Rs. 26.03 lakh while urban households own Rs. 40.54 lakh in assets.&nbsp;</p><p>&nbsp;</p><p><strong>Table 2: Incidence of indebtedness (IOI), Average amount of Debt (AOD) per household &amp; AOD per indebted household</strong></p><p><strong><img alt="" src="/upload/images/Household%20indebtedness.PNG" style="height:482px; width:907px" /></strong></p><p><strong>Source: </strong>NSS Report no. 588: All India Debt &amp; Investment Survey-2019, Ministry of Statistics &amp; Programme Implementation</p><p>&nbsp;</p><p>This table shows us that rural indebtedness is higher than urban indebtedness, with 35 percent of rural households reporting being in debt compared to 22.4 percent of urban households. However, the average amount of debt of rural households is lower than their urban counterparts: Rs. 59,748 (rural) and Rs. 1,20,336 (urban). &nbsp;&nbsp;<br /><br />We have three different data points, if from 2018. In the intervening period the Covid-19 pandemic induced lockdowns precipitated a reverse migration and disrupted economic activity. We don&rsquo;t have data on debt and investment for the post-pandemic period, but let us try and put these numbers in context.<br /><br />The India supplement of the Oxfam Inequality report, released in January 2023, states that the gap between the rich and the poor in India has been rising. In 2020 the income share of the bottom 50 percent of the population is estimated to have fallen to 13 percent of the national income and less than 3 per cent of the total wealth. This is in stark contrast to the top 30 percent who own more than 90 per cent of the total wealth. Of this, the wealthiest 10 per cent own more than 72 percent of the total wealth while the top 1 percent own nearly 40.6 per cent of the total wealth in India. &nbsp;<br /><br />According to the Oxfam report, &ldquo;The country still has the world&rsquo;s highest number of poor at 228.9 million. On the other hand, the total number of billionaires in India increased from 102 in 2020 to 166 billionaires in 2022&rdquo;.&nbsp;<br />The impact of this wealth concentration has been &ldquo;exceptionally poor diets, increase in debt and deaths&rdquo;. Furthermore, &ldquo;the concentration of wealth continues to be around primordial characteristics such as caste, with some communities such as the Scheduled Tribes (STs) suffering from physical remoteness and systematic exclusion&rdquo;.</p><p><strong>References</strong><br />All India Debt and Investment Survey - 2019, NSS 77th Round, Ministry of Statistics &amp; Programme Implementation. Please click here to read the&nbsp;<a href="https://mospi.gov.in/sites/default/files/publication_reports/Report_no588-AIDIS-77R-SeptFinal_0.pdf" title="https://mospi.gov.in/sites/default/files/publication_reports/Report_no588-AIDIS-77R-SeptFinal_0.pdf">report</a>&nbsp;<br />Survival of the Richest, the India Story, 2023, Oxfam India. Please click here for the <a href="https://d1ns4ht6ytuzzo.cloudfront.net/oxfamdata/oxfamdatapublic/2023-01/India%20Supplement%202023_digital.pdf?kz3wav0jbhJdvkJ.fK1rj1k1_5ap9FhQ%C2%A0" title="https://d1ns4ht6ytuzzo.cloudfront.net/oxfamdata/oxfamdatapublic/2023-01/India%20Supplement%202023_digital.pdf?kz3wav0jbhJdvkJ.fK1rj1k1_5ap9FhQ%C2%A0">report&nbsp;</a></p>'
$lang = 'English'
$SITE_URL = 'https://im4change.in/'
$site_title = 'im4change'
$adminprix = 'admin'</pre><pre class="stack-trace">include - APP/Template/Layout/printlayout.ctp, line 8
Cake\View\View::_evaluate() - CORE/src/View/View.php, line 1413
Cake\View\View::_render() - CORE/src/View/View.php, line 1374
Cake\View\View::renderLayout() - CORE/src/View/View.php, line 927
Cake\View\View::render() - CORE/src/View/View.php, line 885
Cake\Controller\Controller::render() - CORE/src/Controller/Controller.php, line 791
Cake\Http\ActionDispatcher::_invoke() - CORE/src/Http/ActionDispatcher.php, line 126
Cake\Http\ActionDispatcher::dispatch() - CORE/src/Http/ActionDispatcher.php, line 94
Cake\Http\BaseApplication::__invoke() - CORE/src/Http/BaseApplication.php, line 235
Cake\Http\Runner::__invoke() - CORE/src/Http/Runner.php, line 65
Cake\Routing\Middleware\RoutingMiddleware::__invoke() - CORE/src/Routing/Middleware/RoutingMiddleware.php, line 162
Cake\Http\Runner::__invoke() - CORE/src/Http/Runner.php, line 65
Cake\Routing\Middleware\AssetMiddleware::__invoke() - CORE/src/Routing/Middleware/AssetMiddleware.php, line 88
Cake\Http\Runner::__invoke() - CORE/src/Http/Runner.php, line 65
Cake\Error\Middleware\ErrorHandlerMiddleware::__invoke() - CORE/src/Error/Middleware/ErrorHandlerMiddleware.php, line 96
Cake\Http\Runner::__invoke() - CORE/src/Http/Runner.php, line 65
Cake\Http\Runner::run() - CORE/src/Http/Runner.php, line 51</pre></div></pre>news-alerts-57/top-10-of-urban-indian-households-has-7-517-times-the-assets-of-the-bottom-decile.html"/>
<meta http-equiv="Content-Type" content="text/html; charset=utf-8"/>
<link href="https://im4change.in/css/control.css" rel="stylesheet" type="text/css"
media="all"/>
<title>NEWS ALERTS | Top 10% of Urban Indian Households has 7,517 Times the Assets of the Bottom Decile | Im4change.org</title>
<meta name="description" content="The average value of assets (AVA) of the top ten percent of urban households in India is more than seven thousand five hundred times greater than what the bottom ten percent owns. The AVA of the top decile was Rs...."/>
<script src="https://im4change.in/js/jquery-1.10.2.js"></script>
<script type="text/javascript" src="https://im4change.in/js/jquery-migrate.min.js"></script>
<script language="javascript" type="text/javascript">
$(document).ready(function () {
var img = $("img")[0]; // Get my img elem
var pic_real_width, pic_real_height;
$("<img/>") // Make in memory copy of image to avoid css issues
.attr("src", $(img).attr("src"))
.load(function () {
pic_real_width = this.width; // Note: $(this).width() will not
pic_real_height = this.height; // work for in memory images.
});
});
</script>
<style type="text/css">
@media screen {
div.divFooter {
display: block;
}
}
@media print {
.printbutton {
display: none !important;
}
}
</style>
</head>
<body>
<table cellpadding="0" cellspacing="0" border="0" width="98%" align="center">
<tr>
<td class="top_bg">
<div class="divFooter">
<img src="https://im4change.in/images/logo1.jpg" height="59" border="0"
alt="Resource centre on India's rural distress" style="padding-top:14px;"/>
</div>
</td>
</tr>
<tr>
<td id="topspace"> </td>
</tr>
<tr id="topspace">
<td> </td>
</tr>
<tr>
<td height="50" style="border-bottom:1px solid #000; padding-top:10px;" class="printbutton">
<form><input type="button" value=" Print this page "
onclick="window.print();return false;"/></form>
</td>
</tr>
<tr>
<td width="100%">
<h1 class="news_headlines" style="font-style:normal">
<strong>Top 10% of Urban Indian Households has 7,517 Times the Assets of the Bottom Decile</strong></h1>
</td>
</tr>
<tr>
<td width="100%" style="font-family:Arial, 'Segoe Script', 'Segoe UI', sans-serif, serif"><font size="3">
<p>The average value of assets (AVA) of the top ten percent of urban households in India is more than seven thousand five hundred times greater than what the bottom ten percent owns. The AVA of the top decile was Rs. 1.5 crores, while the lowest decile owned an average of Rs. 2,000 of assets. The data is part of the <a href="https://mospi.gov.in/sites/default/files/publication_reports/Report_no588-AIDIS-77R-SeptFinal_0.pdf" title="https://mospi.gov.in/sites/default/files/publication_reports/Report_no588-AIDIS-77R-SeptFinal_0.pdf">All India Debt and Investment Survey - 2019</a>, the survey for which was carried out between January-December, 2019 by the National Sample Survey Organization in its 77th round. Information on the assets and liabilities of households as of 30 June, 2018. The survey was spread over 5,940 villages covering 69,455 households in the rural sector and 3,995 blocks covering 47,006 households in the urban sector.</p><p><strong>Figure 1: Average value of Assets (000' Rs.) by decile class of asset holding</strong></p><p><iframe class="flourish-embed-iframe" frameborder="0" scrolling="no" src="https://flo.uri.sh/visualisation/13083254/embed" style="width:100%;height:600px;" title="Interactive or visual content"></iframe></p><div style="margin-top:4px!important; text-align:right!important; width:100%!"><a href="https://public.flourish.studio/visualisation/13083254/?utm_source=embed&utm_campaign=visualisation/13083254" style="text-decoration:none!important" target="_top" title="https://public.flourish.studio/visualisation/13083254/?utm_source=embed&utm_campaign=visualisation/13083254" style="text-decoration:none!important" target="_top"> </a></div><p><strong>Source:</strong> <em>NSS Report no. 588: All India Debt & Investment Survey-2019, Ministry of Statistics & Programme Implementation</em></p><p> </p><p>The chart shows the average value of assets per decile. Up till the fourth decile (30-40 percent) urban Indians are worse off than rural Indians, but from the fifth decile onwards the AVA of city dwellers starts outstripping rural residents. The survey suggests that rural households are better off than urban ones at the lower deciles. </p><p>Rural inequality is not as stark as in urban areas. The difference between the top and the bottom declines is 198. Meaning the top 10 percent of rural households owns on average 198 times the assets of the bottom 10 percent. The AVA of the 10th decile of rural households is Rs. 81.17 lakh while households in the 1st decile hold on average Rs. 41,000. <br /><br />Household assets are defined in the report as everything owned by the household that has monetary value. This includes physical assets like land, buildings, livestock, agricultural machinery and implements, non-farm business equipment, all transport equipment, and financial assets like receivable on loans advanced in cash or in kind, shares in companies and cooperative societies, banks, etc., national saving certificates and the like, deposits in companies, banks, post offices and with individuals.</p><p>What about a breakdown by social group? The report has gathered caste-wise data on ownership of assets. </p><p> </p><p><strong>Table 1: Average Value of Assets by Social Group</strong><br /><img alt="" src="/upload/images/AVA%20social%20group.PNG" style="height:288px; width:851px" /></p><p><strong>Source:</strong> NSS Report no. 588: All India Debt & Investment Survey-2019, Ministry of Statistics & Programme Implementation</p><p> </p><p>The table above shows that Scheduled Castes (SCs) are the worst off when it comes to asset ownership. The average assets of a rural SC households are equivalent to Rs. 8.79 lakh, while the figure for urban households is Rs. 13.15 lakh. Scheduled Tribes (STs) are slightly better off at Rs. 8.84 lakh and Rs. 18.9 lakh respectively. Other Backward Classes (OBC) households in rural areas own twice the assets of SCs and STs, at Rs. 16.45 lakh while their urban counterparts own an average of Rs. 21.2 lakhs in assets. The Upper Castes, classified as ‘Others’ in the report, are the richest. Rural households own an average of Rs. 26.03 lakh while urban households own Rs. 40.54 lakh in assets. </p><p> </p><p><strong>Table 2: Incidence of indebtedness (IOI), Average amount of Debt (AOD) per household & AOD per indebted household</strong></p><p><strong><img alt="" src="/upload/images/Household%20indebtedness.PNG" style="height:482px; width:907px" /></strong></p><p><strong>Source: </strong>NSS Report no. 588: All India Debt & Investment Survey-2019, Ministry of Statistics & Programme Implementation</p><p> </p><p>This table shows us that rural indebtedness is higher than urban indebtedness, with 35 percent of rural households reporting being in debt compared to 22.4 percent of urban households. However, the average amount of debt of rural households is lower than their urban counterparts: Rs. 59,748 (rural) and Rs. 1,20,336 (urban). <br /><br />We have three different data points, if from 2018. In the intervening period the Covid-19 pandemic induced lockdowns precipitated a reverse migration and disrupted economic activity. We don’t have data on debt and investment for the post-pandemic period, but let us try and put these numbers in context.<br /><br />The India supplement of the Oxfam Inequality report, released in January 2023, states that the gap between the rich and the poor in India has been rising. In 2020 the income share of the bottom 50 percent of the population is estimated to have fallen to 13 percent of the national income and less than 3 per cent of the total wealth. This is in stark contrast to the top 30 percent who own more than 90 per cent of the total wealth. Of this, the wealthiest 10 per cent own more than 72 percent of the total wealth while the top 1 percent own nearly 40.6 per cent of the total wealth in India. <br /><br />According to the Oxfam report, “The country still has the world’s highest number of poor at 228.9 million. On the other hand, the total number of billionaires in India increased from 102 in 2020 to 166 billionaires in 2022”. <br />The impact of this wealth concentration has been “exceptionally poor diets, increase in debt and deaths”. Furthermore, “the concentration of wealth continues to be around primordial characteristics such as caste, with some communities such as the Scheduled Tribes (STs) suffering from physical remoteness and systematic exclusion”.</p><p><strong>References</strong><br />All India Debt and Investment Survey - 2019, NSS 77th Round, Ministry of Statistics & Programme Implementation. Please click here to read the <a href="https://mospi.gov.in/sites/default/files/publication_reports/Report_no588-AIDIS-77R-SeptFinal_0.pdf" title="https://mospi.gov.in/sites/default/files/publication_reports/Report_no588-AIDIS-77R-SeptFinal_0.pdf">report</a> <br />Survival of the Richest, the India Story, 2023, Oxfam India. Please click here for the <a href="https://d1ns4ht6ytuzzo.cloudfront.net/oxfamdata/oxfamdatapublic/2023-01/India%20Supplement%202023_digital.pdf?kz3wav0jbhJdvkJ.fK1rj1k1_5ap9FhQ%C2%A0" title="https://d1ns4ht6ytuzzo.cloudfront.net/oxfamdata/oxfamdatapublic/2023-01/India%20Supplement%202023_digital.pdf?kz3wav0jbhJdvkJ.fK1rj1k1_5ap9FhQ%C2%A0">report </a></p> </font>
</td>
</tr>
<tr>
<td> </td>
</tr>
<tr>
<td height="50" style="border-top:1px solid #000; border-bottom:1px solid #000;padding-top:10px;">
<form><input type="button" value=" Print this page "
onclick="window.print();return false;"/></form>
</td>
</tr>
</table></body>
</html>'
}
$maxBufferLength = (int) 8192
$file = '/home/brlfuser/public_html/vendor/cakephp/cakephp/src/Error/Debugger.php'
$line = (int) 853
$message = 'Unable to emit headers. Headers sent in file=/home/brlfuser/public_html/vendor/cakephp/cakephp/src/Error/Debugger.php line=853'
Cake\Http\ResponseEmitter::emit() - CORE/src/Http/ResponseEmitter.php, line 48
Cake\Http\Server::emit() - CORE/src/Http/Server.php, line 141
[main] - ROOT/webroot/index.php, line 39
Warning (2): Cannot modify header information - headers already sent by (output started at /home/brlfuser/public_html/vendor/cakephp/cakephp/src/Error/Debugger.php:853) [CORE/src/Http/ResponseEmitter.php, line 148]
$response = object(Cake\Http\Response) {
'status' => (int) 200,
'contentType' => 'text/html',
'headers' => [
'Content-Type' => [
[maximum depth reached]
]
],
'file' => null,
'fileRange' => [],
'cookies' => object(Cake\Http\Cookie\CookieCollection) {},
'cacheDirectives' => [],
'body' => '<!DOCTYPE html PUBLIC "-//W3C//DTD XHTML 1.0 Transitional//EN"
"http://www.w3.org/TR/xhtml1/DTD/xhtml1-transitional.dtd">
<html xmlns="http://www.w3.org/1999/xhtml">
<head>
<link rel="canonical" href="https://im4change.in/<pre class="cake-error"><a href="javascript:void(0);" onclick="document.getElementById('cakeErr67ec661ed5632-trace').style.display = (document.getElementById('cakeErr67ec661ed5632-trace').style.display == 'none' ? '' : 'none');"><b>Notice</b> (8)</a>: Undefined variable: urlPrefix [<b>APP/Template/Layout/printlayout.ctp</b>, line <b>8</b>]<div id="cakeErr67ec661ed5632-trace" class="cake-stack-trace" style="display: none;"><a href="javascript:void(0);" onclick="document.getElementById('cakeErr67ec661ed5632-code').style.display = (document.getElementById('cakeErr67ec661ed5632-code').style.display == 'none' ? '' : 'none')">Code</a> <a href="javascript:void(0);" onclick="document.getElementById('cakeErr67ec661ed5632-context').style.display = (document.getElementById('cakeErr67ec661ed5632-context').style.display == 'none' ? '' : 'none')">Context</a><pre id="cakeErr67ec661ed5632-code" class="cake-code-dump" style="display: none;"><code><span style="color: #000000"><span style="color: #0000BB"></span><span style="color: #007700"><</span><span style="color: #0000BB">head</span><span style="color: #007700">>
</span></span></code>
<span class="code-highlight"><code><span style="color: #000000"> <link rel="canonical" href="<span style="color: #0000BB"><?php </span><span style="color: #007700">echo </span><span style="color: #0000BB">Configure</span><span style="color: #007700">::</span><span style="color: #0000BB">read</span><span style="color: #007700">(</span><span style="color: #DD0000">'SITE_URL'</span><span style="color: #007700">); </span><span style="color: #0000BB">?><?php </span><span style="color: #007700">echo </span><span style="color: #0000BB">$urlPrefix</span><span style="color: #007700">;</span><span style="color: #0000BB">?><?php </span><span style="color: #007700">echo </span><span style="color: #0000BB">$article_current</span><span style="color: #007700">-></span><span style="color: #0000BB">category</span><span style="color: #007700">-></span><span style="color: #0000BB">slug</span><span style="color: #007700">; </span><span style="color: #0000BB">?></span>/<span style="color: #0000BB"><?php </span><span style="color: #007700">echo </span><span style="color: #0000BB">$article_current</span><span style="color: #007700">-></span><span style="color: #0000BB">seo_url</span><span style="color: #007700">; </span><span style="color: #0000BB">?></span>.html"/>
</span></code></span>
<code><span style="color: #000000"><span style="color: #0000BB"> </span><span style="color: #007700"><</span><span style="color: #0000BB">meta http</span><span style="color: #007700">-</span><span style="color: #0000BB">equiv</span><span style="color: #007700">=</span><span style="color: #DD0000">"Content-Type" </span><span style="color: #0000BB">content</span><span style="color: #007700">=</span><span style="color: #DD0000">"text/html; charset=utf-8"</span><span style="color: #007700">/>
</span></span></code></pre><pre id="cakeErr67ec661ed5632-context" class="cake-context" style="display: none;">$viewFile = '/home/brlfuser/public_html/src/Template/Layout/printlayout.ctp'
$dataForView = [
'article_current' => object(App\Model\Entity\Article) {
'id' => (int) 64906,
'title' => 'Top 10% of Urban Indian Households has 7,517 Times the Assets of the Bottom Decile',
'subheading' => null,
'description' => '<p>The average value of assets (AVA) of the top ten percent of urban households in India is more than seven thousand five hundred times greater than what the bottom ten percent owns. The AVA of the top decile was Rs. 1.5 crores, while the lowest decile owned an average of Rs. 2,000 of assets. The data is part of the <a href="https://mospi.gov.in/sites/default/files/publication_reports/Report_no588-AIDIS-77R-SeptFinal_0.pdf">All India Debt and Investment Survey - 2019</a>,&nbsp;the survey for which was carried out between January-December, 2019 by the National Sample Survey Organization in its 77th round. Information on the assets and liabilities of households as of 30 June, 2018. The survey was spread over 5,940 villages covering 69,455 households in the rural sector and 3,995 blocks covering 47,006 households in the urban sector.</p>
<p><strong>Figure 1: Average value of Assets (000&#39; Rs.) by decile class of asset holding</strong></p>
<p><iframe class="flourish-embed-iframe" frameborder="0" scrolling="no" src="https://flo.uri.sh/visualisation/13083254/embed" style="width:100%;height:600px;" title="Interactive or visual content"></iframe></p>
<div style="margin-top:4px!important; text-align:right!important; width:100%!"><a class="flourish-credit" href="https://public.flourish.studio/visualisation/13083254/?utm_source=embed&amp;utm_campaign=visualisation/13083254" style="text-decoration:none!important" target="_top"><img alt="Made with Flourish" src="https://public.flourish.studio/resources/made_with_flourish.svg" style="border:none!important; height:16px!important; margin:0!important; width:105px!important" /> </a></div>
<p><strong>Source:</strong> <em>NSS Report no. 588: All India Debt &amp; Investment Survey-2019, Ministry of Statistics &amp; Programme Implementation</em></p>
<p>&nbsp;</p>
<p>The chart shows the average value of assets per decile. Up till the fourth decile (30-40 percent) urban&nbsp;Indians are worse off than rural Indians, but from the fifth decile onwards the AVA of city dwellers starts outstripping rural residents. The survey suggests that rural households are better off than urban ones at the lower deciles. &nbsp; &nbsp;</p>
<p>Rural inequality is not as stark as in urban areas. The difference between the top and the bottom declines is 198. Meaning the top 10 percent of rural households owns on average 198 times the assets of the bottom 10 percent. The AVA of the 10th decile of rural households is Rs. 81.17 lakh while households in the 1st decile hold on average Rs. 41,000.&nbsp;<br />
<br />
Household assets are defined in the report as everything owned by the household that has monetary value. This includes physical assets like land, buildings, livestock, agricultural machinery and implements, non-farm business equipment, all transport equipment, and financial assets like receivable on loans advanced in cash or in kind, shares in companies and cooperative societies, banks, etc., national saving certificates and the like, deposits in companies, banks, post offices and with individuals.</p>
<p>What about a breakdown by social group? The report has gathered caste-wise data on ownership of assets.&nbsp;</p>
<p>&nbsp;</p>
<p><strong>Table 1: Average Value of Assets by Social Group</strong><br />
<img alt="" src="/upload/images/AVA%20social%20group.PNG" style="height:288px; width:851px" /></p>
<p><strong>Source:</strong> NSS Report no. 588: All India Debt &amp; Investment Survey-2019, Ministry of Statistics &amp; Programme Implementation</p>
<p>&nbsp;</p>
<p>The table above shows that Scheduled Castes (SCs) are the worst off when it comes to asset ownership. The average assets of a rural SC households are equivalent to Rs. 8.79 lakh, while the figure for urban households is Rs. 13.15 lakh. Scheduled Tribes&nbsp;(STs) are slightly better off at Rs. 8.84 lakh and Rs. 18.9 lakh respectively. Other Backward Classes (OBC) households in rural areas own twice the assets of SCs and STs, at Rs. 16.45 lakh while their urban counterparts own an average of Rs. 21.2 lakhs in assets. The Upper Castes, classified as &lsquo;Others&rsquo; in the report, are the richest. Rural households own an average of Rs. 26.03 lakh while urban households own Rs. 40.54 lakh in assets.&nbsp;</p>
<p>&nbsp;</p>
<p><strong>Table 2: Incidence of indebtedness (IOI), Average amount of Debt (AOD) per household &amp; AOD per indebted household</strong></p>
<p><strong><img alt="" src="/upload/images/Household%20indebtedness.PNG" style="height:482px; width:907px" /></strong></p>
<p><strong>Source: </strong>NSS Report no. 588: All India Debt &amp; Investment Survey-2019, Ministry of Statistics &amp; Programme Implementation</p>
<p>&nbsp;</p>
<p>This table shows us that rural indebtedness is higher than urban indebtedness, with 35 percent of rural households reporting being in debt compared to 22.4 percent of urban households. However, the average amount of debt of rural households is lower than their urban counterparts: Rs. 59,748 (rural) and Rs. 1,20,336 (urban). &nbsp;&nbsp;<br />
<br />
We have three different data points, if from 2018. In the intervening period the Covid-19 pandemic induced lockdowns precipitated a reverse migration and disrupted economic activity. We don&rsquo;t have data on debt and investment for the post-pandemic period, but let us try and put these numbers in context.<br />
<br />
The India supplement of the Oxfam Inequality report, released in January 2023, states that the gap between the rich and the poor in India has been rising. In 2020 the income share of the bottom 50 percent of the population is estimated to have fallen to 13 percent of the national income and less than 3 per cent of the total wealth. This is in stark contrast to the top 30 percent who own more than 90 per cent of the total wealth. Of this, the wealthiest 10 per cent own more than 72 percent of the total wealth while the top 1 percent own nearly 40.6 per cent of the total wealth in India. &nbsp;<br />
<br />
According to the Oxfam report, &ldquo;The country still has the world&rsquo;s highest number of poor at 228.9 million. On the other hand, the total number of billionaires in India increased from 102 in 2020 to 166 billionaires in 2022&rdquo;.&nbsp;<br />
The impact of this wealth concentration has been &ldquo;exceptionally poor diets, increase in debt and deaths&rdquo;. Furthermore, &ldquo;the concentration of wealth continues to be around primordial characteristics such as caste, with some communities such as the Scheduled Tribes (STs) suffering from physical remoteness and systematic exclusion&rdquo;.</p>
<p><strong>References</strong><br />
All India Debt and Investment Survey - 2019, NSS 77th Round, Ministry of Statistics &amp; Programme Implementation. Please click here to read the&nbsp;<a href="https://mospi.gov.in/sites/default/files/publication_reports/Report_no588-AIDIS-77R-SeptFinal_0.pdf">report</a>&nbsp;<br />
Survival of the Richest, the India Story, 2023, Oxfam India. Please click here for the <a href="https://d1ns4ht6ytuzzo.cloudfront.net/oxfamdata/oxfamdatapublic/2023-01/India%20Supplement%202023_digital.pdf?kz3wav0jbhJdvkJ.fK1rj1k1_5ap9FhQ%C2%A0">report&nbsp;</a></p>
',
'credit_writer' => 'Inclusive Media for Change, 23 March, 2023',
'article_img' => 'Mazdoor sangharsh.jpeg',
'article_img_thumb' => 'Mazdoor sangharsh.jpeg',
'status' => (int) 1,
'show_on_home' => (int) 1,
'lang' => 'EN',
'category_id' => (int) 4,
'tag_keyword' => '',
'seo_url' => 'top-10-of-urban-indian-households-has-7-517-times-the-assets-of-the-bottom-decile',
'meta_title' => '',
'meta_keywords' => '',
'meta_description' => '',
'noindex' => (int) 1,
'publish_date' => object(Cake\I18n\FrozenDate) {},
'most_visit_section_id' => null,
'article_big_img' => null,
'liveid' => null,
'created' => object(Cake\I18n\FrozenTime) {},
'modified' => object(Cake\I18n\FrozenTime) {},
'edate' => '',
'tags' => [
[maximum depth reached]
],
'category' => object(App\Model\Entity\Category) {},
'[new]' => false,
'[accessible]' => [
[maximum depth reached]
],
'[dirty]' => [[maximum depth reached]],
'[original]' => [[maximum depth reached]],
'[virtual]' => [[maximum depth reached]],
'[hasErrors]' => false,
'[errors]' => [[maximum depth reached]],
'[invalid]' => [[maximum depth reached]],
'[repository]' => 'Articles'
},
'articleid' => (int) 64906,
'metaTitle' => 'NEWS ALERTS | Top 10% of Urban Indian Households has 7,517 Times the Assets of the Bottom Decile',
'metaKeywords' => 'Average Value of Assets,Debt,Debt and Investment,Indebtedness,India,Inequality,National Sample Survey Organisation,NSSO,Oxfam,Urban Poverty,Wealth disparity',
'metaDesc' => 'The average value of assets (AVA) of the top ten percent of urban households in India is more than seven thousand five hundred times greater than what the bottom ten percent owns. The AVA of the top decile was Rs....',
'disp' => '<p>The average value of assets (AVA) of the top ten percent of urban households in India is more than seven thousand five hundred times greater than what the bottom ten percent owns. The AVA of the top decile was Rs. 1.5 crores, while the lowest decile owned an average of Rs. 2,000 of assets. The data is part of the <a href="https://mospi.gov.in/sites/default/files/publication_reports/Report_no588-AIDIS-77R-SeptFinal_0.pdf" title="https://mospi.gov.in/sites/default/files/publication_reports/Report_no588-AIDIS-77R-SeptFinal_0.pdf">All India Debt and Investment Survey - 2019</a>,&nbsp;the survey for which was carried out between January-December, 2019 by the National Sample Survey Organization in its 77th round. Information on the assets and liabilities of households as of 30 June, 2018. The survey was spread over 5,940 villages covering 69,455 households in the rural sector and 3,995 blocks covering 47,006 households in the urban sector.</p><p><strong>Figure 1: Average value of Assets (000&#39; Rs.) by decile class of asset holding</strong></p><p><iframe class="flourish-embed-iframe" frameborder="0" scrolling="no" src="https://flo.uri.sh/visualisation/13083254/embed" style="width:100%;height:600px;" title="Interactive or visual content"></iframe></p><div style="margin-top:4px!important; text-align:right!important; width:100%!"><a href="https://public.flourish.studio/visualisation/13083254/?utm_source=embed&amp;utm_campaign=visualisation/13083254" style="text-decoration:none!important" target="_top" title="https://public.flourish.studio/visualisation/13083254/?utm_source=embed&amp;utm_campaign=visualisation/13083254" style="text-decoration:none!important" target="_top"> </a></div><p><strong>Source:</strong> <em>NSS Report no. 588: All India Debt &amp; Investment Survey-2019, Ministry of Statistics &amp; Programme Implementation</em></p><p>&nbsp;</p><p>The chart shows the average value of assets per decile. Up till the fourth decile (30-40 percent) urban&nbsp;Indians are worse off than rural Indians, but from the fifth decile onwards the AVA of city dwellers starts outstripping rural residents. The survey suggests that rural households are better off than urban ones at the lower deciles. &nbsp; &nbsp;</p><p>Rural inequality is not as stark as in urban areas. The difference between the top and the bottom declines is 198. Meaning the top 10 percent of rural households owns on average 198 times the assets of the bottom 10 percent. The AVA of the 10th decile of rural households is Rs. 81.17 lakh while households in the 1st decile hold on average Rs. 41,000.&nbsp;<br /><br />Household assets are defined in the report as everything owned by the household that has monetary value. This includes physical assets like land, buildings, livestock, agricultural machinery and implements, non-farm business equipment, all transport equipment, and financial assets like receivable on loans advanced in cash or in kind, shares in companies and cooperative societies, banks, etc., national saving certificates and the like, deposits in companies, banks, post offices and with individuals.</p><p>What about a breakdown by social group? The report has gathered caste-wise data on ownership of assets.&nbsp;</p><p>&nbsp;</p><p><strong>Table 1: Average Value of Assets by Social Group</strong><br /><img alt="" src="/upload/images/AVA%20social%20group.PNG" style="height:288px; width:851px" /></p><p><strong>Source:</strong> NSS Report no. 588: All India Debt &amp; Investment Survey-2019, Ministry of Statistics &amp; Programme Implementation</p><p>&nbsp;</p><p>The table above shows that Scheduled Castes (SCs) are the worst off when it comes to asset ownership. The average assets of a rural SC households are equivalent to Rs. 8.79 lakh, while the figure for urban households is Rs. 13.15 lakh. Scheduled Tribes&nbsp;(STs) are slightly better off at Rs. 8.84 lakh and Rs. 18.9 lakh respectively. Other Backward Classes (OBC) households in rural areas own twice the assets of SCs and STs, at Rs. 16.45 lakh while their urban counterparts own an average of Rs. 21.2 lakhs in assets. The Upper Castes, classified as &lsquo;Others&rsquo; in the report, are the richest. Rural households own an average of Rs. 26.03 lakh while urban households own Rs. 40.54 lakh in assets.&nbsp;</p><p>&nbsp;</p><p><strong>Table 2: Incidence of indebtedness (IOI), Average amount of Debt (AOD) per household &amp; AOD per indebted household</strong></p><p><strong><img alt="" src="/upload/images/Household%20indebtedness.PNG" style="height:482px; width:907px" /></strong></p><p><strong>Source: </strong>NSS Report no. 588: All India Debt &amp; Investment Survey-2019, Ministry of Statistics &amp; Programme Implementation</p><p>&nbsp;</p><p>This table shows us that rural indebtedness is higher than urban indebtedness, with 35 percent of rural households reporting being in debt compared to 22.4 percent of urban households. However, the average amount of debt of rural households is lower than their urban counterparts: Rs. 59,748 (rural) and Rs. 1,20,336 (urban). &nbsp;&nbsp;<br /><br />We have three different data points, if from 2018. In the intervening period the Covid-19 pandemic induced lockdowns precipitated a reverse migration and disrupted economic activity. We don&rsquo;t have data on debt and investment for the post-pandemic period, but let us try and put these numbers in context.<br /><br />The India supplement of the Oxfam Inequality report, released in January 2023, states that the gap between the rich and the poor in India has been rising. In 2020 the income share of the bottom 50 percent of the population is estimated to have fallen to 13 percent of the national income and less than 3 per cent of the total wealth. This is in stark contrast to the top 30 percent who own more than 90 per cent of the total wealth. Of this, the wealthiest 10 per cent own more than 72 percent of the total wealth while the top 1 percent own nearly 40.6 per cent of the total wealth in India. &nbsp;<br /><br />According to the Oxfam report, &ldquo;The country still has the world&rsquo;s highest number of poor at 228.9 million. On the other hand, the total number of billionaires in India increased from 102 in 2020 to 166 billionaires in 2022&rdquo;.&nbsp;<br />The impact of this wealth concentration has been &ldquo;exceptionally poor diets, increase in debt and deaths&rdquo;. Furthermore, &ldquo;the concentration of wealth continues to be around primordial characteristics such as caste, with some communities such as the Scheduled Tribes (STs) suffering from physical remoteness and systematic exclusion&rdquo;.</p><p><strong>References</strong><br />All India Debt and Investment Survey - 2019, NSS 77th Round, Ministry of Statistics &amp; Programme Implementation. Please click here to read the&nbsp;<a href="https://mospi.gov.in/sites/default/files/publication_reports/Report_no588-AIDIS-77R-SeptFinal_0.pdf" title="https://mospi.gov.in/sites/default/files/publication_reports/Report_no588-AIDIS-77R-SeptFinal_0.pdf">report</a>&nbsp;<br />Survival of the Richest, the India Story, 2023, Oxfam India. Please click here for the <a href="https://d1ns4ht6ytuzzo.cloudfront.net/oxfamdata/oxfamdatapublic/2023-01/India%20Supplement%202023_digital.pdf?kz3wav0jbhJdvkJ.fK1rj1k1_5ap9FhQ%C2%A0" title="https://d1ns4ht6ytuzzo.cloudfront.net/oxfamdata/oxfamdatapublic/2023-01/India%20Supplement%202023_digital.pdf?kz3wav0jbhJdvkJ.fK1rj1k1_5ap9FhQ%C2%A0">report&nbsp;</a></p>',
'lang' => 'English',
'SITE_URL' => 'https://im4change.in/',
'site_title' => 'im4change',
'adminprix' => 'admin'
]
$article_current = object(App\Model\Entity\Article) {
'id' => (int) 64906,
'title' => 'Top 10% of Urban Indian Households has 7,517 Times the Assets of the Bottom Decile',
'subheading' => null,
'description' => '<p>The average value of assets (AVA) of the top ten percent of urban households in India is more than seven thousand five hundred times greater than what the bottom ten percent owns. The AVA of the top decile was Rs. 1.5 crores, while the lowest decile owned an average of Rs. 2,000 of assets. The data is part of the <a href="https://mospi.gov.in/sites/default/files/publication_reports/Report_no588-AIDIS-77R-SeptFinal_0.pdf">All India Debt and Investment Survey - 2019</a>,&nbsp;the survey for which was carried out between January-December, 2019 by the National Sample Survey Organization in its 77th round. Information on the assets and liabilities of households as of 30 June, 2018. The survey was spread over 5,940 villages covering 69,455 households in the rural sector and 3,995 blocks covering 47,006 households in the urban sector.</p>
<p><strong>Figure 1: Average value of Assets (000&#39; Rs.) by decile class of asset holding</strong></p>
<p><iframe class="flourish-embed-iframe" frameborder="0" scrolling="no" src="https://flo.uri.sh/visualisation/13083254/embed" style="width:100%;height:600px;" title="Interactive or visual content"></iframe></p>
<div style="margin-top:4px!important; text-align:right!important; width:100%!"><a class="flourish-credit" href="https://public.flourish.studio/visualisation/13083254/?utm_source=embed&amp;utm_campaign=visualisation/13083254" style="text-decoration:none!important" target="_top"><img alt="Made with Flourish" src="https://public.flourish.studio/resources/made_with_flourish.svg" style="border:none!important; height:16px!important; margin:0!important; width:105px!important" /> </a></div>
<p><strong>Source:</strong> <em>NSS Report no. 588: All India Debt &amp; Investment Survey-2019, Ministry of Statistics &amp; Programme Implementation</em></p>
<p>&nbsp;</p>
<p>The chart shows the average value of assets per decile. Up till the fourth decile (30-40 percent) urban&nbsp;Indians are worse off than rural Indians, but from the fifth decile onwards the AVA of city dwellers starts outstripping rural residents. The survey suggests that rural households are better off than urban ones at the lower deciles. &nbsp; &nbsp;</p>
<p>Rural inequality is not as stark as in urban areas. The difference between the top and the bottom declines is 198. Meaning the top 10 percent of rural households owns on average 198 times the assets of the bottom 10 percent. The AVA of the 10th decile of rural households is Rs. 81.17 lakh while households in the 1st decile hold on average Rs. 41,000.&nbsp;<br />
<br />
Household assets are defined in the report as everything owned by the household that has monetary value. This includes physical assets like land, buildings, livestock, agricultural machinery and implements, non-farm business equipment, all transport equipment, and financial assets like receivable on loans advanced in cash or in kind, shares in companies and cooperative societies, banks, etc., national saving certificates and the like, deposits in companies, banks, post offices and with individuals.</p>
<p>What about a breakdown by social group? The report has gathered caste-wise data on ownership of assets.&nbsp;</p>
<p>&nbsp;</p>
<p><strong>Table 1: Average Value of Assets by Social Group</strong><br />
<img alt="" src="/upload/images/AVA%20social%20group.PNG" style="height:288px; width:851px" /></p>
<p><strong>Source:</strong> NSS Report no. 588: All India Debt &amp; Investment Survey-2019, Ministry of Statistics &amp; Programme Implementation</p>
<p>&nbsp;</p>
<p>The table above shows that Scheduled Castes (SCs) are the worst off when it comes to asset ownership. The average assets of a rural SC households are equivalent to Rs. 8.79 lakh, while the figure for urban households is Rs. 13.15 lakh. Scheduled Tribes&nbsp;(STs) are slightly better off at Rs. 8.84 lakh and Rs. 18.9 lakh respectively. Other Backward Classes (OBC) households in rural areas own twice the assets of SCs and STs, at Rs. 16.45 lakh while their urban counterparts own an average of Rs. 21.2 lakhs in assets. The Upper Castes, classified as &lsquo;Others&rsquo; in the report, are the richest. Rural households own an average of Rs. 26.03 lakh while urban households own Rs. 40.54 lakh in assets.&nbsp;</p>
<p>&nbsp;</p>
<p><strong>Table 2: Incidence of indebtedness (IOI), Average amount of Debt (AOD) per household &amp; AOD per indebted household</strong></p>
<p><strong><img alt="" src="/upload/images/Household%20indebtedness.PNG" style="height:482px; width:907px" /></strong></p>
<p><strong>Source: </strong>NSS Report no. 588: All India Debt &amp; Investment Survey-2019, Ministry of Statistics &amp; Programme Implementation</p>
<p>&nbsp;</p>
<p>This table shows us that rural indebtedness is higher than urban indebtedness, with 35 percent of rural households reporting being in debt compared to 22.4 percent of urban households. However, the average amount of debt of rural households is lower than their urban counterparts: Rs. 59,748 (rural) and Rs. 1,20,336 (urban). &nbsp;&nbsp;<br />
<br />
We have three different data points, if from 2018. In the intervening period the Covid-19 pandemic induced lockdowns precipitated a reverse migration and disrupted economic activity. We don&rsquo;t have data on debt and investment for the post-pandemic period, but let us try and put these numbers in context.<br />
<br />
The India supplement of the Oxfam Inequality report, released in January 2023, states that the gap between the rich and the poor in India has been rising. In 2020 the income share of the bottom 50 percent of the population is estimated to have fallen to 13 percent of the national income and less than 3 per cent of the total wealth. This is in stark contrast to the top 30 percent who own more than 90 per cent of the total wealth. Of this, the wealthiest 10 per cent own more than 72 percent of the total wealth while the top 1 percent own nearly 40.6 per cent of the total wealth in India. &nbsp;<br />
<br />
According to the Oxfam report, &ldquo;The country still has the world&rsquo;s highest number of poor at 228.9 million. On the other hand, the total number of billionaires in India increased from 102 in 2020 to 166 billionaires in 2022&rdquo;.&nbsp;<br />
The impact of this wealth concentration has been &ldquo;exceptionally poor diets, increase in debt and deaths&rdquo;. Furthermore, &ldquo;the concentration of wealth continues to be around primordial characteristics such as caste, with some communities such as the Scheduled Tribes (STs) suffering from physical remoteness and systematic exclusion&rdquo;.</p>
<p><strong>References</strong><br />
All India Debt and Investment Survey - 2019, NSS 77th Round, Ministry of Statistics &amp; Programme Implementation. Please click here to read the&nbsp;<a href="https://mospi.gov.in/sites/default/files/publication_reports/Report_no588-AIDIS-77R-SeptFinal_0.pdf">report</a>&nbsp;<br />
Survival of the Richest, the India Story, 2023, Oxfam India. Please click here for the <a href="https://d1ns4ht6ytuzzo.cloudfront.net/oxfamdata/oxfamdatapublic/2023-01/India%20Supplement%202023_digital.pdf?kz3wav0jbhJdvkJ.fK1rj1k1_5ap9FhQ%C2%A0">report&nbsp;</a></p>
',
'credit_writer' => 'Inclusive Media for Change, 23 March, 2023',
'article_img' => 'Mazdoor sangharsh.jpeg',
'article_img_thumb' => 'Mazdoor sangharsh.jpeg',
'status' => (int) 1,
'show_on_home' => (int) 1,
'lang' => 'EN',
'category_id' => (int) 4,
'tag_keyword' => '',
'seo_url' => 'top-10-of-urban-indian-households-has-7-517-times-the-assets-of-the-bottom-decile',
'meta_title' => '',
'meta_keywords' => '',
'meta_description' => '',
'noindex' => (int) 1,
'publish_date' => object(Cake\I18n\FrozenDate) {},
'most_visit_section_id' => null,
'article_big_img' => null,
'liveid' => null,
'created' => object(Cake\I18n\FrozenTime) {},
'modified' => object(Cake\I18n\FrozenTime) {},
'edate' => '',
'tags' => [
(int) 0 => object(Cake\ORM\Entity) {},
(int) 1 => object(Cake\ORM\Entity) {},
(int) 2 => object(Cake\ORM\Entity) {},
(int) 3 => object(Cake\ORM\Entity) {},
(int) 4 => object(Cake\ORM\Entity) {},
(int) 5 => object(Cake\ORM\Entity) {},
(int) 6 => object(Cake\ORM\Entity) {},
(int) 7 => object(Cake\ORM\Entity) {},
(int) 8 => object(Cake\ORM\Entity) {},
(int) 9 => object(Cake\ORM\Entity) {},
(int) 10 => object(Cake\ORM\Entity) {}
],
'category' => object(App\Model\Entity\Category) {},
'[new]' => false,
'[accessible]' => [
'*' => true,
'id' => false
],
'[dirty]' => [],
'[original]' => [],
'[virtual]' => [],
'[hasErrors]' => false,
'[errors]' => [],
'[invalid]' => [],
'[repository]' => 'Articles'
}
$articleid = (int) 64906
$metaTitle = 'NEWS ALERTS | Top 10% of Urban Indian Households has 7,517 Times the Assets of the Bottom Decile'
$metaKeywords = 'Average Value of Assets,Debt,Debt and Investment,Indebtedness,India,Inequality,National Sample Survey Organisation,NSSO,Oxfam,Urban Poverty,Wealth disparity'
$metaDesc = 'The average value of assets (AVA) of the top ten percent of urban households in India is more than seven thousand five hundred times greater than what the bottom ten percent owns. The AVA of the top decile was Rs....'
$disp = '<p>The average value of assets (AVA) of the top ten percent of urban households in India is more than seven thousand five hundred times greater than what the bottom ten percent owns. The AVA of the top decile was Rs. 1.5 crores, while the lowest decile owned an average of Rs. 2,000 of assets. The data is part of the <a href="https://mospi.gov.in/sites/default/files/publication_reports/Report_no588-AIDIS-77R-SeptFinal_0.pdf" title="https://mospi.gov.in/sites/default/files/publication_reports/Report_no588-AIDIS-77R-SeptFinal_0.pdf">All India Debt and Investment Survey - 2019</a>,&nbsp;the survey for which was carried out between January-December, 2019 by the National Sample Survey Organization in its 77th round. Information on the assets and liabilities of households as of 30 June, 2018. The survey was spread over 5,940 villages covering 69,455 households in the rural sector and 3,995 blocks covering 47,006 households in the urban sector.</p><p><strong>Figure 1: Average value of Assets (000&#39; Rs.) by decile class of asset holding</strong></p><p><iframe class="flourish-embed-iframe" frameborder="0" scrolling="no" src="https://flo.uri.sh/visualisation/13083254/embed" style="width:100%;height:600px;" title="Interactive or visual content"></iframe></p><div style="margin-top:4px!important; text-align:right!important; width:100%!"><a href="https://public.flourish.studio/visualisation/13083254/?utm_source=embed&amp;utm_campaign=visualisation/13083254" style="text-decoration:none!important" target="_top" title="https://public.flourish.studio/visualisation/13083254/?utm_source=embed&amp;utm_campaign=visualisation/13083254" style="text-decoration:none!important" target="_top"> </a></div><p><strong>Source:</strong> <em>NSS Report no. 588: All India Debt &amp; Investment Survey-2019, Ministry of Statistics &amp; Programme Implementation</em></p><p>&nbsp;</p><p>The chart shows the average value of assets per decile. Up till the fourth decile (30-40 percent) urban&nbsp;Indians are worse off than rural Indians, but from the fifth decile onwards the AVA of city dwellers starts outstripping rural residents. The survey suggests that rural households are better off than urban ones at the lower deciles. &nbsp; &nbsp;</p><p>Rural inequality is not as stark as in urban areas. The difference between the top and the bottom declines is 198. Meaning the top 10 percent of rural households owns on average 198 times the assets of the bottom 10 percent. The AVA of the 10th decile of rural households is Rs. 81.17 lakh while households in the 1st decile hold on average Rs. 41,000.&nbsp;<br /><br />Household assets are defined in the report as everything owned by the household that has monetary value. This includes physical assets like land, buildings, livestock, agricultural machinery and implements, non-farm business equipment, all transport equipment, and financial assets like receivable on loans advanced in cash or in kind, shares in companies and cooperative societies, banks, etc., national saving certificates and the like, deposits in companies, banks, post offices and with individuals.</p><p>What about a breakdown by social group? The report has gathered caste-wise data on ownership of assets.&nbsp;</p><p>&nbsp;</p><p><strong>Table 1: Average Value of Assets by Social Group</strong><br /><img alt="" src="/upload/images/AVA%20social%20group.PNG" style="height:288px; width:851px" /></p><p><strong>Source:</strong> NSS Report no. 588: All India Debt &amp; Investment Survey-2019, Ministry of Statistics &amp; Programme Implementation</p><p>&nbsp;</p><p>The table above shows that Scheduled Castes (SCs) are the worst off when it comes to asset ownership. The average assets of a rural SC households are equivalent to Rs. 8.79 lakh, while the figure for urban households is Rs. 13.15 lakh. Scheduled Tribes&nbsp;(STs) are slightly better off at Rs. 8.84 lakh and Rs. 18.9 lakh respectively. Other Backward Classes (OBC) households in rural areas own twice the assets of SCs and STs, at Rs. 16.45 lakh while their urban counterparts own an average of Rs. 21.2 lakhs in assets. The Upper Castes, classified as &lsquo;Others&rsquo; in the report, are the richest. Rural households own an average of Rs. 26.03 lakh while urban households own Rs. 40.54 lakh in assets.&nbsp;</p><p>&nbsp;</p><p><strong>Table 2: Incidence of indebtedness (IOI), Average amount of Debt (AOD) per household &amp; AOD per indebted household</strong></p><p><strong><img alt="" src="/upload/images/Household%20indebtedness.PNG" style="height:482px; width:907px" /></strong></p><p><strong>Source: </strong>NSS Report no. 588: All India Debt &amp; Investment Survey-2019, Ministry of Statistics &amp; Programme Implementation</p><p>&nbsp;</p><p>This table shows us that rural indebtedness is higher than urban indebtedness, with 35 percent of rural households reporting being in debt compared to 22.4 percent of urban households. However, the average amount of debt of rural households is lower than their urban counterparts: Rs. 59,748 (rural) and Rs. 1,20,336 (urban). &nbsp;&nbsp;<br /><br />We have three different data points, if from 2018. In the intervening period the Covid-19 pandemic induced lockdowns precipitated a reverse migration and disrupted economic activity. We don&rsquo;t have data on debt and investment for the post-pandemic period, but let us try and put these numbers in context.<br /><br />The India supplement of the Oxfam Inequality report, released in January 2023, states that the gap between the rich and the poor in India has been rising. In 2020 the income share of the bottom 50 percent of the population is estimated to have fallen to 13 percent of the national income and less than 3 per cent of the total wealth. This is in stark contrast to the top 30 percent who own more than 90 per cent of the total wealth. Of this, the wealthiest 10 per cent own more than 72 percent of the total wealth while the top 1 percent own nearly 40.6 per cent of the total wealth in India. &nbsp;<br /><br />According to the Oxfam report, &ldquo;The country still has the world&rsquo;s highest number of poor at 228.9 million. On the other hand, the total number of billionaires in India increased from 102 in 2020 to 166 billionaires in 2022&rdquo;.&nbsp;<br />The impact of this wealth concentration has been &ldquo;exceptionally poor diets, increase in debt and deaths&rdquo;. Furthermore, &ldquo;the concentration of wealth continues to be around primordial characteristics such as caste, with some communities such as the Scheduled Tribes (STs) suffering from physical remoteness and systematic exclusion&rdquo;.</p><p><strong>References</strong><br />All India Debt and Investment Survey - 2019, NSS 77th Round, Ministry of Statistics &amp; Programme Implementation. Please click here to read the&nbsp;<a href="https://mospi.gov.in/sites/default/files/publication_reports/Report_no588-AIDIS-77R-SeptFinal_0.pdf" title="https://mospi.gov.in/sites/default/files/publication_reports/Report_no588-AIDIS-77R-SeptFinal_0.pdf">report</a>&nbsp;<br />Survival of the Richest, the India Story, 2023, Oxfam India. Please click here for the <a href="https://d1ns4ht6ytuzzo.cloudfront.net/oxfamdata/oxfamdatapublic/2023-01/India%20Supplement%202023_digital.pdf?kz3wav0jbhJdvkJ.fK1rj1k1_5ap9FhQ%C2%A0" title="https://d1ns4ht6ytuzzo.cloudfront.net/oxfamdata/oxfamdatapublic/2023-01/India%20Supplement%202023_digital.pdf?kz3wav0jbhJdvkJ.fK1rj1k1_5ap9FhQ%C2%A0">report&nbsp;</a></p>'
$lang = 'English'
$SITE_URL = 'https://im4change.in/'
$site_title = 'im4change'
$adminprix = 'admin'</pre><pre class="stack-trace">include - APP/Template/Layout/printlayout.ctp, line 8
Cake\View\View::_evaluate() - CORE/src/View/View.php, line 1413
Cake\View\View::_render() - CORE/src/View/View.php, line 1374
Cake\View\View::renderLayout() - CORE/src/View/View.php, line 927
Cake\View\View::render() - CORE/src/View/View.php, line 885
Cake\Controller\Controller::render() - CORE/src/Controller/Controller.php, line 791
Cake\Http\ActionDispatcher::_invoke() - CORE/src/Http/ActionDispatcher.php, line 126
Cake\Http\ActionDispatcher::dispatch() - CORE/src/Http/ActionDispatcher.php, line 94
Cake\Http\BaseApplication::__invoke() - CORE/src/Http/BaseApplication.php, line 235
Cake\Http\Runner::__invoke() - CORE/src/Http/Runner.php, line 65
Cake\Routing\Middleware\RoutingMiddleware::__invoke() - CORE/src/Routing/Middleware/RoutingMiddleware.php, line 162
Cake\Http\Runner::__invoke() - CORE/src/Http/Runner.php, line 65
Cake\Routing\Middleware\AssetMiddleware::__invoke() - CORE/src/Routing/Middleware/AssetMiddleware.php, line 88
Cake\Http\Runner::__invoke() - CORE/src/Http/Runner.php, line 65
Cake\Error\Middleware\ErrorHandlerMiddleware::__invoke() - CORE/src/Error/Middleware/ErrorHandlerMiddleware.php, line 96
Cake\Http\Runner::__invoke() - CORE/src/Http/Runner.php, line 65
Cake\Http\Runner::run() - CORE/src/Http/Runner.php, line 51</pre></div></pre>news-alerts-57/top-10-of-urban-indian-households-has-7-517-times-the-assets-of-the-bottom-decile.html"/>
<meta http-equiv="Content-Type" content="text/html; charset=utf-8"/>
<link href="https://im4change.in/css/control.css" rel="stylesheet" type="text/css"
media="all"/>
<title>NEWS ALERTS | Top 10% of Urban Indian Households has 7,517 Times the Assets of the Bottom Decile | Im4change.org</title>
<meta name="description" content="The average value of assets (AVA) of the top ten percent of urban households in India is more than seven thousand five hundred times greater than what the bottom ten percent owns. The AVA of the top decile was Rs...."/>
<script src="https://im4change.in/js/jquery-1.10.2.js"></script>
<script type="text/javascript" src="https://im4change.in/js/jquery-migrate.min.js"></script>
<script language="javascript" type="text/javascript">
$(document).ready(function () {
var img = $("img")[0]; // Get my img elem
var pic_real_width, pic_real_height;
$("<img/>") // Make in memory copy of image to avoid css issues
.attr("src", $(img).attr("src"))
.load(function () {
pic_real_width = this.width; // Note: $(this).width() will not
pic_real_height = this.height; // work for in memory images.
});
});
</script>
<style type="text/css">
@media screen {
div.divFooter {
display: block;
}
}
@media print {
.printbutton {
display: none !important;
}
}
</style>
</head>
<body>
<table cellpadding="0" cellspacing="0" border="0" width="98%" align="center">
<tr>
<td class="top_bg">
<div class="divFooter">
<img src="https://im4change.in/images/logo1.jpg" height="59" border="0"
alt="Resource centre on India's rural distress" style="padding-top:14px;"/>
</div>
</td>
</tr>
<tr>
<td id="topspace"> </td>
</tr>
<tr id="topspace">
<td> </td>
</tr>
<tr>
<td height="50" style="border-bottom:1px solid #000; padding-top:10px;" class="printbutton">
<form><input type="button" value=" Print this page "
onclick="window.print();return false;"/></form>
</td>
</tr>
<tr>
<td width="100%">
<h1 class="news_headlines" style="font-style:normal">
<strong>Top 10% of Urban Indian Households has 7,517 Times the Assets of the Bottom Decile</strong></h1>
</td>
</tr>
<tr>
<td width="100%" style="font-family:Arial, 'Segoe Script', 'Segoe UI', sans-serif, serif"><font size="3">
<p>The average value of assets (AVA) of the top ten percent of urban households in India is more than seven thousand five hundred times greater than what the bottom ten percent owns. The AVA of the top decile was Rs. 1.5 crores, while the lowest decile owned an average of Rs. 2,000 of assets. The data is part of the <a href="https://mospi.gov.in/sites/default/files/publication_reports/Report_no588-AIDIS-77R-SeptFinal_0.pdf" title="https://mospi.gov.in/sites/default/files/publication_reports/Report_no588-AIDIS-77R-SeptFinal_0.pdf">All India Debt and Investment Survey - 2019</a>, the survey for which was carried out between January-December, 2019 by the National Sample Survey Organization in its 77th round. Information on the assets and liabilities of households as of 30 June, 2018. The survey was spread over 5,940 villages covering 69,455 households in the rural sector and 3,995 blocks covering 47,006 households in the urban sector.</p><p><strong>Figure 1: Average value of Assets (000' Rs.) by decile class of asset holding</strong></p><p><iframe class="flourish-embed-iframe" frameborder="0" scrolling="no" src="https://flo.uri.sh/visualisation/13083254/embed" style="width:100%;height:600px;" title="Interactive or visual content"></iframe></p><div style="margin-top:4px!important; text-align:right!important; width:100%!"><a href="https://public.flourish.studio/visualisation/13083254/?utm_source=embed&utm_campaign=visualisation/13083254" style="text-decoration:none!important" target="_top" title="https://public.flourish.studio/visualisation/13083254/?utm_source=embed&utm_campaign=visualisation/13083254" style="text-decoration:none!important" target="_top"> </a></div><p><strong>Source:</strong> <em>NSS Report no. 588: All India Debt & Investment Survey-2019, Ministry of Statistics & Programme Implementation</em></p><p> </p><p>The chart shows the average value of assets per decile. Up till the fourth decile (30-40 percent) urban Indians are worse off than rural Indians, but from the fifth decile onwards the AVA of city dwellers starts outstripping rural residents. The survey suggests that rural households are better off than urban ones at the lower deciles. </p><p>Rural inequality is not as stark as in urban areas. The difference between the top and the bottom declines is 198. Meaning the top 10 percent of rural households owns on average 198 times the assets of the bottom 10 percent. The AVA of the 10th decile of rural households is Rs. 81.17 lakh while households in the 1st decile hold on average Rs. 41,000. <br /><br />Household assets are defined in the report as everything owned by the household that has monetary value. This includes physical assets like land, buildings, livestock, agricultural machinery and implements, non-farm business equipment, all transport equipment, and financial assets like receivable on loans advanced in cash or in kind, shares in companies and cooperative societies, banks, etc., national saving certificates and the like, deposits in companies, banks, post offices and with individuals.</p><p>What about a breakdown by social group? The report has gathered caste-wise data on ownership of assets. </p><p> </p><p><strong>Table 1: Average Value of Assets by Social Group</strong><br /><img alt="" src="/upload/images/AVA%20social%20group.PNG" style="height:288px; width:851px" /></p><p><strong>Source:</strong> NSS Report no. 588: All India Debt & Investment Survey-2019, Ministry of Statistics & Programme Implementation</p><p> </p><p>The table above shows that Scheduled Castes (SCs) are the worst off when it comes to asset ownership. The average assets of a rural SC households are equivalent to Rs. 8.79 lakh, while the figure for urban households is Rs. 13.15 lakh. Scheduled Tribes (STs) are slightly better off at Rs. 8.84 lakh and Rs. 18.9 lakh respectively. Other Backward Classes (OBC) households in rural areas own twice the assets of SCs and STs, at Rs. 16.45 lakh while their urban counterparts own an average of Rs. 21.2 lakhs in assets. The Upper Castes, classified as ‘Others’ in the report, are the richest. Rural households own an average of Rs. 26.03 lakh while urban households own Rs. 40.54 lakh in assets. </p><p> </p><p><strong>Table 2: Incidence of indebtedness (IOI), Average amount of Debt (AOD) per household & AOD per indebted household</strong></p><p><strong><img alt="" src="/upload/images/Household%20indebtedness.PNG" style="height:482px; width:907px" /></strong></p><p><strong>Source: </strong>NSS Report no. 588: All India Debt & Investment Survey-2019, Ministry of Statistics & Programme Implementation</p><p> </p><p>This table shows us that rural indebtedness is higher than urban indebtedness, with 35 percent of rural households reporting being in debt compared to 22.4 percent of urban households. However, the average amount of debt of rural households is lower than their urban counterparts: Rs. 59,748 (rural) and Rs. 1,20,336 (urban). <br /><br />We have three different data points, if from 2018. In the intervening period the Covid-19 pandemic induced lockdowns precipitated a reverse migration and disrupted economic activity. We don’t have data on debt and investment for the post-pandemic period, but let us try and put these numbers in context.<br /><br />The India supplement of the Oxfam Inequality report, released in January 2023, states that the gap between the rich and the poor in India has been rising. In 2020 the income share of the bottom 50 percent of the population is estimated to have fallen to 13 percent of the national income and less than 3 per cent of the total wealth. This is in stark contrast to the top 30 percent who own more than 90 per cent of the total wealth. Of this, the wealthiest 10 per cent own more than 72 percent of the total wealth while the top 1 percent own nearly 40.6 per cent of the total wealth in India. <br /><br />According to the Oxfam report, “The country still has the world’s highest number of poor at 228.9 million. On the other hand, the total number of billionaires in India increased from 102 in 2020 to 166 billionaires in 2022”. <br />The impact of this wealth concentration has been “exceptionally poor diets, increase in debt and deaths”. Furthermore, “the concentration of wealth continues to be around primordial characteristics such as caste, with some communities such as the Scheduled Tribes (STs) suffering from physical remoteness and systematic exclusion”.</p><p><strong>References</strong><br />All India Debt and Investment Survey - 2019, NSS 77th Round, Ministry of Statistics & Programme Implementation. Please click here to read the <a href="https://mospi.gov.in/sites/default/files/publication_reports/Report_no588-AIDIS-77R-SeptFinal_0.pdf" title="https://mospi.gov.in/sites/default/files/publication_reports/Report_no588-AIDIS-77R-SeptFinal_0.pdf">report</a> <br />Survival of the Richest, the India Story, 2023, Oxfam India. Please click here for the <a href="https://d1ns4ht6ytuzzo.cloudfront.net/oxfamdata/oxfamdatapublic/2023-01/India%20Supplement%202023_digital.pdf?kz3wav0jbhJdvkJ.fK1rj1k1_5ap9FhQ%C2%A0" title="https://d1ns4ht6ytuzzo.cloudfront.net/oxfamdata/oxfamdatapublic/2023-01/India%20Supplement%202023_digital.pdf?kz3wav0jbhJdvkJ.fK1rj1k1_5ap9FhQ%C2%A0">report </a></p> </font>
</td>
</tr>
<tr>
<td> </td>
</tr>
<tr>
<td height="50" style="border-top:1px solid #000; border-bottom:1px solid #000;padding-top:10px;">
<form><input type="button" value=" Print this page "
onclick="window.print();return false;"/></form>
</td>
</tr>
</table></body>
</html>'
}
$reasonPhrase = 'OK'
header - [internal], line ??
Cake\Http\ResponseEmitter::emitStatusLine() - CORE/src/Http/ResponseEmitter.php, line 148
Cake\Http\ResponseEmitter::emit() - CORE/src/Http/ResponseEmitter.php, line 54
Cake\Http\Server::emit() - CORE/src/Http/Server.php, line 141
[main] - ROOT/webroot/index.php, line 39
Warning (2): Cannot modify header information - headers already sent by (output started at /home/brlfuser/public_html/vendor/cakephp/cakephp/src/Error/Debugger.php:853) [CORE/src/Http/ResponseEmitter.php, line 181]
$response = object(Cake\Http\Response) {
'status' => (int) 200,
'contentType' => 'text/html',
'headers' => [
'Content-Type' => [
[maximum depth reached]
]
],
'file' => null,
'fileRange' => [],
'cookies' => object(Cake\Http\Cookie\CookieCollection) {},
'cacheDirectives' => [],
'body' => '<!DOCTYPE html PUBLIC "-//W3C//DTD XHTML 1.0 Transitional//EN"
"http://www.w3.org/TR/xhtml1/DTD/xhtml1-transitional.dtd">
<html xmlns="http://www.w3.org/1999/xhtml">
<head>
<link rel="canonical" href="https://im4change.in/<pre class="cake-error"><a href="javascript:void(0);" onclick="document.getElementById('cakeErr67ec661ed5632-trace').style.display = (document.getElementById('cakeErr67ec661ed5632-trace').style.display == 'none' ? '' : 'none');"><b>Notice</b> (8)</a>: Undefined variable: urlPrefix [<b>APP/Template/Layout/printlayout.ctp</b>, line <b>8</b>]<div id="cakeErr67ec661ed5632-trace" class="cake-stack-trace" style="display: none;"><a href="javascript:void(0);" onclick="document.getElementById('cakeErr67ec661ed5632-code').style.display = (document.getElementById('cakeErr67ec661ed5632-code').style.display == 'none' ? '' : 'none')">Code</a> <a href="javascript:void(0);" onclick="document.getElementById('cakeErr67ec661ed5632-context').style.display = (document.getElementById('cakeErr67ec661ed5632-context').style.display == 'none' ? '' : 'none')">Context</a><pre id="cakeErr67ec661ed5632-code" class="cake-code-dump" style="display: none;"><code><span style="color: #000000"><span style="color: #0000BB"></span><span style="color: #007700"><</span><span style="color: #0000BB">head</span><span style="color: #007700">>
</span></span></code>
<span class="code-highlight"><code><span style="color: #000000"> <link rel="canonical" href="<span style="color: #0000BB"><?php </span><span style="color: #007700">echo </span><span style="color: #0000BB">Configure</span><span style="color: #007700">::</span><span style="color: #0000BB">read</span><span style="color: #007700">(</span><span style="color: #DD0000">'SITE_URL'</span><span style="color: #007700">); </span><span style="color: #0000BB">?><?php </span><span style="color: #007700">echo </span><span style="color: #0000BB">$urlPrefix</span><span style="color: #007700">;</span><span style="color: #0000BB">?><?php </span><span style="color: #007700">echo </span><span style="color: #0000BB">$article_current</span><span style="color: #007700">-></span><span style="color: #0000BB">category</span><span style="color: #007700">-></span><span style="color: #0000BB">slug</span><span style="color: #007700">; </span><span style="color: #0000BB">?></span>/<span style="color: #0000BB"><?php </span><span style="color: #007700">echo </span><span style="color: #0000BB">$article_current</span><span style="color: #007700">-></span><span style="color: #0000BB">seo_url</span><span style="color: #007700">; </span><span style="color: #0000BB">?></span>.html"/>
</span></code></span>
<code><span style="color: #000000"><span style="color: #0000BB"> </span><span style="color: #007700"><</span><span style="color: #0000BB">meta http</span><span style="color: #007700">-</span><span style="color: #0000BB">equiv</span><span style="color: #007700">=</span><span style="color: #DD0000">"Content-Type" </span><span style="color: #0000BB">content</span><span style="color: #007700">=</span><span style="color: #DD0000">"text/html; charset=utf-8"</span><span style="color: #007700">/>
</span></span></code></pre><pre id="cakeErr67ec661ed5632-context" class="cake-context" style="display: none;">$viewFile = '/home/brlfuser/public_html/src/Template/Layout/printlayout.ctp'
$dataForView = [
'article_current' => object(App\Model\Entity\Article) {
'id' => (int) 64906,
'title' => 'Top 10% of Urban Indian Households has 7,517 Times the Assets of the Bottom Decile',
'subheading' => null,
'description' => '<p>The average value of assets (AVA) of the top ten percent of urban households in India is more than seven thousand five hundred times greater than what the bottom ten percent owns. The AVA of the top decile was Rs. 1.5 crores, while the lowest decile owned an average of Rs. 2,000 of assets. The data is part of the <a href="https://mospi.gov.in/sites/default/files/publication_reports/Report_no588-AIDIS-77R-SeptFinal_0.pdf">All India Debt and Investment Survey - 2019</a>,&nbsp;the survey for which was carried out between January-December, 2019 by the National Sample Survey Organization in its 77th round. Information on the assets and liabilities of households as of 30 June, 2018. The survey was spread over 5,940 villages covering 69,455 households in the rural sector and 3,995 blocks covering 47,006 households in the urban sector.</p>
<p><strong>Figure 1: Average value of Assets (000&#39; Rs.) by decile class of asset holding</strong></p>
<p><iframe class="flourish-embed-iframe" frameborder="0" scrolling="no" src="https://flo.uri.sh/visualisation/13083254/embed" style="width:100%;height:600px;" title="Interactive or visual content"></iframe></p>
<div style="margin-top:4px!important; text-align:right!important; width:100%!"><a class="flourish-credit" href="https://public.flourish.studio/visualisation/13083254/?utm_source=embed&amp;utm_campaign=visualisation/13083254" style="text-decoration:none!important" target="_top"><img alt="Made with Flourish" src="https://public.flourish.studio/resources/made_with_flourish.svg" style="border:none!important; height:16px!important; margin:0!important; width:105px!important" /> </a></div>
<p><strong>Source:</strong> <em>NSS Report no. 588: All India Debt &amp; Investment Survey-2019, Ministry of Statistics &amp; Programme Implementation</em></p>
<p>&nbsp;</p>
<p>The chart shows the average value of assets per decile. Up till the fourth decile (30-40 percent) urban&nbsp;Indians are worse off than rural Indians, but from the fifth decile onwards the AVA of city dwellers starts outstripping rural residents. The survey suggests that rural households are better off than urban ones at the lower deciles. &nbsp; &nbsp;</p>
<p>Rural inequality is not as stark as in urban areas. The difference between the top and the bottom declines is 198. Meaning the top 10 percent of rural households owns on average 198 times the assets of the bottom 10 percent. The AVA of the 10th decile of rural households is Rs. 81.17 lakh while households in the 1st decile hold on average Rs. 41,000.&nbsp;<br />
<br />
Household assets are defined in the report as everything owned by the household that has monetary value. This includes physical assets like land, buildings, livestock, agricultural machinery and implements, non-farm business equipment, all transport equipment, and financial assets like receivable on loans advanced in cash or in kind, shares in companies and cooperative societies, banks, etc., national saving certificates and the like, deposits in companies, banks, post offices and with individuals.</p>
<p>What about a breakdown by social group? The report has gathered caste-wise data on ownership of assets.&nbsp;</p>
<p>&nbsp;</p>
<p><strong>Table 1: Average Value of Assets by Social Group</strong><br />
<img alt="" src="/upload/images/AVA%20social%20group.PNG" style="height:288px; width:851px" /></p>
<p><strong>Source:</strong> NSS Report no. 588: All India Debt &amp; Investment Survey-2019, Ministry of Statistics &amp; Programme Implementation</p>
<p>&nbsp;</p>
<p>The table above shows that Scheduled Castes (SCs) are the worst off when it comes to asset ownership. The average assets of a rural SC households are equivalent to Rs. 8.79 lakh, while the figure for urban households is Rs. 13.15 lakh. Scheduled Tribes&nbsp;(STs) are slightly better off at Rs. 8.84 lakh and Rs. 18.9 lakh respectively. Other Backward Classes (OBC) households in rural areas own twice the assets of SCs and STs, at Rs. 16.45 lakh while their urban counterparts own an average of Rs. 21.2 lakhs in assets. The Upper Castes, classified as &lsquo;Others&rsquo; in the report, are the richest. Rural households own an average of Rs. 26.03 lakh while urban households own Rs. 40.54 lakh in assets.&nbsp;</p>
<p>&nbsp;</p>
<p><strong>Table 2: Incidence of indebtedness (IOI), Average amount of Debt (AOD) per household &amp; AOD per indebted household</strong></p>
<p><strong><img alt="" src="/upload/images/Household%20indebtedness.PNG" style="height:482px; width:907px" /></strong></p>
<p><strong>Source: </strong>NSS Report no. 588: All India Debt &amp; Investment Survey-2019, Ministry of Statistics &amp; Programme Implementation</p>
<p>&nbsp;</p>
<p>This table shows us that rural indebtedness is higher than urban indebtedness, with 35 percent of rural households reporting being in debt compared to 22.4 percent of urban households. However, the average amount of debt of rural households is lower than their urban counterparts: Rs. 59,748 (rural) and Rs. 1,20,336 (urban). &nbsp;&nbsp;<br />
<br />
We have three different data points, if from 2018. In the intervening period the Covid-19 pandemic induced lockdowns precipitated a reverse migration and disrupted economic activity. We don&rsquo;t have data on debt and investment for the post-pandemic period, but let us try and put these numbers in context.<br />
<br />
The India supplement of the Oxfam Inequality report, released in January 2023, states that the gap between the rich and the poor in India has been rising. In 2020 the income share of the bottom 50 percent of the population is estimated to have fallen to 13 percent of the national income and less than 3 per cent of the total wealth. This is in stark contrast to the top 30 percent who own more than 90 per cent of the total wealth. Of this, the wealthiest 10 per cent own more than 72 percent of the total wealth while the top 1 percent own nearly 40.6 per cent of the total wealth in India. &nbsp;<br />
<br />
According to the Oxfam report, &ldquo;The country still has the world&rsquo;s highest number of poor at 228.9 million. On the other hand, the total number of billionaires in India increased from 102 in 2020 to 166 billionaires in 2022&rdquo;.&nbsp;<br />
The impact of this wealth concentration has been &ldquo;exceptionally poor diets, increase in debt and deaths&rdquo;. Furthermore, &ldquo;the concentration of wealth continues to be around primordial characteristics such as caste, with some communities such as the Scheduled Tribes (STs) suffering from physical remoteness and systematic exclusion&rdquo;.</p>
<p><strong>References</strong><br />
All India Debt and Investment Survey - 2019, NSS 77th Round, Ministry of Statistics &amp; Programme Implementation. Please click here to read the&nbsp;<a href="https://mospi.gov.in/sites/default/files/publication_reports/Report_no588-AIDIS-77R-SeptFinal_0.pdf">report</a>&nbsp;<br />
Survival of the Richest, the India Story, 2023, Oxfam India. Please click here for the <a href="https://d1ns4ht6ytuzzo.cloudfront.net/oxfamdata/oxfamdatapublic/2023-01/India%20Supplement%202023_digital.pdf?kz3wav0jbhJdvkJ.fK1rj1k1_5ap9FhQ%C2%A0">report&nbsp;</a></p>
',
'credit_writer' => 'Inclusive Media for Change, 23 March, 2023',
'article_img' => 'Mazdoor sangharsh.jpeg',
'article_img_thumb' => 'Mazdoor sangharsh.jpeg',
'status' => (int) 1,
'show_on_home' => (int) 1,
'lang' => 'EN',
'category_id' => (int) 4,
'tag_keyword' => '',
'seo_url' => 'top-10-of-urban-indian-households-has-7-517-times-the-assets-of-the-bottom-decile',
'meta_title' => '',
'meta_keywords' => '',
'meta_description' => '',
'noindex' => (int) 1,
'publish_date' => object(Cake\I18n\FrozenDate) {},
'most_visit_section_id' => null,
'article_big_img' => null,
'liveid' => null,
'created' => object(Cake\I18n\FrozenTime) {},
'modified' => object(Cake\I18n\FrozenTime) {},
'edate' => '',
'tags' => [
[maximum depth reached]
],
'category' => object(App\Model\Entity\Category) {},
'[new]' => false,
'[accessible]' => [
[maximum depth reached]
],
'[dirty]' => [[maximum depth reached]],
'[original]' => [[maximum depth reached]],
'[virtual]' => [[maximum depth reached]],
'[hasErrors]' => false,
'[errors]' => [[maximum depth reached]],
'[invalid]' => [[maximum depth reached]],
'[repository]' => 'Articles'
},
'articleid' => (int) 64906,
'metaTitle' => 'NEWS ALERTS | Top 10% of Urban Indian Households has 7,517 Times the Assets of the Bottom Decile',
'metaKeywords' => 'Average Value of Assets,Debt,Debt and Investment,Indebtedness,India,Inequality,National Sample Survey Organisation,NSSO,Oxfam,Urban Poverty,Wealth disparity',
'metaDesc' => 'The average value of assets (AVA) of the top ten percent of urban households in India is more than seven thousand five hundred times greater than what the bottom ten percent owns. The AVA of the top decile was Rs....',
'disp' => '<p>The average value of assets (AVA) of the top ten percent of urban households in India is more than seven thousand five hundred times greater than what the bottom ten percent owns. The AVA of the top decile was Rs. 1.5 crores, while the lowest decile owned an average of Rs. 2,000 of assets. The data is part of the <a href="https://mospi.gov.in/sites/default/files/publication_reports/Report_no588-AIDIS-77R-SeptFinal_0.pdf" title="https://mospi.gov.in/sites/default/files/publication_reports/Report_no588-AIDIS-77R-SeptFinal_0.pdf">All India Debt and Investment Survey - 2019</a>,&nbsp;the survey for which was carried out between January-December, 2019 by the National Sample Survey Organization in its 77th round. Information on the assets and liabilities of households as of 30 June, 2018. The survey was spread over 5,940 villages covering 69,455 households in the rural sector and 3,995 blocks covering 47,006 households in the urban sector.</p><p><strong>Figure 1: Average value of Assets (000&#39; Rs.) by decile class of asset holding</strong></p><p><iframe class="flourish-embed-iframe" frameborder="0" scrolling="no" src="https://flo.uri.sh/visualisation/13083254/embed" style="width:100%;height:600px;" title="Interactive or visual content"></iframe></p><div style="margin-top:4px!important; text-align:right!important; width:100%!"><a href="https://public.flourish.studio/visualisation/13083254/?utm_source=embed&amp;utm_campaign=visualisation/13083254" style="text-decoration:none!important" target="_top" title="https://public.flourish.studio/visualisation/13083254/?utm_source=embed&amp;utm_campaign=visualisation/13083254" style="text-decoration:none!important" target="_top"> </a></div><p><strong>Source:</strong> <em>NSS Report no. 588: All India Debt &amp; Investment Survey-2019, Ministry of Statistics &amp; Programme Implementation</em></p><p>&nbsp;</p><p>The chart shows the average value of assets per decile. Up till the fourth decile (30-40 percent) urban&nbsp;Indians are worse off than rural Indians, but from the fifth decile onwards the AVA of city dwellers starts outstripping rural residents. The survey suggests that rural households are better off than urban ones at the lower deciles. &nbsp; &nbsp;</p><p>Rural inequality is not as stark as in urban areas. The difference between the top and the bottom declines is 198. Meaning the top 10 percent of rural households owns on average 198 times the assets of the bottom 10 percent. The AVA of the 10th decile of rural households is Rs. 81.17 lakh while households in the 1st decile hold on average Rs. 41,000.&nbsp;<br /><br />Household assets are defined in the report as everything owned by the household that has monetary value. This includes physical assets like land, buildings, livestock, agricultural machinery and implements, non-farm business equipment, all transport equipment, and financial assets like receivable on loans advanced in cash or in kind, shares in companies and cooperative societies, banks, etc., national saving certificates and the like, deposits in companies, banks, post offices and with individuals.</p><p>What about a breakdown by social group? The report has gathered caste-wise data on ownership of assets.&nbsp;</p><p>&nbsp;</p><p><strong>Table 1: Average Value of Assets by Social Group</strong><br /><img alt="" src="/upload/images/AVA%20social%20group.PNG" style="height:288px; width:851px" /></p><p><strong>Source:</strong> NSS Report no. 588: All India Debt &amp; Investment Survey-2019, Ministry of Statistics &amp; Programme Implementation</p><p>&nbsp;</p><p>The table above shows that Scheduled Castes (SCs) are the worst off when it comes to asset ownership. The average assets of a rural SC households are equivalent to Rs. 8.79 lakh, while the figure for urban households is Rs. 13.15 lakh. Scheduled Tribes&nbsp;(STs) are slightly better off at Rs. 8.84 lakh and Rs. 18.9 lakh respectively. Other Backward Classes (OBC) households in rural areas own twice the assets of SCs and STs, at Rs. 16.45 lakh while their urban counterparts own an average of Rs. 21.2 lakhs in assets. The Upper Castes, classified as &lsquo;Others&rsquo; in the report, are the richest. Rural households own an average of Rs. 26.03 lakh while urban households own Rs. 40.54 lakh in assets.&nbsp;</p><p>&nbsp;</p><p><strong>Table 2: Incidence of indebtedness (IOI), Average amount of Debt (AOD) per household &amp; AOD per indebted household</strong></p><p><strong><img alt="" src="/upload/images/Household%20indebtedness.PNG" style="height:482px; width:907px" /></strong></p><p><strong>Source: </strong>NSS Report no. 588: All India Debt &amp; Investment Survey-2019, Ministry of Statistics &amp; Programme Implementation</p><p>&nbsp;</p><p>This table shows us that rural indebtedness is higher than urban indebtedness, with 35 percent of rural households reporting being in debt compared to 22.4 percent of urban households. However, the average amount of debt of rural households is lower than their urban counterparts: Rs. 59,748 (rural) and Rs. 1,20,336 (urban). &nbsp;&nbsp;<br /><br />We have three different data points, if from 2018. In the intervening period the Covid-19 pandemic induced lockdowns precipitated a reverse migration and disrupted economic activity. We don&rsquo;t have data on debt and investment for the post-pandemic period, but let us try and put these numbers in context.<br /><br />The India supplement of the Oxfam Inequality report, released in January 2023, states that the gap between the rich and the poor in India has been rising. In 2020 the income share of the bottom 50 percent of the population is estimated to have fallen to 13 percent of the national income and less than 3 per cent of the total wealth. This is in stark contrast to the top 30 percent who own more than 90 per cent of the total wealth. Of this, the wealthiest 10 per cent own more than 72 percent of the total wealth while the top 1 percent own nearly 40.6 per cent of the total wealth in India. &nbsp;<br /><br />According to the Oxfam report, &ldquo;The country still has the world&rsquo;s highest number of poor at 228.9 million. On the other hand, the total number of billionaires in India increased from 102 in 2020 to 166 billionaires in 2022&rdquo;.&nbsp;<br />The impact of this wealth concentration has been &ldquo;exceptionally poor diets, increase in debt and deaths&rdquo;. Furthermore, &ldquo;the concentration of wealth continues to be around primordial characteristics such as caste, with some communities such as the Scheduled Tribes (STs) suffering from physical remoteness and systematic exclusion&rdquo;.</p><p><strong>References</strong><br />All India Debt and Investment Survey - 2019, NSS 77th Round, Ministry of Statistics &amp; Programme Implementation. Please click here to read the&nbsp;<a href="https://mospi.gov.in/sites/default/files/publication_reports/Report_no588-AIDIS-77R-SeptFinal_0.pdf" title="https://mospi.gov.in/sites/default/files/publication_reports/Report_no588-AIDIS-77R-SeptFinal_0.pdf">report</a>&nbsp;<br />Survival of the Richest, the India Story, 2023, Oxfam India. Please click here for the <a href="https://d1ns4ht6ytuzzo.cloudfront.net/oxfamdata/oxfamdatapublic/2023-01/India%20Supplement%202023_digital.pdf?kz3wav0jbhJdvkJ.fK1rj1k1_5ap9FhQ%C2%A0" title="https://d1ns4ht6ytuzzo.cloudfront.net/oxfamdata/oxfamdatapublic/2023-01/India%20Supplement%202023_digital.pdf?kz3wav0jbhJdvkJ.fK1rj1k1_5ap9FhQ%C2%A0">report&nbsp;</a></p>',
'lang' => 'English',
'SITE_URL' => 'https://im4change.in/',
'site_title' => 'im4change',
'adminprix' => 'admin'
]
$article_current = object(App\Model\Entity\Article) {
'id' => (int) 64906,
'title' => 'Top 10% of Urban Indian Households has 7,517 Times the Assets of the Bottom Decile',
'subheading' => null,
'description' => '<p>The average value of assets (AVA) of the top ten percent of urban households in India is more than seven thousand five hundred times greater than what the bottom ten percent owns. The AVA of the top decile was Rs. 1.5 crores, while the lowest decile owned an average of Rs. 2,000 of assets. The data is part of the <a href="https://mospi.gov.in/sites/default/files/publication_reports/Report_no588-AIDIS-77R-SeptFinal_0.pdf">All India Debt and Investment Survey - 2019</a>,&nbsp;the survey for which was carried out between January-December, 2019 by the National Sample Survey Organization in its 77th round. Information on the assets and liabilities of households as of 30 June, 2018. The survey was spread over 5,940 villages covering 69,455 households in the rural sector and 3,995 blocks covering 47,006 households in the urban sector.</p>
<p><strong>Figure 1: Average value of Assets (000&#39; Rs.) by decile class of asset holding</strong></p>
<p><iframe class="flourish-embed-iframe" frameborder="0" scrolling="no" src="https://flo.uri.sh/visualisation/13083254/embed" style="width:100%;height:600px;" title="Interactive or visual content"></iframe></p>
<div style="margin-top:4px!important; text-align:right!important; width:100%!"><a class="flourish-credit" href="https://public.flourish.studio/visualisation/13083254/?utm_source=embed&amp;utm_campaign=visualisation/13083254" style="text-decoration:none!important" target="_top"><img alt="Made with Flourish" src="https://public.flourish.studio/resources/made_with_flourish.svg" style="border:none!important; height:16px!important; margin:0!important; width:105px!important" /> </a></div>
<p><strong>Source:</strong> <em>NSS Report no. 588: All India Debt &amp; Investment Survey-2019, Ministry of Statistics &amp; Programme Implementation</em></p>
<p>&nbsp;</p>
<p>The chart shows the average value of assets per decile. Up till the fourth decile (30-40 percent) urban&nbsp;Indians are worse off than rural Indians, but from the fifth decile onwards the AVA of city dwellers starts outstripping rural residents. The survey suggests that rural households are better off than urban ones at the lower deciles. &nbsp; &nbsp;</p>
<p>Rural inequality is not as stark as in urban areas. The difference between the top and the bottom declines is 198. Meaning the top 10 percent of rural households owns on average 198 times the assets of the bottom 10 percent. The AVA of the 10th decile of rural households is Rs. 81.17 lakh while households in the 1st decile hold on average Rs. 41,000.&nbsp;<br />
<br />
Household assets are defined in the report as everything owned by the household that has monetary value. This includes physical assets like land, buildings, livestock, agricultural machinery and implements, non-farm business equipment, all transport equipment, and financial assets like receivable on loans advanced in cash or in kind, shares in companies and cooperative societies, banks, etc., national saving certificates and the like, deposits in companies, banks, post offices and with individuals.</p>
<p>What about a breakdown by social group? The report has gathered caste-wise data on ownership of assets.&nbsp;</p>
<p>&nbsp;</p>
<p><strong>Table 1: Average Value of Assets by Social Group</strong><br />
<img alt="" src="/upload/images/AVA%20social%20group.PNG" style="height:288px; width:851px" /></p>
<p><strong>Source:</strong> NSS Report no. 588: All India Debt &amp; Investment Survey-2019, Ministry of Statistics &amp; Programme Implementation</p>
<p>&nbsp;</p>
<p>The table above shows that Scheduled Castes (SCs) are the worst off when it comes to asset ownership. The average assets of a rural SC households are equivalent to Rs. 8.79 lakh, while the figure for urban households is Rs. 13.15 lakh. Scheduled Tribes&nbsp;(STs) are slightly better off at Rs. 8.84 lakh and Rs. 18.9 lakh respectively. Other Backward Classes (OBC) households in rural areas own twice the assets of SCs and STs, at Rs. 16.45 lakh while their urban counterparts own an average of Rs. 21.2 lakhs in assets. The Upper Castes, classified as &lsquo;Others&rsquo; in the report, are the richest. Rural households own an average of Rs. 26.03 lakh while urban households own Rs. 40.54 lakh in assets.&nbsp;</p>
<p>&nbsp;</p>
<p><strong>Table 2: Incidence of indebtedness (IOI), Average amount of Debt (AOD) per household &amp; AOD per indebted household</strong></p>
<p><strong><img alt="" src="/upload/images/Household%20indebtedness.PNG" style="height:482px; width:907px" /></strong></p>
<p><strong>Source: </strong>NSS Report no. 588: All India Debt &amp; Investment Survey-2019, Ministry of Statistics &amp; Programme Implementation</p>
<p>&nbsp;</p>
<p>This table shows us that rural indebtedness is higher than urban indebtedness, with 35 percent of rural households reporting being in debt compared to 22.4 percent of urban households. However, the average amount of debt of rural households is lower than their urban counterparts: Rs. 59,748 (rural) and Rs. 1,20,336 (urban). &nbsp;&nbsp;<br />
<br />
We have three different data points, if from 2018. In the intervening period the Covid-19 pandemic induced lockdowns precipitated a reverse migration and disrupted economic activity. We don&rsquo;t have data on debt and investment for the post-pandemic period, but let us try and put these numbers in context.<br />
<br />
The India supplement of the Oxfam Inequality report, released in January 2023, states that the gap between the rich and the poor in India has been rising. In 2020 the income share of the bottom 50 percent of the population is estimated to have fallen to 13 percent of the national income and less than 3 per cent of the total wealth. This is in stark contrast to the top 30 percent who own more than 90 per cent of the total wealth. Of this, the wealthiest 10 per cent own more than 72 percent of the total wealth while the top 1 percent own nearly 40.6 per cent of the total wealth in India. &nbsp;<br />
<br />
According to the Oxfam report, &ldquo;The country still has the world&rsquo;s highest number of poor at 228.9 million. On the other hand, the total number of billionaires in India increased from 102 in 2020 to 166 billionaires in 2022&rdquo;.&nbsp;<br />
The impact of this wealth concentration has been &ldquo;exceptionally poor diets, increase in debt and deaths&rdquo;. Furthermore, &ldquo;the concentration of wealth continues to be around primordial characteristics such as caste, with some communities such as the Scheduled Tribes (STs) suffering from physical remoteness and systematic exclusion&rdquo;.</p>
<p><strong>References</strong><br />
All India Debt and Investment Survey - 2019, NSS 77th Round, Ministry of Statistics &amp; Programme Implementation. Please click here to read the&nbsp;<a href="https://mospi.gov.in/sites/default/files/publication_reports/Report_no588-AIDIS-77R-SeptFinal_0.pdf">report</a>&nbsp;<br />
Survival of the Richest, the India Story, 2023, Oxfam India. Please click here for the <a href="https://d1ns4ht6ytuzzo.cloudfront.net/oxfamdata/oxfamdatapublic/2023-01/India%20Supplement%202023_digital.pdf?kz3wav0jbhJdvkJ.fK1rj1k1_5ap9FhQ%C2%A0">report&nbsp;</a></p>
',
'credit_writer' => 'Inclusive Media for Change, 23 March, 2023',
'article_img' => 'Mazdoor sangharsh.jpeg',
'article_img_thumb' => 'Mazdoor sangharsh.jpeg',
'status' => (int) 1,
'show_on_home' => (int) 1,
'lang' => 'EN',
'category_id' => (int) 4,
'tag_keyword' => '',
'seo_url' => 'top-10-of-urban-indian-households-has-7-517-times-the-assets-of-the-bottom-decile',
'meta_title' => '',
'meta_keywords' => '',
'meta_description' => '',
'noindex' => (int) 1,
'publish_date' => object(Cake\I18n\FrozenDate) {},
'most_visit_section_id' => null,
'article_big_img' => null,
'liveid' => null,
'created' => object(Cake\I18n\FrozenTime) {},
'modified' => object(Cake\I18n\FrozenTime) {},
'edate' => '',
'tags' => [
(int) 0 => object(Cake\ORM\Entity) {},
(int) 1 => object(Cake\ORM\Entity) {},
(int) 2 => object(Cake\ORM\Entity) {},
(int) 3 => object(Cake\ORM\Entity) {},
(int) 4 => object(Cake\ORM\Entity) {},
(int) 5 => object(Cake\ORM\Entity) {},
(int) 6 => object(Cake\ORM\Entity) {},
(int) 7 => object(Cake\ORM\Entity) {},
(int) 8 => object(Cake\ORM\Entity) {},
(int) 9 => object(Cake\ORM\Entity) {},
(int) 10 => object(Cake\ORM\Entity) {}
],
'category' => object(App\Model\Entity\Category) {},
'[new]' => false,
'[accessible]' => [
'*' => true,
'id' => false
],
'[dirty]' => [],
'[original]' => [],
'[virtual]' => [],
'[hasErrors]' => false,
'[errors]' => [],
'[invalid]' => [],
'[repository]' => 'Articles'
}
$articleid = (int) 64906
$metaTitle = 'NEWS ALERTS | Top 10% of Urban Indian Households has 7,517 Times the Assets of the Bottom Decile'
$metaKeywords = 'Average Value of Assets,Debt,Debt and Investment,Indebtedness,India,Inequality,National Sample Survey Organisation,NSSO,Oxfam,Urban Poverty,Wealth disparity'
$metaDesc = 'The average value of assets (AVA) of the top ten percent of urban households in India is more than seven thousand five hundred times greater than what the bottom ten percent owns. The AVA of the top decile was Rs....'
$disp = '<p>The average value of assets (AVA) of the top ten percent of urban households in India is more than seven thousand five hundred times greater than what the bottom ten percent owns. The AVA of the top decile was Rs. 1.5 crores, while the lowest decile owned an average of Rs. 2,000 of assets. The data is part of the <a href="https://mospi.gov.in/sites/default/files/publication_reports/Report_no588-AIDIS-77R-SeptFinal_0.pdf" title="https://mospi.gov.in/sites/default/files/publication_reports/Report_no588-AIDIS-77R-SeptFinal_0.pdf">All India Debt and Investment Survey - 2019</a>,&nbsp;the survey for which was carried out between January-December, 2019 by the National Sample Survey Organization in its 77th round. Information on the assets and liabilities of households as of 30 June, 2018. The survey was spread over 5,940 villages covering 69,455 households in the rural sector and 3,995 blocks covering 47,006 households in the urban sector.</p><p><strong>Figure 1: Average value of Assets (000&#39; Rs.) by decile class of asset holding</strong></p><p><iframe class="flourish-embed-iframe" frameborder="0" scrolling="no" src="https://flo.uri.sh/visualisation/13083254/embed" style="width:100%;height:600px;" title="Interactive or visual content"></iframe></p><div style="margin-top:4px!important; text-align:right!important; width:100%!"><a href="https://public.flourish.studio/visualisation/13083254/?utm_source=embed&amp;utm_campaign=visualisation/13083254" style="text-decoration:none!important" target="_top" title="https://public.flourish.studio/visualisation/13083254/?utm_source=embed&amp;utm_campaign=visualisation/13083254" style="text-decoration:none!important" target="_top"> </a></div><p><strong>Source:</strong> <em>NSS Report no. 588: All India Debt &amp; Investment Survey-2019, Ministry of Statistics &amp; Programme Implementation</em></p><p>&nbsp;</p><p>The chart shows the average value of assets per decile. Up till the fourth decile (30-40 percent) urban&nbsp;Indians are worse off than rural Indians, but from the fifth decile onwards the AVA of city dwellers starts outstripping rural residents. The survey suggests that rural households are better off than urban ones at the lower deciles. &nbsp; &nbsp;</p><p>Rural inequality is not as stark as in urban areas. The difference between the top and the bottom declines is 198. Meaning the top 10 percent of rural households owns on average 198 times the assets of the bottom 10 percent. The AVA of the 10th decile of rural households is Rs. 81.17 lakh while households in the 1st decile hold on average Rs. 41,000.&nbsp;<br /><br />Household assets are defined in the report as everything owned by the household that has monetary value. This includes physical assets like land, buildings, livestock, agricultural machinery and implements, non-farm business equipment, all transport equipment, and financial assets like receivable on loans advanced in cash or in kind, shares in companies and cooperative societies, banks, etc., national saving certificates and the like, deposits in companies, banks, post offices and with individuals.</p><p>What about a breakdown by social group? The report has gathered caste-wise data on ownership of assets.&nbsp;</p><p>&nbsp;</p><p><strong>Table 1: Average Value of Assets by Social Group</strong><br /><img alt="" src="/upload/images/AVA%20social%20group.PNG" style="height:288px; width:851px" /></p><p><strong>Source:</strong> NSS Report no. 588: All India Debt &amp; Investment Survey-2019, Ministry of Statistics &amp; Programme Implementation</p><p>&nbsp;</p><p>The table above shows that Scheduled Castes (SCs) are the worst off when it comes to asset ownership. The average assets of a rural SC households are equivalent to Rs. 8.79 lakh, while the figure for urban households is Rs. 13.15 lakh. Scheduled Tribes&nbsp;(STs) are slightly better off at Rs. 8.84 lakh and Rs. 18.9 lakh respectively. Other Backward Classes (OBC) households in rural areas own twice the assets of SCs and STs, at Rs. 16.45 lakh while their urban counterparts own an average of Rs. 21.2 lakhs in assets. The Upper Castes, classified as &lsquo;Others&rsquo; in the report, are the richest. Rural households own an average of Rs. 26.03 lakh while urban households own Rs. 40.54 lakh in assets.&nbsp;</p><p>&nbsp;</p><p><strong>Table 2: Incidence of indebtedness (IOI), Average amount of Debt (AOD) per household &amp; AOD per indebted household</strong></p><p><strong><img alt="" src="/upload/images/Household%20indebtedness.PNG" style="height:482px; width:907px" /></strong></p><p><strong>Source: </strong>NSS Report no. 588: All India Debt &amp; Investment Survey-2019, Ministry of Statistics &amp; Programme Implementation</p><p>&nbsp;</p><p>This table shows us that rural indebtedness is higher than urban indebtedness, with 35 percent of rural households reporting being in debt compared to 22.4 percent of urban households. However, the average amount of debt of rural households is lower than their urban counterparts: Rs. 59,748 (rural) and Rs. 1,20,336 (urban). &nbsp;&nbsp;<br /><br />We have three different data points, if from 2018. In the intervening period the Covid-19 pandemic induced lockdowns precipitated a reverse migration and disrupted economic activity. We don&rsquo;t have data on debt and investment for the post-pandemic period, but let us try and put these numbers in context.<br /><br />The India supplement of the Oxfam Inequality report, released in January 2023, states that the gap between the rich and the poor in India has been rising. In 2020 the income share of the bottom 50 percent of the population is estimated to have fallen to 13 percent of the national income and less than 3 per cent of the total wealth. This is in stark contrast to the top 30 percent who own more than 90 per cent of the total wealth. Of this, the wealthiest 10 per cent own more than 72 percent of the total wealth while the top 1 percent own nearly 40.6 per cent of the total wealth in India. &nbsp;<br /><br />According to the Oxfam report, &ldquo;The country still has the world&rsquo;s highest number of poor at 228.9 million. On the other hand, the total number of billionaires in India increased from 102 in 2020 to 166 billionaires in 2022&rdquo;.&nbsp;<br />The impact of this wealth concentration has been &ldquo;exceptionally poor diets, increase in debt and deaths&rdquo;. Furthermore, &ldquo;the concentration of wealth continues to be around primordial characteristics such as caste, with some communities such as the Scheduled Tribes (STs) suffering from physical remoteness and systematic exclusion&rdquo;.</p><p><strong>References</strong><br />All India Debt and Investment Survey - 2019, NSS 77th Round, Ministry of Statistics &amp; Programme Implementation. Please click here to read the&nbsp;<a href="https://mospi.gov.in/sites/default/files/publication_reports/Report_no588-AIDIS-77R-SeptFinal_0.pdf" title="https://mospi.gov.in/sites/default/files/publication_reports/Report_no588-AIDIS-77R-SeptFinal_0.pdf">report</a>&nbsp;<br />Survival of the Richest, the India Story, 2023, Oxfam India. Please click here for the <a href="https://d1ns4ht6ytuzzo.cloudfront.net/oxfamdata/oxfamdatapublic/2023-01/India%20Supplement%202023_digital.pdf?kz3wav0jbhJdvkJ.fK1rj1k1_5ap9FhQ%C2%A0" title="https://d1ns4ht6ytuzzo.cloudfront.net/oxfamdata/oxfamdatapublic/2023-01/India%20Supplement%202023_digital.pdf?kz3wav0jbhJdvkJ.fK1rj1k1_5ap9FhQ%C2%A0">report&nbsp;</a></p>'
$lang = 'English'
$SITE_URL = 'https://im4change.in/'
$site_title = 'im4change'
$adminprix = 'admin'</pre><pre class="stack-trace">include - APP/Template/Layout/printlayout.ctp, line 8
Cake\View\View::_evaluate() - CORE/src/View/View.php, line 1413
Cake\View\View::_render() - CORE/src/View/View.php, line 1374
Cake\View\View::renderLayout() - CORE/src/View/View.php, line 927
Cake\View\View::render() - CORE/src/View/View.php, line 885
Cake\Controller\Controller::render() - CORE/src/Controller/Controller.php, line 791
Cake\Http\ActionDispatcher::_invoke() - CORE/src/Http/ActionDispatcher.php, line 126
Cake\Http\ActionDispatcher::dispatch() - CORE/src/Http/ActionDispatcher.php, line 94
Cake\Http\BaseApplication::__invoke() - CORE/src/Http/BaseApplication.php, line 235
Cake\Http\Runner::__invoke() - CORE/src/Http/Runner.php, line 65
Cake\Routing\Middleware\RoutingMiddleware::__invoke() - CORE/src/Routing/Middleware/RoutingMiddleware.php, line 162
Cake\Http\Runner::__invoke() - CORE/src/Http/Runner.php, line 65
Cake\Routing\Middleware\AssetMiddleware::__invoke() - CORE/src/Routing/Middleware/AssetMiddleware.php, line 88
Cake\Http\Runner::__invoke() - CORE/src/Http/Runner.php, line 65
Cake\Error\Middleware\ErrorHandlerMiddleware::__invoke() - CORE/src/Error/Middleware/ErrorHandlerMiddleware.php, line 96
Cake\Http\Runner::__invoke() - CORE/src/Http/Runner.php, line 65
Cake\Http\Runner::run() - CORE/src/Http/Runner.php, line 51</pre></div></pre>news-alerts-57/top-10-of-urban-indian-households-has-7-517-times-the-assets-of-the-bottom-decile.html"/>
<meta http-equiv="Content-Type" content="text/html; charset=utf-8"/>
<link href="https://im4change.in/css/control.css" rel="stylesheet" type="text/css"
media="all"/>
<title>NEWS ALERTS | Top 10% of Urban Indian Households has 7,517 Times the Assets of the Bottom Decile | Im4change.org</title>
<meta name="description" content="The average value of assets (AVA) of the top ten percent of urban households in India is more than seven thousand five hundred times greater than what the bottom ten percent owns. The AVA of the top decile was Rs...."/>
<script src="https://im4change.in/js/jquery-1.10.2.js"></script>
<script type="text/javascript" src="https://im4change.in/js/jquery-migrate.min.js"></script>
<script language="javascript" type="text/javascript">
$(document).ready(function () {
var img = $("img")[0]; // Get my img elem
var pic_real_width, pic_real_height;
$("<img/>") // Make in memory copy of image to avoid css issues
.attr("src", $(img).attr("src"))
.load(function () {
pic_real_width = this.width; // Note: $(this).width() will not
pic_real_height = this.height; // work for in memory images.
});
});
</script>
<style type="text/css">
@media screen {
div.divFooter {
display: block;
}
}
@media print {
.printbutton {
display: none !important;
}
}
</style>
</head>
<body>
<table cellpadding="0" cellspacing="0" border="0" width="98%" align="center">
<tr>
<td class="top_bg">
<div class="divFooter">
<img src="https://im4change.in/images/logo1.jpg" height="59" border="0"
alt="Resource centre on India's rural distress" style="padding-top:14px;"/>
</div>
</td>
</tr>
<tr>
<td id="topspace"> </td>
</tr>
<tr id="topspace">
<td> </td>
</tr>
<tr>
<td height="50" style="border-bottom:1px solid #000; padding-top:10px;" class="printbutton">
<form><input type="button" value=" Print this page "
onclick="window.print();return false;"/></form>
</td>
</tr>
<tr>
<td width="100%">
<h1 class="news_headlines" style="font-style:normal">
<strong>Top 10% of Urban Indian Households has 7,517 Times the Assets of the Bottom Decile</strong></h1>
</td>
</tr>
<tr>
<td width="100%" style="font-family:Arial, 'Segoe Script', 'Segoe UI', sans-serif, serif"><font size="3">
<p>The average value of assets (AVA) of the top ten percent of urban households in India is more than seven thousand five hundred times greater than what the bottom ten percent owns. The AVA of the top decile was Rs. 1.5 crores, while the lowest decile owned an average of Rs. 2,000 of assets. The data is part of the <a href="https://mospi.gov.in/sites/default/files/publication_reports/Report_no588-AIDIS-77R-SeptFinal_0.pdf" title="https://mospi.gov.in/sites/default/files/publication_reports/Report_no588-AIDIS-77R-SeptFinal_0.pdf">All India Debt and Investment Survey - 2019</a>, the survey for which was carried out between January-December, 2019 by the National Sample Survey Organization in its 77th round. Information on the assets and liabilities of households as of 30 June, 2018. The survey was spread over 5,940 villages covering 69,455 households in the rural sector and 3,995 blocks covering 47,006 households in the urban sector.</p><p><strong>Figure 1: Average value of Assets (000' Rs.) by decile class of asset holding</strong></p><p><iframe class="flourish-embed-iframe" frameborder="0" scrolling="no" src="https://flo.uri.sh/visualisation/13083254/embed" style="width:100%;height:600px;" title="Interactive or visual content"></iframe></p><div style="margin-top:4px!important; text-align:right!important; width:100%!"><a href="https://public.flourish.studio/visualisation/13083254/?utm_source=embed&utm_campaign=visualisation/13083254" style="text-decoration:none!important" target="_top" title="https://public.flourish.studio/visualisation/13083254/?utm_source=embed&utm_campaign=visualisation/13083254" style="text-decoration:none!important" target="_top"> </a></div><p><strong>Source:</strong> <em>NSS Report no. 588: All India Debt & Investment Survey-2019, Ministry of Statistics & Programme Implementation</em></p><p> </p><p>The chart shows the average value of assets per decile. Up till the fourth decile (30-40 percent) urban Indians are worse off than rural Indians, but from the fifth decile onwards the AVA of city dwellers starts outstripping rural residents. The survey suggests that rural households are better off than urban ones at the lower deciles. </p><p>Rural inequality is not as stark as in urban areas. The difference between the top and the bottom declines is 198. Meaning the top 10 percent of rural households owns on average 198 times the assets of the bottom 10 percent. The AVA of the 10th decile of rural households is Rs. 81.17 lakh while households in the 1st decile hold on average Rs. 41,000. <br /><br />Household assets are defined in the report as everything owned by the household that has monetary value. This includes physical assets like land, buildings, livestock, agricultural machinery and implements, non-farm business equipment, all transport equipment, and financial assets like receivable on loans advanced in cash or in kind, shares in companies and cooperative societies, banks, etc., national saving certificates and the like, deposits in companies, banks, post offices and with individuals.</p><p>What about a breakdown by social group? The report has gathered caste-wise data on ownership of assets. </p><p> </p><p><strong>Table 1: Average Value of Assets by Social Group</strong><br /><img alt="" src="/upload/images/AVA%20social%20group.PNG" style="height:288px; width:851px" /></p><p><strong>Source:</strong> NSS Report no. 588: All India Debt & Investment Survey-2019, Ministry of Statistics & Programme Implementation</p><p> </p><p>The table above shows that Scheduled Castes (SCs) are the worst off when it comes to asset ownership. The average assets of a rural SC households are equivalent to Rs. 8.79 lakh, while the figure for urban households is Rs. 13.15 lakh. Scheduled Tribes (STs) are slightly better off at Rs. 8.84 lakh and Rs. 18.9 lakh respectively. Other Backward Classes (OBC) households in rural areas own twice the assets of SCs and STs, at Rs. 16.45 lakh while their urban counterparts own an average of Rs. 21.2 lakhs in assets. The Upper Castes, classified as ‘Others’ in the report, are the richest. Rural households own an average of Rs. 26.03 lakh while urban households own Rs. 40.54 lakh in assets. </p><p> </p><p><strong>Table 2: Incidence of indebtedness (IOI), Average amount of Debt (AOD) per household & AOD per indebted household</strong></p><p><strong><img alt="" src="/upload/images/Household%20indebtedness.PNG" style="height:482px; width:907px" /></strong></p><p><strong>Source: </strong>NSS Report no. 588: All India Debt & Investment Survey-2019, Ministry of Statistics & Programme Implementation</p><p> </p><p>This table shows us that rural indebtedness is higher than urban indebtedness, with 35 percent of rural households reporting being in debt compared to 22.4 percent of urban households. However, the average amount of debt of rural households is lower than their urban counterparts: Rs. 59,748 (rural) and Rs. 1,20,336 (urban). <br /><br />We have three different data points, if from 2018. In the intervening period the Covid-19 pandemic induced lockdowns precipitated a reverse migration and disrupted economic activity. We don’t have data on debt and investment for the post-pandemic period, but let us try and put these numbers in context.<br /><br />The India supplement of the Oxfam Inequality report, released in January 2023, states that the gap between the rich and the poor in India has been rising. In 2020 the income share of the bottom 50 percent of the population is estimated to have fallen to 13 percent of the national income and less than 3 per cent of the total wealth. This is in stark contrast to the top 30 percent who own more than 90 per cent of the total wealth. Of this, the wealthiest 10 per cent own more than 72 percent of the total wealth while the top 1 percent own nearly 40.6 per cent of the total wealth in India. <br /><br />According to the Oxfam report, “The country still has the world’s highest number of poor at 228.9 million. On the other hand, the total number of billionaires in India increased from 102 in 2020 to 166 billionaires in 2022”. <br />The impact of this wealth concentration has been “exceptionally poor diets, increase in debt and deaths”. Furthermore, “the concentration of wealth continues to be around primordial characteristics such as caste, with some communities such as the Scheduled Tribes (STs) suffering from physical remoteness and systematic exclusion”.</p><p><strong>References</strong><br />All India Debt and Investment Survey - 2019, NSS 77th Round, Ministry of Statistics & Programme Implementation. Please click here to read the <a href="https://mospi.gov.in/sites/default/files/publication_reports/Report_no588-AIDIS-77R-SeptFinal_0.pdf" title="https://mospi.gov.in/sites/default/files/publication_reports/Report_no588-AIDIS-77R-SeptFinal_0.pdf">report</a> <br />Survival of the Richest, the India Story, 2023, Oxfam India. Please click here for the <a href="https://d1ns4ht6ytuzzo.cloudfront.net/oxfamdata/oxfamdatapublic/2023-01/India%20Supplement%202023_digital.pdf?kz3wav0jbhJdvkJ.fK1rj1k1_5ap9FhQ%C2%A0" title="https://d1ns4ht6ytuzzo.cloudfront.net/oxfamdata/oxfamdatapublic/2023-01/India%20Supplement%202023_digital.pdf?kz3wav0jbhJdvkJ.fK1rj1k1_5ap9FhQ%C2%A0">report </a></p> </font>
</td>
</tr>
<tr>
<td> </td>
</tr>
<tr>
<td height="50" style="border-top:1px solid #000; border-bottom:1px solid #000;padding-top:10px;">
<form><input type="button" value=" Print this page "
onclick="window.print();return false;"/></form>
</td>
</tr>
</table></body>
</html>'
}
$cookies = []
$values = [
(int) 0 => 'text/html; charset=UTF-8'
]
$name = 'Content-Type'
$first = true
$value = 'text/html; charset=UTF-8'
header - [internal], line ??
Cake\Http\ResponseEmitter::emitHeaders() - CORE/src/Http/ResponseEmitter.php, line 181
Cake\Http\ResponseEmitter::emit() - CORE/src/Http/ResponseEmitter.php, line 55
Cake\Http\Server::emit() - CORE/src/Http/Server.php, line 141
[main] - ROOT/webroot/index.php, line 39
Notice (8): Undefined variable: urlPrefix [APP/Template/Layout/printlayout.ctp, line 8]
$viewFile = '/home/brlfuser/public_html/src/Template/Layout/printlayout.ctp'
$dataForView = [
'article_current' => object(App\Model\Entity\Article) {
'id' => (int) 64906,
'title' => 'Top 10% of Urban Indian Households has 7,517 Times the Assets of the Bottom Decile',
'subheading' => null,
'description' => '<p>The average value of assets (AVA) of the top ten percent of urban households in India is more than seven thousand five hundred times greater than what the bottom ten percent owns. The AVA of the top decile was Rs. 1.5 crores, while the lowest decile owned an average of Rs. 2,000 of assets. The data is part of the <a href="https://mospi.gov.in/sites/default/files/publication_reports/Report_no588-AIDIS-77R-SeptFinal_0.pdf">All India Debt and Investment Survey - 2019</a>, the survey for which was carried out between January-December, 2019 by the National Sample Survey Organization in its 77th round. Information on the assets and liabilities of households as of 30 June, 2018. The survey was spread over 5,940 villages covering 69,455 households in the rural sector and 3,995 blocks covering 47,006 households in the urban sector.</p>
<p><strong>Figure 1: Average value of Assets (000' Rs.) by decile class of asset holding</strong></p>
<p><iframe class="flourish-embed-iframe" frameborder="0" scrolling="no" src="https://flo.uri.sh/visualisation/13083254/embed" style="width:100%;height:600px;" title="Interactive or visual content"></iframe></p>
<div style="margin-top:4px!important; text-align:right!important; width:100%!"><a class="flourish-credit" href="https://public.flourish.studio/visualisation/13083254/?utm_source=embed&utm_campaign=visualisation/13083254" style="text-decoration:none!important" target="_top"><img alt="Made with Flourish" src="https://public.flourish.studio/resources/made_with_flourish.svg" style="border:none!important; height:16px!important; margin:0!important; width:105px!important" /> </a></div>
<p><strong>Source:</strong> <em>NSS Report no. 588: All India Debt & Investment Survey-2019, Ministry of Statistics & Programme Implementation</em></p>
<p> </p>
<p>The chart shows the average value of assets per decile. Up till the fourth decile (30-40 percent) urban Indians are worse off than rural Indians, but from the fifth decile onwards the AVA of city dwellers starts outstripping rural residents. The survey suggests that rural households are better off than urban ones at the lower deciles. </p>
<p>Rural inequality is not as stark as in urban areas. The difference between the top and the bottom declines is 198. Meaning the top 10 percent of rural households owns on average 198 times the assets of the bottom 10 percent. The AVA of the 10th decile of rural households is Rs. 81.17 lakh while households in the 1st decile hold on average Rs. 41,000. <br />
<br />
Household assets are defined in the report as everything owned by the household that has monetary value. This includes physical assets like land, buildings, livestock, agricultural machinery and implements, non-farm business equipment, all transport equipment, and financial assets like receivable on loans advanced in cash or in kind, shares in companies and cooperative societies, banks, etc., national saving certificates and the like, deposits in companies, banks, post offices and with individuals.</p>
<p>What about a breakdown by social group? The report has gathered caste-wise data on ownership of assets. </p>
<p> </p>
<p><strong>Table 1: Average Value of Assets by Social Group</strong><br />
<img alt="" src="/upload/images/AVA%20social%20group.PNG" style="height:288px; width:851px" /></p>
<p><strong>Source:</strong> NSS Report no. 588: All India Debt & Investment Survey-2019, Ministry of Statistics & Programme Implementation</p>
<p> </p>
<p>The table above shows that Scheduled Castes (SCs) are the worst off when it comes to asset ownership. The average assets of a rural SC households are equivalent to Rs. 8.79 lakh, while the figure for urban households is Rs. 13.15 lakh. Scheduled Tribes (STs) are slightly better off at Rs. 8.84 lakh and Rs. 18.9 lakh respectively. Other Backward Classes (OBC) households in rural areas own twice the assets of SCs and STs, at Rs. 16.45 lakh while their urban counterparts own an average of Rs. 21.2 lakhs in assets. The Upper Castes, classified as ‘Others’ in the report, are the richest. Rural households own an average of Rs. 26.03 lakh while urban households own Rs. 40.54 lakh in assets. </p>
<p> </p>
<p><strong>Table 2: Incidence of indebtedness (IOI), Average amount of Debt (AOD) per household & AOD per indebted household</strong></p>
<p><strong><img alt="" src="/upload/images/Household%20indebtedness.PNG" style="height:482px; width:907px" /></strong></p>
<p><strong>Source: </strong>NSS Report no. 588: All India Debt & Investment Survey-2019, Ministry of Statistics & Programme Implementation</p>
<p> </p>
<p>This table shows us that rural indebtedness is higher than urban indebtedness, with 35 percent of rural households reporting being in debt compared to 22.4 percent of urban households. However, the average amount of debt of rural households is lower than their urban counterparts: Rs. 59,748 (rural) and Rs. 1,20,336 (urban). <br />
<br />
We have three different data points, if from 2018. In the intervening period the Covid-19 pandemic induced lockdowns precipitated a reverse migration and disrupted economic activity. We don’t have data on debt and investment for the post-pandemic period, but let us try and put these numbers in context.<br />
<br />
The India supplement of the Oxfam Inequality report, released in January 2023, states that the gap between the rich and the poor in India has been rising. In 2020 the income share of the bottom 50 percent of the population is estimated to have fallen to 13 percent of the national income and less than 3 per cent of the total wealth. This is in stark contrast to the top 30 percent who own more than 90 per cent of the total wealth. Of this, the wealthiest 10 per cent own more than 72 percent of the total wealth while the top 1 percent own nearly 40.6 per cent of the total wealth in India. <br />
<br />
According to the Oxfam report, “The country still has the world’s highest number of poor at 228.9 million. On the other hand, the total number of billionaires in India increased from 102 in 2020 to 166 billionaires in 2022”. <br />
The impact of this wealth concentration has been “exceptionally poor diets, increase in debt and deaths”. Furthermore, “the concentration of wealth continues to be around primordial characteristics such as caste, with some communities such as the Scheduled Tribes (STs) suffering from physical remoteness and systematic exclusion”.</p>
<p><strong>References</strong><br />
All India Debt and Investment Survey - 2019, NSS 77th Round, Ministry of Statistics & Programme Implementation. Please click here to read the <a href="https://mospi.gov.in/sites/default/files/publication_reports/Report_no588-AIDIS-77R-SeptFinal_0.pdf">report</a> <br />
Survival of the Richest, the India Story, 2023, Oxfam India. Please click here for the <a href="https://d1ns4ht6ytuzzo.cloudfront.net/oxfamdata/oxfamdatapublic/2023-01/India%20Supplement%202023_digital.pdf?kz3wav0jbhJdvkJ.fK1rj1k1_5ap9FhQ%C2%A0">report </a></p>
',
'credit_writer' => 'Inclusive Media for Change, 23 March, 2023',
'article_img' => 'Mazdoor sangharsh.jpeg',
'article_img_thumb' => 'Mazdoor sangharsh.jpeg',
'status' => (int) 1,
'show_on_home' => (int) 1,
'lang' => 'EN',
'category_id' => (int) 4,
'tag_keyword' => '',
'seo_url' => 'top-10-of-urban-indian-households-has-7-517-times-the-assets-of-the-bottom-decile',
'meta_title' => '',
'meta_keywords' => '',
'meta_description' => '',
'noindex' => (int) 1,
'publish_date' => object(Cake\I18n\FrozenDate) {},
'most_visit_section_id' => null,
'article_big_img' => null,
'liveid' => null,
'created' => object(Cake\I18n\FrozenTime) {},
'modified' => object(Cake\I18n\FrozenTime) {},
'edate' => '',
'tags' => [
[maximum depth reached]
],
'category' => object(App\Model\Entity\Category) {},
'[new]' => false,
'[accessible]' => [
[maximum depth reached]
],
'[dirty]' => [[maximum depth reached]],
'[original]' => [[maximum depth reached]],
'[virtual]' => [[maximum depth reached]],
'[hasErrors]' => false,
'[errors]' => [[maximum depth reached]],
'[invalid]' => [[maximum depth reached]],
'[repository]' => 'Articles'
},
'articleid' => (int) 64906,
'metaTitle' => 'NEWS ALERTS | Top 10% of Urban Indian Households has 7,517 Times the Assets of the Bottom Decile',
'metaKeywords' => 'Average Value of Assets,Debt,Debt and Investment,Indebtedness,India,Inequality,National Sample Survey Organisation,NSSO,Oxfam,Urban Poverty,Wealth disparity',
'metaDesc' => 'The average value of assets (AVA) of the top ten percent of urban households in India is more than seven thousand five hundred times greater than what the bottom ten percent owns. The AVA of the top decile was Rs....',
'disp' => '<p>The average value of assets (AVA) of the top ten percent of urban households in India is more than seven thousand five hundred times greater than what the bottom ten percent owns. The AVA of the top decile was Rs. 1.5 crores, while the lowest decile owned an average of Rs. 2,000 of assets. The data is part of the <a href="https://mospi.gov.in/sites/default/files/publication_reports/Report_no588-AIDIS-77R-SeptFinal_0.pdf" title="https://mospi.gov.in/sites/default/files/publication_reports/Report_no588-AIDIS-77R-SeptFinal_0.pdf">All India Debt and Investment Survey - 2019</a>, the survey for which was carried out between January-December, 2019 by the National Sample Survey Organization in its 77th round. Information on the assets and liabilities of households as of 30 June, 2018. The survey was spread over 5,940 villages covering 69,455 households in the rural sector and 3,995 blocks covering 47,006 households in the urban sector.</p><p><strong>Figure 1: Average value of Assets (000' Rs.) by decile class of asset holding</strong></p><p><iframe class="flourish-embed-iframe" frameborder="0" scrolling="no" src="https://flo.uri.sh/visualisation/13083254/embed" style="width:100%;height:600px;" title="Interactive or visual content"></iframe></p><div style="margin-top:4px!important; text-align:right!important; width:100%!"><a href="https://public.flourish.studio/visualisation/13083254/?utm_source=embed&utm_campaign=visualisation/13083254" style="text-decoration:none!important" target="_top" title="https://public.flourish.studio/visualisation/13083254/?utm_source=embed&utm_campaign=visualisation/13083254" style="text-decoration:none!important" target="_top"> </a></div><p><strong>Source:</strong> <em>NSS Report no. 588: All India Debt & Investment Survey-2019, Ministry of Statistics & Programme Implementation</em></p><p> </p><p>The chart shows the average value of assets per decile. Up till the fourth decile (30-40 percent) urban Indians are worse off than rural Indians, but from the fifth decile onwards the AVA of city dwellers starts outstripping rural residents. The survey suggests that rural households are better off than urban ones at the lower deciles. </p><p>Rural inequality is not as stark as in urban areas. The difference between the top and the bottom declines is 198. Meaning the top 10 percent of rural households owns on average 198 times the assets of the bottom 10 percent. The AVA of the 10th decile of rural households is Rs. 81.17 lakh while households in the 1st decile hold on average Rs. 41,000. <br /><br />Household assets are defined in the report as everything owned by the household that has monetary value. This includes physical assets like land, buildings, livestock, agricultural machinery and implements, non-farm business equipment, all transport equipment, and financial assets like receivable on loans advanced in cash or in kind, shares in companies and cooperative societies, banks, etc., national saving certificates and the like, deposits in companies, banks, post offices and with individuals.</p><p>What about a breakdown by social group? The report has gathered caste-wise data on ownership of assets. </p><p> </p><p><strong>Table 1: Average Value of Assets by Social Group</strong><br /><img alt="" src="/upload/images/AVA%20social%20group.PNG" style="height:288px; width:851px" /></p><p><strong>Source:</strong> NSS Report no. 588: All India Debt & Investment Survey-2019, Ministry of Statistics & Programme Implementation</p><p> </p><p>The table above shows that Scheduled Castes (SCs) are the worst off when it comes to asset ownership. The average assets of a rural SC households are equivalent to Rs. 8.79 lakh, while the figure for urban households is Rs. 13.15 lakh. Scheduled Tribes (STs) are slightly better off at Rs. 8.84 lakh and Rs. 18.9 lakh respectively. Other Backward Classes (OBC) households in rural areas own twice the assets of SCs and STs, at Rs. 16.45 lakh while their urban counterparts own an average of Rs. 21.2 lakhs in assets. The Upper Castes, classified as ‘Others’ in the report, are the richest. Rural households own an average of Rs. 26.03 lakh while urban households own Rs. 40.54 lakh in assets. </p><p> </p><p><strong>Table 2: Incidence of indebtedness (IOI), Average amount of Debt (AOD) per household & AOD per indebted household</strong></p><p><strong><img alt="" src="/upload/images/Household%20indebtedness.PNG" style="height:482px; width:907px" /></strong></p><p><strong>Source: </strong>NSS Report no. 588: All India Debt & Investment Survey-2019, Ministry of Statistics & Programme Implementation</p><p> </p><p>This table shows us that rural indebtedness is higher than urban indebtedness, with 35 percent of rural households reporting being in debt compared to 22.4 percent of urban households. However, the average amount of debt of rural households is lower than their urban counterparts: Rs. 59,748 (rural) and Rs. 1,20,336 (urban). <br /><br />We have three different data points, if from 2018. In the intervening period the Covid-19 pandemic induced lockdowns precipitated a reverse migration and disrupted economic activity. We don’t have data on debt and investment for the post-pandemic period, but let us try and put these numbers in context.<br /><br />The India supplement of the Oxfam Inequality report, released in January 2023, states that the gap between the rich and the poor in India has been rising. In 2020 the income share of the bottom 50 percent of the population is estimated to have fallen to 13 percent of the national income and less than 3 per cent of the total wealth. This is in stark contrast to the top 30 percent who own more than 90 per cent of the total wealth. Of this, the wealthiest 10 per cent own more than 72 percent of the total wealth while the top 1 percent own nearly 40.6 per cent of the total wealth in India. <br /><br />According to the Oxfam report, “The country still has the world’s highest number of poor at 228.9 million. On the other hand, the total number of billionaires in India increased from 102 in 2020 to 166 billionaires in 2022”. <br />The impact of this wealth concentration has been “exceptionally poor diets, increase in debt and deaths”. Furthermore, “the concentration of wealth continues to be around primordial characteristics such as caste, with some communities such as the Scheduled Tribes (STs) suffering from physical remoteness and systematic exclusion”.</p><p><strong>References</strong><br />All India Debt and Investment Survey - 2019, NSS 77th Round, Ministry of Statistics & Programme Implementation. Please click here to read the <a href="https://mospi.gov.in/sites/default/files/publication_reports/Report_no588-AIDIS-77R-SeptFinal_0.pdf" title="https://mospi.gov.in/sites/default/files/publication_reports/Report_no588-AIDIS-77R-SeptFinal_0.pdf">report</a> <br />Survival of the Richest, the India Story, 2023, Oxfam India. Please click here for the <a href="https://d1ns4ht6ytuzzo.cloudfront.net/oxfamdata/oxfamdatapublic/2023-01/India%20Supplement%202023_digital.pdf?kz3wav0jbhJdvkJ.fK1rj1k1_5ap9FhQ%C2%A0" title="https://d1ns4ht6ytuzzo.cloudfront.net/oxfamdata/oxfamdatapublic/2023-01/India%20Supplement%202023_digital.pdf?kz3wav0jbhJdvkJ.fK1rj1k1_5ap9FhQ%C2%A0">report </a></p>',
'lang' => 'English',
'SITE_URL' => 'https://im4change.in/',
'site_title' => 'im4change',
'adminprix' => 'admin'
]
$article_current = object(App\Model\Entity\Article) {
'id' => (int) 64906,
'title' => 'Top 10% of Urban Indian Households has 7,517 Times the Assets of the Bottom Decile',
'subheading' => null,
'description' => '<p>The average value of assets (AVA) of the top ten percent of urban households in India is more than seven thousand five hundred times greater than what the bottom ten percent owns. The AVA of the top decile was Rs. 1.5 crores, while the lowest decile owned an average of Rs. 2,000 of assets. The data is part of the <a href="https://mospi.gov.in/sites/default/files/publication_reports/Report_no588-AIDIS-77R-SeptFinal_0.pdf">All India Debt and Investment Survey - 2019</a>, the survey for which was carried out between January-December, 2019 by the National Sample Survey Organization in its 77th round. Information on the assets and liabilities of households as of 30 June, 2018. The survey was spread over 5,940 villages covering 69,455 households in the rural sector and 3,995 blocks covering 47,006 households in the urban sector.</p>
<p><strong>Figure 1: Average value of Assets (000' Rs.) by decile class of asset holding</strong></p>
<p><iframe class="flourish-embed-iframe" frameborder="0" scrolling="no" src="https://flo.uri.sh/visualisation/13083254/embed" style="width:100%;height:600px;" title="Interactive or visual content"></iframe></p>
<div style="margin-top:4px!important; text-align:right!important; width:100%!"><a class="flourish-credit" href="https://public.flourish.studio/visualisation/13083254/?utm_source=embed&utm_campaign=visualisation/13083254" style="text-decoration:none!important" target="_top"><img alt="Made with Flourish" src="https://public.flourish.studio/resources/made_with_flourish.svg" style="border:none!important; height:16px!important; margin:0!important; width:105px!important" /> </a></div>
<p><strong>Source:</strong> <em>NSS Report no. 588: All India Debt & Investment Survey-2019, Ministry of Statistics & Programme Implementation</em></p>
<p> </p>
<p>The chart shows the average value of assets per decile. Up till the fourth decile (30-40 percent) urban Indians are worse off than rural Indians, but from the fifth decile onwards the AVA of city dwellers starts outstripping rural residents. The survey suggests that rural households are better off than urban ones at the lower deciles. </p>
<p>Rural inequality is not as stark as in urban areas. The difference between the top and the bottom declines is 198. Meaning the top 10 percent of rural households owns on average 198 times the assets of the bottom 10 percent. The AVA of the 10th decile of rural households is Rs. 81.17 lakh while households in the 1st decile hold on average Rs. 41,000. <br />
<br />
Household assets are defined in the report as everything owned by the household that has monetary value. This includes physical assets like land, buildings, livestock, agricultural machinery and implements, non-farm business equipment, all transport equipment, and financial assets like receivable on loans advanced in cash or in kind, shares in companies and cooperative societies, banks, etc., national saving certificates and the like, deposits in companies, banks, post offices and with individuals.</p>
<p>What about a breakdown by social group? The report has gathered caste-wise data on ownership of assets. </p>
<p> </p>
<p><strong>Table 1: Average Value of Assets by Social Group</strong><br />
<img alt="" src="/upload/images/AVA%20social%20group.PNG" style="height:288px; width:851px" /></p>
<p><strong>Source:</strong> NSS Report no. 588: All India Debt & Investment Survey-2019, Ministry of Statistics & Programme Implementation</p>
<p> </p>
<p>The table above shows that Scheduled Castes (SCs) are the worst off when it comes to asset ownership. The average assets of a rural SC households are equivalent to Rs. 8.79 lakh, while the figure for urban households is Rs. 13.15 lakh. Scheduled Tribes (STs) are slightly better off at Rs. 8.84 lakh and Rs. 18.9 lakh respectively. Other Backward Classes (OBC) households in rural areas own twice the assets of SCs and STs, at Rs. 16.45 lakh while their urban counterparts own an average of Rs. 21.2 lakhs in assets. The Upper Castes, classified as ‘Others’ in the report, are the richest. Rural households own an average of Rs. 26.03 lakh while urban households own Rs. 40.54 lakh in assets. </p>
<p> </p>
<p><strong>Table 2: Incidence of indebtedness (IOI), Average amount of Debt (AOD) per household & AOD per indebted household</strong></p>
<p><strong><img alt="" src="/upload/images/Household%20indebtedness.PNG" style="height:482px; width:907px" /></strong></p>
<p><strong>Source: </strong>NSS Report no. 588: All India Debt & Investment Survey-2019, Ministry of Statistics & Programme Implementation</p>
<p> </p>
<p>This table shows us that rural indebtedness is higher than urban indebtedness, with 35 percent of rural households reporting being in debt compared to 22.4 percent of urban households. However, the average amount of debt of rural households is lower than their urban counterparts: Rs. 59,748 (rural) and Rs. 1,20,336 (urban). <br />
<br />
We have three different data points, if from 2018. In the intervening period the Covid-19 pandemic induced lockdowns precipitated a reverse migration and disrupted economic activity. We don’t have data on debt and investment for the post-pandemic period, but let us try and put these numbers in context.<br />
<br />
The India supplement of the Oxfam Inequality report, released in January 2023, states that the gap between the rich and the poor in India has been rising. In 2020 the income share of the bottom 50 percent of the population is estimated to have fallen to 13 percent of the national income and less than 3 per cent of the total wealth. This is in stark contrast to the top 30 percent who own more than 90 per cent of the total wealth. Of this, the wealthiest 10 per cent own more than 72 percent of the total wealth while the top 1 percent own nearly 40.6 per cent of the total wealth in India. <br />
<br />
According to the Oxfam report, “The country still has the world’s highest number of poor at 228.9 million. On the other hand, the total number of billionaires in India increased from 102 in 2020 to 166 billionaires in 2022”. <br />
The impact of this wealth concentration has been “exceptionally poor diets, increase in debt and deaths”. Furthermore, “the concentration of wealth continues to be around primordial characteristics such as caste, with some communities such as the Scheduled Tribes (STs) suffering from physical remoteness and systematic exclusion”.</p>
<p><strong>References</strong><br />
All India Debt and Investment Survey - 2019, NSS 77th Round, Ministry of Statistics & Programme Implementation. Please click here to read the <a href="https://mospi.gov.in/sites/default/files/publication_reports/Report_no588-AIDIS-77R-SeptFinal_0.pdf">report</a> <br />
Survival of the Richest, the India Story, 2023, Oxfam India. Please click here for the <a href="https://d1ns4ht6ytuzzo.cloudfront.net/oxfamdata/oxfamdatapublic/2023-01/India%20Supplement%202023_digital.pdf?kz3wav0jbhJdvkJ.fK1rj1k1_5ap9FhQ%C2%A0">report </a></p>
',
'credit_writer' => 'Inclusive Media for Change, 23 March, 2023',
'article_img' => 'Mazdoor sangharsh.jpeg',
'article_img_thumb' => 'Mazdoor sangharsh.jpeg',
'status' => (int) 1,
'show_on_home' => (int) 1,
'lang' => 'EN',
'category_id' => (int) 4,
'tag_keyword' => '',
'seo_url' => 'top-10-of-urban-indian-households-has-7-517-times-the-assets-of-the-bottom-decile',
'meta_title' => '',
'meta_keywords' => '',
'meta_description' => '',
'noindex' => (int) 1,
'publish_date' => object(Cake\I18n\FrozenDate) {},
'most_visit_section_id' => null,
'article_big_img' => null,
'liveid' => null,
'created' => object(Cake\I18n\FrozenTime) {},
'modified' => object(Cake\I18n\FrozenTime) {},
'edate' => '',
'tags' => [
(int) 0 => object(Cake\ORM\Entity) {},
(int) 1 => object(Cake\ORM\Entity) {},
(int) 2 => object(Cake\ORM\Entity) {},
(int) 3 => object(Cake\ORM\Entity) {},
(int) 4 => object(Cake\ORM\Entity) {},
(int) 5 => object(Cake\ORM\Entity) {},
(int) 6 => object(Cake\ORM\Entity) {},
(int) 7 => object(Cake\ORM\Entity) {},
(int) 8 => object(Cake\ORM\Entity) {},
(int) 9 => object(Cake\ORM\Entity) {},
(int) 10 => object(Cake\ORM\Entity) {}
],
'category' => object(App\Model\Entity\Category) {},
'[new]' => false,
'[accessible]' => [
'*' => true,
'id' => false
],
'[dirty]' => [],
'[original]' => [],
'[virtual]' => [],
'[hasErrors]' => false,
'[errors]' => [],
'[invalid]' => [],
'[repository]' => 'Articles'
}
$articleid = (int) 64906
$metaTitle = 'NEWS ALERTS | Top 10% of Urban Indian Households has 7,517 Times the Assets of the Bottom Decile'
$metaKeywords = 'Average Value of Assets,Debt,Debt and Investment,Indebtedness,India,Inequality,National Sample Survey Organisation,NSSO,Oxfam,Urban Poverty,Wealth disparity'
$metaDesc = 'The average value of assets (AVA) of the top ten percent of urban households in India is more than seven thousand five hundred times greater than what the bottom ten percent owns. The AVA of the top decile was Rs....'
$disp = '<p>The average value of assets (AVA) of the top ten percent of urban households in India is more than seven thousand five hundred times greater than what the bottom ten percent owns. The AVA of the top decile was Rs. 1.5 crores, while the lowest decile owned an average of Rs. 2,000 of assets. The data is part of the <a href="https://mospi.gov.in/sites/default/files/publication_reports/Report_no588-AIDIS-77R-SeptFinal_0.pdf" title="https://mospi.gov.in/sites/default/files/publication_reports/Report_no588-AIDIS-77R-SeptFinal_0.pdf">All India Debt and Investment Survey - 2019</a>, the survey for which was carried out between January-December, 2019 by the National Sample Survey Organization in its 77th round. Information on the assets and liabilities of households as of 30 June, 2018. The survey was spread over 5,940 villages covering 69,455 households in the rural sector and 3,995 blocks covering 47,006 households in the urban sector.</p><p><strong>Figure 1: Average value of Assets (000' Rs.) by decile class of asset holding</strong></p><p><iframe class="flourish-embed-iframe" frameborder="0" scrolling="no" src="https://flo.uri.sh/visualisation/13083254/embed" style="width:100%;height:600px;" title="Interactive or visual content"></iframe></p><div style="margin-top:4px!important; text-align:right!important; width:100%!"><a href="https://public.flourish.studio/visualisation/13083254/?utm_source=embed&utm_campaign=visualisation/13083254" style="text-decoration:none!important" target="_top" title="https://public.flourish.studio/visualisation/13083254/?utm_source=embed&utm_campaign=visualisation/13083254" style="text-decoration:none!important" target="_top"> </a></div><p><strong>Source:</strong> <em>NSS Report no. 588: All India Debt & Investment Survey-2019, Ministry of Statistics & Programme Implementation</em></p><p> </p><p>The chart shows the average value of assets per decile. Up till the fourth decile (30-40 percent) urban Indians are worse off than rural Indians, but from the fifth decile onwards the AVA of city dwellers starts outstripping rural residents. The survey suggests that rural households are better off than urban ones at the lower deciles. </p><p>Rural inequality is not as stark as in urban areas. The difference between the top and the bottom declines is 198. Meaning the top 10 percent of rural households owns on average 198 times the assets of the bottom 10 percent. The AVA of the 10th decile of rural households is Rs. 81.17 lakh while households in the 1st decile hold on average Rs. 41,000. <br /><br />Household assets are defined in the report as everything owned by the household that has monetary value. This includes physical assets like land, buildings, livestock, agricultural machinery and implements, non-farm business equipment, all transport equipment, and financial assets like receivable on loans advanced in cash or in kind, shares in companies and cooperative societies, banks, etc., national saving certificates and the like, deposits in companies, banks, post offices and with individuals.</p><p>What about a breakdown by social group? The report has gathered caste-wise data on ownership of assets. </p><p> </p><p><strong>Table 1: Average Value of Assets by Social Group</strong><br /><img alt="" src="/upload/images/AVA%20social%20group.PNG" style="height:288px; width:851px" /></p><p><strong>Source:</strong> NSS Report no. 588: All India Debt & Investment Survey-2019, Ministry of Statistics & Programme Implementation</p><p> </p><p>The table above shows that Scheduled Castes (SCs) are the worst off when it comes to asset ownership. The average assets of a rural SC households are equivalent to Rs. 8.79 lakh, while the figure for urban households is Rs. 13.15 lakh. Scheduled Tribes (STs) are slightly better off at Rs. 8.84 lakh and Rs. 18.9 lakh respectively. Other Backward Classes (OBC) households in rural areas own twice the assets of SCs and STs, at Rs. 16.45 lakh while their urban counterparts own an average of Rs. 21.2 lakhs in assets. The Upper Castes, classified as ‘Others’ in the report, are the richest. Rural households own an average of Rs. 26.03 lakh while urban households own Rs. 40.54 lakh in assets. </p><p> </p><p><strong>Table 2: Incidence of indebtedness (IOI), Average amount of Debt (AOD) per household & AOD per indebted household</strong></p><p><strong><img alt="" src="/upload/images/Household%20indebtedness.PNG" style="height:482px; width:907px" /></strong></p><p><strong>Source: </strong>NSS Report no. 588: All India Debt & Investment Survey-2019, Ministry of Statistics & Programme Implementation</p><p> </p><p>This table shows us that rural indebtedness is higher than urban indebtedness, with 35 percent of rural households reporting being in debt compared to 22.4 percent of urban households. However, the average amount of debt of rural households is lower than their urban counterparts: Rs. 59,748 (rural) and Rs. 1,20,336 (urban). <br /><br />We have three different data points, if from 2018. In the intervening period the Covid-19 pandemic induced lockdowns precipitated a reverse migration and disrupted economic activity. We don’t have data on debt and investment for the post-pandemic period, but let us try and put these numbers in context.<br /><br />The India supplement of the Oxfam Inequality report, released in January 2023, states that the gap between the rich and the poor in India has been rising. In 2020 the income share of the bottom 50 percent of the population is estimated to have fallen to 13 percent of the national income and less than 3 per cent of the total wealth. This is in stark contrast to the top 30 percent who own more than 90 per cent of the total wealth. Of this, the wealthiest 10 per cent own more than 72 percent of the total wealth while the top 1 percent own nearly 40.6 per cent of the total wealth in India. <br /><br />According to the Oxfam report, “The country still has the world’s highest number of poor at 228.9 million. On the other hand, the total number of billionaires in India increased from 102 in 2020 to 166 billionaires in 2022”. <br />The impact of this wealth concentration has been “exceptionally poor diets, increase in debt and deaths”. Furthermore, “the concentration of wealth continues to be around primordial characteristics such as caste, with some communities such as the Scheduled Tribes (STs) suffering from physical remoteness and systematic exclusion”.</p><p><strong>References</strong><br />All India Debt and Investment Survey - 2019, NSS 77th Round, Ministry of Statistics & Programme Implementation. Please click here to read the <a href="https://mospi.gov.in/sites/default/files/publication_reports/Report_no588-AIDIS-77R-SeptFinal_0.pdf" title="https://mospi.gov.in/sites/default/files/publication_reports/Report_no588-AIDIS-77R-SeptFinal_0.pdf">report</a> <br />Survival of the Richest, the India Story, 2023, Oxfam India. Please click here for the <a href="https://d1ns4ht6ytuzzo.cloudfront.net/oxfamdata/oxfamdatapublic/2023-01/India%20Supplement%202023_digital.pdf?kz3wav0jbhJdvkJ.fK1rj1k1_5ap9FhQ%C2%A0" title="https://d1ns4ht6ytuzzo.cloudfront.net/oxfamdata/oxfamdatapublic/2023-01/India%20Supplement%202023_digital.pdf?kz3wav0jbhJdvkJ.fK1rj1k1_5ap9FhQ%C2%A0">report </a></p>'
$lang = 'English'
$SITE_URL = 'https://im4change.in/'
$site_title = 'im4change'
$adminprix = 'admin'
include - APP/Template/Layout/printlayout.ctp, line 8
Cake\View\View::_evaluate() - CORE/src/View/View.php, line 1413
Cake\View\View::_render() - CORE/src/View/View.php, line 1374
Cake\View\View::renderLayout() - CORE/src/View/View.php, line 927
Cake\View\View::render() - CORE/src/View/View.php, line 885
Cake\Controller\Controller::render() - CORE/src/Controller/Controller.php, line 791
Cake\Http\ActionDispatcher::_invoke() - CORE/src/Http/ActionDispatcher.php, line 126
Cake\Http\ActionDispatcher::dispatch() - CORE/src/Http/ActionDispatcher.php, line 94
Cake\Http\BaseApplication::__invoke() - CORE/src/Http/BaseApplication.php, line 235
Cake\Http\Runner::__invoke() - CORE/src/Http/Runner.php, line 65
Cake\Routing\Middleware\RoutingMiddleware::__invoke() - CORE/src/Routing/Middleware/RoutingMiddleware.php, line 162
Cake\Http\Runner::__invoke() - CORE/src/Http/Runner.php, line 65
Cake\Routing\Middleware\AssetMiddleware::__invoke() - CORE/src/Routing/Middleware/AssetMiddleware.php, line 88
Cake\Http\Runner::__invoke() - CORE/src/Http/Runner.php, line 65
Cake\Error\Middleware\ErrorHandlerMiddleware::__invoke() - CORE/src/Error/Middleware/ErrorHandlerMiddleware.php, line 96
Cake\Http\Runner::__invoke() - CORE/src/Http/Runner.php, line 65
Cake\Http\Runner::run() - CORE/src/Http/Runner.php, line 51
news-alerts-57/top-10-of-urban-indian-households-has-7-517-times-the-assets-of-the-bottom-decile.html"/>
NEWS ALERTS | Top 10% of Urban Indian Households has 7,517 Times the Assets of the Bottom Decile | Im4change.org
Top 10% of Urban Indian Households has 7,517 Times the Assets of the Bottom Decile
The average value of assets (AVA) of the top ten percent of urban households in India is more than seven thousand five hundred times greater than what the bottom ten percent owns. The AVA of the top decile was Rs. 1.5 crores, while the lowest decile owned an average of Rs. 2,000 of assets. The data is part of the All India Debt and Investment Survey - 2019, the survey for which was carried out between January-December, 2019 by the National Sample Survey Organization in its 77th round. Information on the assets and liabilities of households as of 30 June, 2018. The survey was spread over 5,940 villages covering 69,455 households in the rural sector and 3,995 blocks covering 47,006 households in the urban sector.
Figure 1: Average value of Assets (000' Rs.) by decile class of asset holding
Source:NSS Report no. 588: All India Debt & Investment Survey-2019, Ministry of Statistics & Programme Implementation
The chart shows the average value of assets per decile. Up till the fourth decile (30-40 percent) urban Indians are worse off than rural Indians, but from the fifth decile onwards the AVA of city dwellers starts outstripping rural residents. The survey suggests that rural households are better off than urban ones at the lower deciles.
Rural inequality is not as stark as in urban areas. The difference between the top and the bottom declines is 198. Meaning the top 10 percent of rural households owns on average 198 times the assets of the bottom 10 percent. The AVA of the 10th decile of rural households is Rs. 81.17 lakh while households in the 1st decile hold on average Rs. 41,000.
Household assets are defined in the report as everything owned by the household that has monetary value. This includes physical assets like land, buildings, livestock, agricultural machinery and implements, non-farm business equipment, all transport equipment, and financial assets like receivable on loans advanced in cash or in kind, shares in companies and cooperative societies, banks, etc., national saving certificates and the like, deposits in companies, banks, post offices and with individuals.
What about a breakdown by social group? The report has gathered caste-wise data on ownership of assets.
Table 1: Average Value of Assets by Social Group
Source: NSS Report no. 588: All India Debt & Investment Survey-2019, Ministry of Statistics & Programme Implementation
The table above shows that Scheduled Castes (SCs) are the worst off when it comes to asset ownership. The average assets of a rural SC households are equivalent to Rs. 8.79 lakh, while the figure for urban households is Rs. 13.15 lakh. Scheduled Tribes (STs) are slightly better off at Rs. 8.84 lakh and Rs. 18.9 lakh respectively. Other Backward Classes (OBC) households in rural areas own twice the assets of SCs and STs, at Rs. 16.45 lakh while their urban counterparts own an average of Rs. 21.2 lakhs in assets. The Upper Castes, classified as ‘Others’ in the report, are the richest. Rural households own an average of Rs. 26.03 lakh while urban households own Rs. 40.54 lakh in assets.
Table 2: Incidence of indebtedness (IOI), Average amount of Debt (AOD) per household & AOD per indebted household
Source: NSS Report no. 588: All India Debt & Investment Survey-2019, Ministry of Statistics & Programme Implementation
This table shows us that rural indebtedness is higher than urban indebtedness, with 35 percent of rural households reporting being in debt compared to 22.4 percent of urban households. However, the average amount of debt of rural households is lower than their urban counterparts: Rs. 59,748 (rural) and Rs. 1,20,336 (urban).
We have three different data points, if from 2018. In the intervening period the Covid-19 pandemic induced lockdowns precipitated a reverse migration and disrupted economic activity. We don’t have data on debt and investment for the post-pandemic period, but let us try and put these numbers in context.
The India supplement of the Oxfam Inequality report, released in January 2023, states that the gap between the rich and the poor in India has been rising. In 2020 the income share of the bottom 50 percent of the population is estimated to have fallen to 13 percent of the national income and less than 3 per cent of the total wealth. This is in stark contrast to the top 30 percent who own more than 90 per cent of the total wealth. Of this, the wealthiest 10 per cent own more than 72 percent of the total wealth while the top 1 percent own nearly 40.6 per cent of the total wealth in India.
According to the Oxfam report, “The country still has the world’s highest number of poor at 228.9 million. On the other hand, the total number of billionaires in India increased from 102 in 2020 to 166 billionaires in 2022”. The impact of this wealth concentration has been “exceptionally poor diets, increase in debt and deaths”. Furthermore, “the concentration of wealth continues to be around primordial characteristics such as caste, with some communities such as the Scheduled Tribes (STs) suffering from physical remoteness and systematic exclusion”.
References All India Debt and Investment Survey - 2019, NSS 77th Round, Ministry of Statistics & Programme Implementation. Please click here to read the report Survival of the Richest, the India Story, 2023, Oxfam India. Please click here for the report