Deprecated (16384): The ArrayAccess methods will be removed in 4.0.0.Use getParam(), getData() and getQuery() instead. - /home/brlfuser/public_html/src/Controller/ArtileDetailController.php, line: 73
You can disable deprecation warnings by setting `Error.errorLevel` to `E_ALL & ~E_USER_DEPRECATED` in your config/app.php. [CORE/src/Core/functions.php, line 311]
deprecationWarning - CORE/src/Core/functions.php, line 311
Cake\Http\ServerRequest::offsetGet() - CORE/src/Http/ServerRequest.php, line 2421
App\Controller\ArtileDetailController::printArticle() - APP/Controller/ArtileDetailController.php, line 73
Cake\Controller\Controller::invokeAction() - CORE/src/Controller/Controller.php, line 610
Cake\Http\ActionDispatcher::_invoke() - CORE/src/Http/ActionDispatcher.php, line 120
Cake\Http\ActionDispatcher::dispatch() - CORE/src/Http/ActionDispatcher.php, line 94
Cake\Http\BaseApplication::__invoke() - CORE/src/Http/BaseApplication.php, line 235
Cake\Http\Runner::__invoke() - CORE/src/Http/Runner.php, line 65
Cake\Routing\Middleware\RoutingMiddleware::__invoke() - CORE/src/Routing/Middleware/RoutingMiddleware.php, line 162
Cake\Http\Runner::__invoke() - CORE/src/Http/Runner.php, line 65
Cake\Routing\Middleware\AssetMiddleware::__invoke() - CORE/src/Routing/Middleware/AssetMiddleware.php, line 88
Cake\Http\Runner::__invoke() - CORE/src/Http/Runner.php, line 65
Cake\Error\Middleware\ErrorHandlerMiddleware::__invoke() - CORE/src/Error/Middleware/ErrorHandlerMiddleware.php, line 96
Cake\Http\Runner::__invoke() - CORE/src/Http/Runner.php, line 65
Cake\Http\Runner::run() - CORE/src/Http/Runner.php, line 51
Cake\Http\Server::run() - CORE/src/Http/Server.php, line 98
Deprecated (16384): The ArrayAccess methods will be removed in 4.0.0.Use getParam(), getData() and getQuery() instead. - /home/brlfuser/public_html/src/Controller/ArtileDetailController.php, line: 74
You can disable deprecation warnings by setting `Error.errorLevel` to `E_ALL & ~E_USER_DEPRECATED` in your config/app.php. [CORE/src/Core/functions.php, line 311]
deprecationWarning - CORE/src/Core/functions.php, line 311
Cake\Http\ServerRequest::offsetGet() - CORE/src/Http/ServerRequest.php, line 2421
App\Controller\ArtileDetailController::printArticle() - APP/Controller/ArtileDetailController.php, line 74
Cake\Controller\Controller::invokeAction() - CORE/src/Controller/Controller.php, line 610
Cake\Http\ActionDispatcher::_invoke() - CORE/src/Http/ActionDispatcher.php, line 120
Cake\Http\ActionDispatcher::dispatch() - CORE/src/Http/ActionDispatcher.php, line 94
Cake\Http\BaseApplication::__invoke() - CORE/src/Http/BaseApplication.php, line 235
Cake\Http\Runner::__invoke() - CORE/src/Http/Runner.php, line 65
Cake\Routing\Middleware\RoutingMiddleware::__invoke() - CORE/src/Routing/Middleware/RoutingMiddleware.php, line 162
Cake\Http\Runner::__invoke() - CORE/src/Http/Runner.php, line 65
Cake\Routing\Middleware\AssetMiddleware::__invoke() - CORE/src/Routing/Middleware/AssetMiddleware.php, line 88
Cake\Http\Runner::__invoke() - CORE/src/Http/Runner.php, line 65
Cake\Error\Middleware\ErrorHandlerMiddleware::__invoke() - CORE/src/Error/Middleware/ErrorHandlerMiddleware.php, line 96
Cake\Http\Runner::__invoke() - CORE/src/Http/Runner.php, line 65
Cake\Http\Runner::run() - CORE/src/Http/Runner.php, line 51
Cake\Http\Server::run() - CORE/src/Http/Server.php, line 98
Warning (512): Unable to emit headers. Headers sent in file=/home/brlfuser/public_html/vendor/cakephp/cakephp/src/Error/Debugger.php line=853 [CORE/src/Http/ResponseEmitter.php, line 48]
if (Configure::read('debug')) {
trigger_error($message, E_USER_WARNING);
} else {
$response = object(Cake\Http\Response) {
'status' => (int) 200,
'contentType' => 'text/html',
'headers' => [
'Content-Type' => [
[maximum depth reached]
]
],
'file' => null,
'fileRange' => [],
'cookies' => object(Cake\Http\Cookie\CookieCollection) {},
'cacheDirectives' => [],
'body' => '<!DOCTYPE html PUBLIC "-//W3C//DTD XHTML 1.0 Transitional//EN"
"http://www.w3.org/TR/xhtml1/DTD/xhtml1-transitional.dtd">
<html xmlns="http://www.w3.org/1999/xhtml">
<head>
<link rel="canonical" href="https://im4change.in/<pre class="cake-error"><a href="javascript:void(0);" onclick="document.getElementById('cakeErr6804fb757b1d2-trace').style.display = (document.getElementById('cakeErr6804fb757b1d2-trace').style.display == 'none' ? '' : 'none');"><b>Notice</b> (8)</a>: Undefined variable: urlPrefix [<b>APP/Template/Layout/printlayout.ctp</b>, line <b>8</b>]<div id="cakeErr6804fb757b1d2-trace" class="cake-stack-trace" style="display: none;"><a href="javascript:void(0);" onclick="document.getElementById('cakeErr6804fb757b1d2-code').style.display = (document.getElementById('cakeErr6804fb757b1d2-code').style.display == 'none' ? '' : 'none')">Code</a> <a href="javascript:void(0);" onclick="document.getElementById('cakeErr6804fb757b1d2-context').style.display = (document.getElementById('cakeErr6804fb757b1d2-context').style.display == 'none' ? '' : 'none')">Context</a><pre id="cakeErr6804fb757b1d2-code" class="cake-code-dump" style="display: none;"><code><span style="color: #000000"><span style="color: #0000BB"></span><span style="color: #007700"><</span><span style="color: #0000BB">head</span><span style="color: #007700">>
</span></span></code>
<span class="code-highlight"><code><span style="color: #000000"> <link rel="canonical" href="<span style="color: #0000BB"><?php </span><span style="color: #007700">echo </span><span style="color: #0000BB">Configure</span><span style="color: #007700">::</span><span style="color: #0000BB">read</span><span style="color: #007700">(</span><span style="color: #DD0000">'SITE_URL'</span><span style="color: #007700">); </span><span style="color: #0000BB">?><?php </span><span style="color: #007700">echo </span><span style="color: #0000BB">$urlPrefix</span><span style="color: #007700">;</span><span style="color: #0000BB">?><?php </span><span style="color: #007700">echo </span><span style="color: #0000BB">$article_current</span><span style="color: #007700">-></span><span style="color: #0000BB">category</span><span style="color: #007700">-></span><span style="color: #0000BB">slug</span><span style="color: #007700">; </span><span style="color: #0000BB">?></span>/<span style="color: #0000BB"><?php </span><span style="color: #007700">echo </span><span style="color: #0000BB">$article_current</span><span style="color: #007700">-></span><span style="color: #0000BB">seo_url</span><span style="color: #007700">; </span><span style="color: #0000BB">?></span>.html"/>
</span></code></span>
<code><span style="color: #000000"><span style="color: #0000BB"> </span><span style="color: #007700"><</span><span style="color: #0000BB">meta http</span><span style="color: #007700">-</span><span style="color: #0000BB">equiv</span><span style="color: #007700">=</span><span style="color: #DD0000">"Content-Type" </span><span style="color: #0000BB">content</span><span style="color: #007700">=</span><span style="color: #DD0000">"text/html; charset=utf-8"</span><span style="color: #007700">/>
</span></span></code></pre><pre id="cakeErr6804fb757b1d2-context" class="cake-context" style="display: none;">$viewFile = '/home/brlfuser/public_html/src/Template/Layout/printlayout.ctp'
$dataForView = [
'article_current' => object(App\Model\Entity\Article) {
'id' => (int) 943,
'title' => 'Bihar’s miraculous economic growth: Myth or reality?',
'subheading' => '',
'description' => '<p align="justify">
<br />
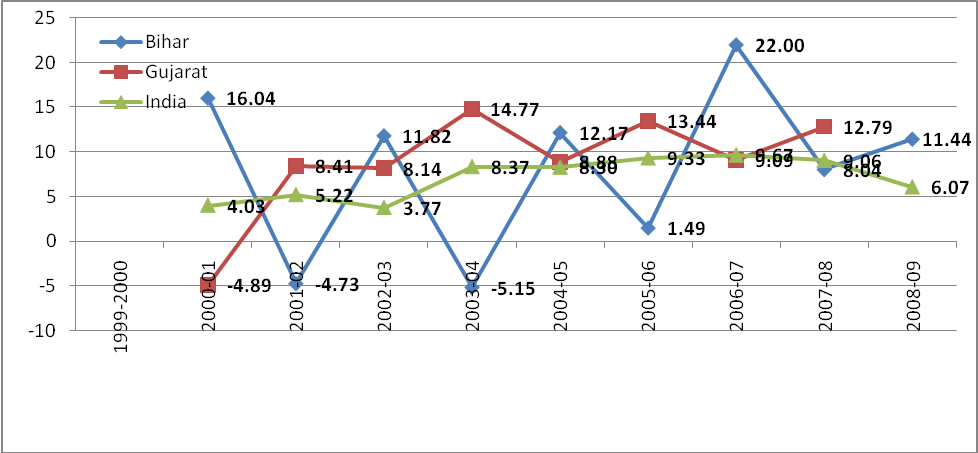
<font face="arial,helvetica,sans-serif" size="3">A section of the media seems to be mighty impressed with Bihar&rsquo;s miraculous (11.03%) average annual growth during the 2004-05 to 2008-09, supposedly akin to that of Gujarat (11.05%) but is there a catch in this stunning statistics? <em>(See the graph below)</em>. </font>
</p>
<p align="justify">
<font face="arial,helvetica,sans-serif" size="3">While the media has quoted the Gross State Domestic Product at factor cost (at constant 1999-2000 prices) as provided by the Central Statistical Organization (CSO), but the corresponding GSDP figures for Gujarat have yet to arrive. And hence, it will be a mistake to compare the average annual growth rate of Bihar from 2004-05 to 2008-09 with the average annual growth rate of Gujarat from 2004-05 to 2007-08. Besides, Bihar figures pertain to a much lower base of previous years. (The CSO does not generate data but merely reissues figures provided by the states.)&nbsp; </font>
</p>
<p align="justify">
<font face="arial,helvetica,sans-serif" size="3"><br />
The National Human Development Report 2001 of the Planning Commission shows that Bihar comes at the bottom of the Human Development Index (HDI) among the 15 states which were studied. Bihar's HDI (0.367) comes below the HDI of Madhya Pradesh (0.394, Rank: 12), Orissa (0.404, Rank: 11) and Rajasthan (0.424, Rank: 9). Bihar is way below the average national HDI (0.472). This, obviously, strengthens the case for looking at the discrepancy between GSDP growth rate and actual development on the ground. For instance we can&rsquo;t forget that about half the population of Bihar figures below the poverty line and over 56 per cent of Bihar&rsquo;s children below the age of three years are underweight. </font>
</p>
<p align="justify">
<font face="arial,helvetica,sans-serif" size="3">Even on the statistics front, there are other states too who's GSDP at factor cost (at 1999-2000 prices) data for the year 2008-09 is yet to arrive. Some of them are: Madhya Pradesh, Maharastra, West Bengal etc. From a research point of view, it is not proper to compare Bihar with any other state in the absence of corresponding data. </font>
</p>
<p align="justify">
<font face="arial,helvetica,sans-serif" size="3">Instead of taking the period 2004-05 to 2008-09, if the period 1999-2000 and 2008-09 is considered, then Bihar's average annual growth rate falls down from 11.03% to 8.13%. Similarly, if the period for growth calculation is changed, then Gujarat's average annual growth rate reduces from 11.05% to 8.83% and India's average annual growth rate reduces from 8.49% to 7.09%. </font>
</p>
<p align="justify">
<font face="arial,helvetica,sans-serif" size="3">If we look at the various components of Bihar's GSDP (at 1999-2000 prices), we get some alarming results. Agriculture and allied activities' economic progress have been dismal in the recent years. This means that the state&rsquo;s shrinking agriculture sector, on which about 80 per cent of the state&rsquo;s population depends for livelihood, continues to stagnate. During 2005-06, the growth experienced by this sector was (-) 10.82 percent, while during 2007-08 it was (-) 8.72%. For the same years, industry in Bihar grew by 28.26% and 17.83% whereas services grew by 3.09% and 14.73%, respectively. The percentage share of Agriculture and Allied activities in the entire GSDP at factor cost (at 1999-2000 constant prices) has declined from 38.8% in 2000-01 to 26.2% in 2008-09. </font>
</p>
<p align="justify">
<br />
<font face="arial,helvetica,sans-serif" size="3">The average annual growth rate of GSDP from construction (at 1999-2000 prices) between 2004-05 and 2008-09 was 36.16%. If the period is changed to between 1999-2000 and 2008-09, then the average annual growth rate of GSDP from construction turns out to be 24.44%. The percentage share of construction in the overall GSDP of Bihar has increased from 3.8% in 1999-2000 to 12.6% in 2008-09. </font>
</p>
<p align="justify">
<font face="arial,helvetica,sans-serif" size="3">The percentage share of Banking and Insurance in the entire GSDP of Bihar has more or less remained the same over the years. This sector plays a crucial role in industrial growth. We find that the percentage share of GSDP from registered manufacturing in the total GSDP of Bihar to be falling from 2.3% in 1999-2000 to 0.7% in 2008-09. The average annual growth rate of registered manufacturing GSDP during the period 2004-05 to 2008-09 has been merely 4.06%, which is much lesser than the average annual growth rate of GSDP from Agriculture and allied activities during the same period, i.e. 7.29%.&nbsp;&nbsp;&nbsp; </font>
</p>
<p align="justify">
<font face="arial,helvetica,sans-serif" size="3">The annual average growth of GSDP from unregistered manufacturing during the period 2004-05 to 2008-09 was 8.12%. The percentage share of GSDP from unregistered manufacturing in the total GSDP of Bihar has declined from 4.9% in 1999-2000 to 4.0% in 2008-09.</font>
</p>
<p align="justify">
<font face="arial,helvetica,sans-serif" size="3">The percentage share of Public Administration in the GSDP of Bihar has been declining overtime. </font>
</p>
<p align="justify">
<font face="arial,helvetica,sans-serif" size="3"><strong>Graph 1: Economic growth faced by Bihar, Gujarat and India in different years</strong></font>
</p>
<p align="justify">
<font face="arial,helvetica,sans-serif" size="3"><img style="width: 652px; height: 311px" src="tinymce/uploaded/Bihar eco gr.bmp" alt="Bihar eco gr" width="978" height="453" /><br />
<em><strong>Source: </strong></em></font><a href="http://www.mospi.nic.in/"><font face="arial,helvetica,sans-serif" size="3"><em>www.mospi.nic.in</em></font></a><font face="arial,helvetica,sans-serif" size="3"><em> </em></font>
</p>
<p align="justify">
<br />
<font face="arial,helvetica,sans-serif" size="3"><em>Further readings: </em></font>
</p>
<p align="justify">
<font face="arial,helvetica,sans-serif" size="3">GSDP data of various states of India,<br />
</font><a href="http://www.mospi.nic.in/State-wise_SDP_1999-2000_20nov09.pdf"><font face="arial,helvetica,sans-serif" size="3">http://www.mospi.nic.in/State-wise_SDP_1999-2000_20nov09.pdf</font></a><font face="arial,helvetica,sans-serif" size="3"> </font>
</p>
<p align="justify">
<font face="arial,helvetica,sans-serif" size="3">Economic Survey of Bihar 2008-09, Government of Bihar<br />
</font><a href="http://www.indiaenvironmentportal.org.in/files/ESR-2008-09-EN.pdf"><font face="arial,helvetica,sans-serif" size="3">http://www.indiaenvironmentportal.org.in/files/ESR-2008-09-EN.pdf</font></a>
</p>
<p align="justify">
<font face="arial,helvetica,sans-serif" size="3">National Human Development Report 2001, Planning Commission,<br />
</font><a href="../docs/nhd2001.pdf"><font face="arial,helvetica,sans-serif" size="3">http://www.im4change.org/docs/nhd2001.pdf</font></a><br />
<font face="arial,helvetica,sans-serif" size="3">&nbsp;<br />
Bihar&rsquo;s miracle: growth rate at 11.03 p.c., The Hindu, 3 January, 2010,<br />
</font><a href="http://beta.thehindu.com/news/states/other-states/article74958.ece"><font face="arial,helvetica,sans-serif" size="3">http://beta.thehindu.com/news/states/other-states/article74958.ece</font></a><font face="arial,helvetica,sans-serif" size="3"> </font>
</p>
<p align="justify">
<font face="arial,helvetica,sans-serif" size="3">Road to development, The Business Standard, 6 January, 2010, </font><a href="http://www.business-standard.com/india/news/road-to-development/381731/"><font face="arial,helvetica,sans-serif" size="3">http://www.business-standard.com/india/news/road-to-development/381731/</font></a><font face="arial,helvetica,sans-serif" size="3"> <br />
&nbsp;<br />
Hope for poor states, The Economic Times, 5 January, 2010,<br />
</font><a href="http://economictimes.indiatimes.com/opinion/editorial/Hope-for-poor-states/articleshow/5411079.cms"><font face="arial,helvetica,sans-serif" size="3">http://economictimes.indiatimes.com/opinion/editorial/Hope-for-poor-states/articleshow/5411079.cms</font></a><font face="arial,helvetica,sans-serif" size="3">&nbsp; <br />
&nbsp;<br />
New miracle economies: Bihar, poor states by SA Aiyar, The Times of India, 3 Jauary, 2010, </font><a href="http://blogs.timesofindia.indiatimes.com/Swaminomics/entry/new-miracle-economies-bihar-poor"><font face="arial,helvetica,sans-serif" size="3">http://blogs.timesofindia.indiatimes.com/Swaminomics/entry/new-miracle-economies-bihar-poor</font></a><font face="arial,helvetica,sans-serif" size="3">&nbsp; <br />
&nbsp;<br />
Bihar grew by 11.03%, next only to Gujarat, The Times of India, 3 January, 2010,</font>
</p>
<p align="justify">
<a href="http://timesofindia.indiatimes.com/biz/india-business/Bihar-grew-by-1103-next-only-to-Gujarat/articleshow/5405973.cms"><font face="arial,helvetica,sans-serif" size="3">http://timesofindia.indiatimes.com/biz/india-business/Bihar-grew-by-1103-next-only-to-Gujarat/articleshow/5405973.cms</font></a><font face="arial,helvetica,sans-serif" size="3">&nbsp; </font>
</p>
<p align="justify">
<font face="arial,helvetica,sans-serif" size="3">Mind The Shadows by Lola Nayar, Outlook India,<br />
</font><a href="http://www.outlookindia.com/article.aspx?263643"><font face="arial,helvetica,sans-serif" size="3">http://www.outlookindia.com/article.aspx?263643</font></a><br />
<font face="arial,helvetica,sans-serif" size="3">&nbsp;<br />
Bihar, a growth story by Raj Kumar, The Times of India, 11 January, 2010,</font>
</p>
<p align="justify">
<a href="http://timesofindia.indiatimes.com/home/sunday-toi/special-report/Bihar-a-growth-story/articleshow/5428960.cms"><font face="arial,helvetica,sans-serif" size="3">http://timesofindia.indiatimes.com/home/sunday-toi/special-report/Bihar-a-growth-story/articleshow/5428960.cms</font></a><font face="arial,helvetica,sans-serif" size="3">&nbsp; <br />
&nbsp;<br />
How Bihar can rise as a developed state by Kailash Nautiyal, Rediff.com,</font>
</p>
<p align="justify">
<a href="http://business.rediff.com/slide-show/2010/jan/04/slide-show-1-how-bihar-can-rise-as-a-developed-state.htm#contentTop"><font face="arial,helvetica,sans-serif" size="3">http://business.rediff.com/slide-show/2010/jan/04/slide-show-1-how-bihar-can-rise-as-a-developed-state.htm#contentTop</font></a><font face="arial,helvetica,sans-serif" size="3">&nbsp; <br />
&nbsp;</font>
</p>
',
'credit_writer' => '',
'article_img' => '',
'article_img_thumb' => '',
'status' => (int) 1,
'show_on_home' => (int) 1,
'lang' => 'EN',
'category_id' => (int) 15,
'tag_keyword' => '',
'seo_url' => 'bihars-miraculous-economic-growth-myth-or-reality-1017',
'meta_title' => null,
'meta_keywords' => null,
'meta_description' => null,
'noindex' => (int) 0,
'publish_date' => object(Cake\I18n\FrozenDate) {},
'most_visit_section_id' => null,
'article_big_img' => null,
'liveid' => (int) 1017,
'created' => object(Cake\I18n\FrozenTime) {},
'modified' => object(Cake\I18n\FrozenTime) {},
'edate' => '',
'tags' => [[maximum depth reached]],
'category' => object(App\Model\Entity\Category) {},
'[new]' => false,
'[accessible]' => [
[maximum depth reached]
],
'[dirty]' => [[maximum depth reached]],
'[original]' => [[maximum depth reached]],
'[virtual]' => [[maximum depth reached]],
'[hasErrors]' => false,
'[errors]' => [[maximum depth reached]],
'[invalid]' => [[maximum depth reached]],
'[repository]' => 'Articles'
},
'articleid' => (int) 943,
'metaTitle' => 'News Alerts | Bihar’s miraculous economic growth: Myth or reality?',
'metaKeywords' => null,
'metaDesc' => '
A section of the media seems to be mighty impressed with Bihar&rsquo;s miraculous (11.03%) average annual growth during the 2004-05 to 2008-09, supposedly akin to that of Gujarat (11.05%) but is there a catch in this stunning statistics? (See the...',
'disp' => '<p align="justify"><br /><font >A section of the media seems to be mighty impressed with Bihar&rsquo;s miraculous (11.03%) average annual growth during the 2004-05 to 2008-09, supposedly akin to that of Gujarat (11.05%) but is there a catch in this stunning statistics? <em>(See the graph below)</em>. </font></p><p align="justify"><font >While the media has quoted the Gross State Domestic Product at factor cost (at constant 1999-2000 prices) as provided by the Central Statistical Organization (CSO), but the corresponding GSDP figures for Gujarat have yet to arrive. And hence, it will be a mistake to compare the average annual growth rate of Bihar from 2004-05 to 2008-09 with the average annual growth rate of Gujarat from 2004-05 to 2007-08. Besides, Bihar figures pertain to a much lower base of previous years. (The CSO does not generate data but merely reissues figures provided by the states.)&nbsp; </font></p><p align="justify"><font ><br />The National Human Development Report 2001 of the Planning Commission shows that Bihar comes at the bottom of the Human Development Index (HDI) among the 15 states which were studied. Bihar's HDI (0.367) comes below the HDI of Madhya Pradesh (0.394, Rank: 12), Orissa (0.404, Rank: 11) and Rajasthan (0.424, Rank: 9). Bihar is way below the average national HDI (0.472). This, obviously, strengthens the case for looking at the discrepancy between GSDP growth rate and actual development on the ground. For instance we can&rsquo;t forget that about half the population of Bihar figures below the poverty line and over 56 per cent of Bihar&rsquo;s children below the age of three years are underweight. </font></p><p align="justify"><font >Even on the statistics front, there are other states too who's GSDP at factor cost (at 1999-2000 prices) data for the year 2008-09 is yet to arrive. Some of them are: Madhya Pradesh, Maharastra, West Bengal etc. From a research point of view, it is not proper to compare Bihar with any other state in the absence of corresponding data. </font></p><p align="justify"><font >Instead of taking the period 2004-05 to 2008-09, if the period 1999-2000 and 2008-09 is considered, then Bihar's average annual growth rate falls down from 11.03% to 8.13%. Similarly, if the period for growth calculation is changed, then Gujarat's average annual growth rate reduces from 11.05% to 8.83% and India's average annual growth rate reduces from 8.49% to 7.09%. </font></p><p align="justify"><font >If we look at the various components of Bihar's GSDP (at 1999-2000 prices), we get some alarming results. Agriculture and allied activities' economic progress have been dismal in the recent years. This means that the state&rsquo;s shrinking agriculture sector, on which about 80 per cent of the state&rsquo;s population depends for livelihood, continues to stagnate. During 2005-06, the growth experienced by this sector was (-) 10.82 percent, while during 2007-08 it was (-) 8.72%. For the same years, industry in Bihar grew by 28.26% and 17.83% whereas services grew by 3.09% and 14.73%, respectively. The percentage share of Agriculture and Allied activities in the entire GSDP at factor cost (at 1999-2000 constant prices) has declined from 38.8% in 2000-01 to 26.2% in 2008-09. </font></p><p align="justify"><br /><font >The average annual growth rate of GSDP from construction (at 1999-2000 prices) between 2004-05 and 2008-09 was 36.16%. If the period is changed to between 1999-2000 and 2008-09, then the average annual growth rate of GSDP from construction turns out to be 24.44%. The percentage share of construction in the overall GSDP of Bihar has increased from 3.8% in 1999-2000 to 12.6% in 2008-09. </font></p><p align="justify"><font >The percentage share of Banking and Insurance in the entire GSDP of Bihar has more or less remained the same over the years. This sector plays a crucial role in industrial growth. We find that the percentage share of GSDP from registered manufacturing in the total GSDP of Bihar to be falling from 2.3% in 1999-2000 to 0.7% in 2008-09. The average annual growth rate of registered manufacturing GSDP during the period 2004-05 to 2008-09 has been merely 4.06%, which is much lesser than the average annual growth rate of GSDP from Agriculture and allied activities during the same period, i.e. 7.29%.&nbsp;&nbsp;&nbsp; </font></p><p align="justify"><font >The annual average growth of GSDP from unregistered manufacturing during the period 2004-05 to 2008-09 was 8.12%. The percentage share of GSDP from unregistered manufacturing in the total GSDP of Bihar has declined from 4.9% in 1999-2000 to 4.0% in 2008-09.</font> </p><p align="justify"><font >The percentage share of Public Administration in the GSDP of Bihar has been declining overtime. </font></p><p align="justify"><font ><strong>Graph 1: Economic growth faced by Bihar, Gujarat and India in different years</strong></font> </p><p align="justify"><font ><img style="width: 652px; height: 311px" src="https://im4change.in/siteadmin/tinymce/uploaded/Bihar eco gr.bmp" alt="Bihar eco gr" width="978" height="453" /><br /><em><strong>Source: </strong></em></font><a href="http://www.mospi.nic.in/" title="http://www.mospi.nic.in/">www.mospi.nic.in</a><font ><em> </em></font></p><p align="justify"><br /><font ><em>Further readings: </em></font></p><p align="justify"><font >GSDP data of various states of India,<br /></font><a href="http://www.mospi.nic.in/State-wise_SDP_1999-2000_20nov09.pdf" title="http://www.mospi.nic.in/State-wise_SDP_1999-2000_20nov09.pdf">http://www.mospi.nic.in/State-wise_SDP_1999-2000_20nov09.pdf</a><font > </font></p><p align="justify"><font >Economic Survey of Bihar 2008-09, Government of Bihar<br /></font><a href="http://www.indiaenvironmentportal.org.in/files/ESR-2008-09-EN.pdf" title="http://www.indiaenvironmentportal.org.in/files/ESR-2008-09-EN.pdf">http://www.indiaenvironmentportal.org.in/files/ESR-2008-09-EN.pdf</a> </p><p align="justify"><font >National Human Development Report 2001, Planning Commission,<br /></font><a href="https://im4change.in/docs/nhd2001.pdf" title="https://im4change.in/docs/nhd2001.pdf">http://www.im4change.org/docs/nhd2001.pdf</a><br /><font >&nbsp;<br />Bihar&rsquo;s miracle: growth rate at 11.03 p.c., The Hindu, 3 January, 2010,<br /></font><a href="http://beta.thehindu.com/news/states/other-states/article74958.ece" title="http://beta.thehindu.com/news/states/other-states/article74958.ece">http://beta.thehindu.com/news/states/other-states/article7<br />4958.ece</a><font > </font></p><p align="justify"><font >Road to development, The Business Standard, 6 January, 2010, </font><a href="http://www.business-standard.com/india/news/road-to-development/381731/" title="http://www.business-standard.com/india/news/road-to-development/381731/">http://www.business-standard.com/india/news/road-to-develo<br />pment/381731/</a><font > <br />&nbsp;<br />Hope for poor states, The Economic Times, 5 January, 2010,<br /></font><a href="http://economictimes.indiatimes.com/opinion/editorial/Hope-for-poor-states/articleshow/5411079.cms" title="http://economictimes.indiatimes.com/opinion/editorial/Hope-for-poor-states/articleshow/5411079.cms">http://economictimes.indiatimes.com/opinion/editorial/Hope<br />-for-poor-states/articleshow/5411079.cms</a><font >&nbsp; <br />&nbsp;<br />New miracle economies: Bihar, poor states by SA Aiyar, The Times of India, 3 Jauary, 2010, </font><a href="http://blogs.timesofindia.indiatimes.com/Swaminomics/entry/new-miracle-economies-bihar-poor" title="http://blogs.timesofindia.indiatimes.com/Swaminomics/entry/new-miracle-economies-bihar-poor">http://blogs.timesofindia.indiatimes.com/Swaminomics/entry<br />/new-miracle-economies-bihar-poor</a><font >&nbsp; <br />&nbsp;<br />Bihar grew by 11.03%, next only to Gujarat, The Times of India, 3 January, 2010,</font> </p><p align="justify"><a href="http://timesofindia.indiatimes.com/biz/india-business/Bihar-grew-by-1103-next-only-to-Gujarat/articleshow/5405973.cms" title="http://timesofindia.indiatimes.com/biz/india-business/Bihar-grew-by-1103-next-only-to-Gujarat/articleshow/5405973.cms">http://timesofindia.indiatimes.com/biz/india-business/Biha<br />r-grew-by-1103-next-only-to-Gujarat/articleshow/5405973.cm<br />s</a><font >&nbsp; </font></p><p align="justify"><font >Mind The Shadows by Lola Nayar, Outlook India,<br /></font><a href="http://www.outlookindia.com/article.aspx?263643" title="http://www.outlookindia.com/article.aspx?263643">http://www.outlookindia.com/article.aspx?263643</a><br /><font >&nbsp;<br />Bihar, a growth story by Raj Kumar, The Times of India, 11 January, 2010,</font> </p><p align="justify"><a href="http://timesofindia.indiatimes.com/home/sunday-toi/special-report/Bihar-a-growth-story/articleshow/5428960.cms" title="http://timesofindia.indiatimes.com/home/sunday-toi/special-report/Bihar-a-growth-story/articleshow/5428960.cms">http://timesofindia.indiatimes.com/home/sunday-toi/special<br />-report/Bihar-a-growth-story/articleshow/5428960.cms</a><font >&nbsp; <br />&nbsp;<br />How Bihar can rise as a developed state by Kailash Nautiyal, Rediff.com,</font> </p><p align="justify"><a href="http://business.rediff.com/slide-show/2010/jan/04/slide-show-1-how-bihar-can-rise-as-a-developed-state.htm#contentTop" title="http://business.rediff.com/slide-show/2010/jan/04/slide-show-1-how-bihar-can-rise-as-a-developed-state.htm#contentTop">http://business.rediff.com/slide-show/2010/jan/04/slide-sh<br />ow-1-how-bihar-can-rise-as-a-developed-state.htm#contentTo<br />p</a><font >&nbsp; <br />&nbsp;</font> </p>',
'lang' => 'English',
'SITE_URL' => 'https://im4change.in/',
'site_title' => 'im4change',
'adminprix' => 'admin'
]
$article_current = object(App\Model\Entity\Article) {
'id' => (int) 943,
'title' => 'Bihar’s miraculous economic growth: Myth or reality?',
'subheading' => '',
'description' => '<p align="justify">
<br />
<font face="arial,helvetica,sans-serif" size="3">A section of the media seems to be mighty impressed with Bihar&rsquo;s miraculous (11.03%) average annual growth during the 2004-05 to 2008-09, supposedly akin to that of Gujarat (11.05%) but is there a catch in this stunning statistics? <em>(See the graph below)</em>. </font>
</p>
<p align="justify">
<font face="arial,helvetica,sans-serif" size="3">While the media has quoted the Gross State Domestic Product at factor cost (at constant 1999-2000 prices) as provided by the Central Statistical Organization (CSO), but the corresponding GSDP figures for Gujarat have yet to arrive. And hence, it will be a mistake to compare the average annual growth rate of Bihar from 2004-05 to 2008-09 with the average annual growth rate of Gujarat from 2004-05 to 2007-08. Besides, Bihar figures pertain to a much lower base of previous years. (The CSO does not generate data but merely reissues figures provided by the states.)&nbsp; </font>
</p>
<p align="justify">
<font face="arial,helvetica,sans-serif" size="3"><br />
The National Human Development Report 2001 of the Planning Commission shows that Bihar comes at the bottom of the Human Development Index (HDI) among the 15 states which were studied. Bihar's HDI (0.367) comes below the HDI of Madhya Pradesh (0.394, Rank: 12), Orissa (0.404, Rank: 11) and Rajasthan (0.424, Rank: 9). Bihar is way below the average national HDI (0.472). This, obviously, strengthens the case for looking at the discrepancy between GSDP growth rate and actual development on the ground. For instance we can&rsquo;t forget that about half the population of Bihar figures below the poverty line and over 56 per cent of Bihar&rsquo;s children below the age of three years are underweight. </font>
</p>
<p align="justify">
<font face="arial,helvetica,sans-serif" size="3">Even on the statistics front, there are other states too who's GSDP at factor cost (at 1999-2000 prices) data for the year 2008-09 is yet to arrive. Some of them are: Madhya Pradesh, Maharastra, West Bengal etc. From a research point of view, it is not proper to compare Bihar with any other state in the absence of corresponding data. </font>
</p>
<p align="justify">
<font face="arial,helvetica,sans-serif" size="3">Instead of taking the period 2004-05 to 2008-09, if the period 1999-2000 and 2008-09 is considered, then Bihar's average annual growth rate falls down from 11.03% to 8.13%. Similarly, if the period for growth calculation is changed, then Gujarat's average annual growth rate reduces from 11.05% to 8.83% and India's average annual growth rate reduces from 8.49% to 7.09%. </font>
</p>
<p align="justify">
<font face="arial,helvetica,sans-serif" size="3">If we look at the various components of Bihar's GSDP (at 1999-2000 prices), we get some alarming results. Agriculture and allied activities' economic progress have been dismal in the recent years. This means that the state&rsquo;s shrinking agriculture sector, on which about 80 per cent of the state&rsquo;s population depends for livelihood, continues to stagnate. During 2005-06, the growth experienced by this sector was (-) 10.82 percent, while during 2007-08 it was (-) 8.72%. For the same years, industry in Bihar grew by 28.26% and 17.83% whereas services grew by 3.09% and 14.73%, respectively. The percentage share of Agriculture and Allied activities in the entire GSDP at factor cost (at 1999-2000 constant prices) has declined from 38.8% in 2000-01 to 26.2% in 2008-09. </font>
</p>
<p align="justify">
<br />
<font face="arial,helvetica,sans-serif" size="3">The average annual growth rate of GSDP from construction (at 1999-2000 prices) between 2004-05 and 2008-09 was 36.16%. If the period is changed to between 1999-2000 and 2008-09, then the average annual growth rate of GSDP from construction turns out to be 24.44%. The percentage share of construction in the overall GSDP of Bihar has increased from 3.8% in 1999-2000 to 12.6% in 2008-09. </font>
</p>
<p align="justify">
<font face="arial,helvetica,sans-serif" size="3">The percentage share of Banking and Insurance in the entire GSDP of Bihar has more or less remained the same over the years. This sector plays a crucial role in industrial growth. We find that the percentage share of GSDP from registered manufacturing in the total GSDP of Bihar to be falling from 2.3% in 1999-2000 to 0.7% in 2008-09. The average annual growth rate of registered manufacturing GSDP during the period 2004-05 to 2008-09 has been merely 4.06%, which is much lesser than the average annual growth rate of GSDP from Agriculture and allied activities during the same period, i.e. 7.29%.&nbsp;&nbsp;&nbsp; </font>
</p>
<p align="justify">
<font face="arial,helvetica,sans-serif" size="3">The annual average growth of GSDP from unregistered manufacturing during the period 2004-05 to 2008-09 was 8.12%. The percentage share of GSDP from unregistered manufacturing in the total GSDP of Bihar has declined from 4.9% in 1999-2000 to 4.0% in 2008-09.</font>
</p>
<p align="justify">
<font face="arial,helvetica,sans-serif" size="3">The percentage share of Public Administration in the GSDP of Bihar has been declining overtime. </font>
</p>
<p align="justify">
<font face="arial,helvetica,sans-serif" size="3"><strong>Graph 1: Economic growth faced by Bihar, Gujarat and India in different years</strong></font>
</p>
<p align="justify">
<font face="arial,helvetica,sans-serif" size="3"><img style="width: 652px; height: 311px" src="tinymce/uploaded/Bihar eco gr.bmp" alt="Bihar eco gr" width="978" height="453" /><br />
<em><strong>Source: </strong></em></font><a href="http://www.mospi.nic.in/"><font face="arial,helvetica,sans-serif" size="3"><em>www.mospi.nic.in</em></font></a><font face="arial,helvetica,sans-serif" size="3"><em> </em></font>
</p>
<p align="justify">
<br />
<font face="arial,helvetica,sans-serif" size="3"><em>Further readings: </em></font>
</p>
<p align="justify">
<font face="arial,helvetica,sans-serif" size="3">GSDP data of various states of India,<br />
</font><a href="http://www.mospi.nic.in/State-wise_SDP_1999-2000_20nov09.pdf"><font face="arial,helvetica,sans-serif" size="3">http://www.mospi.nic.in/State-wise_SDP_1999-2000_20nov09.pdf</font></a><font face="arial,helvetica,sans-serif" size="3"> </font>
</p>
<p align="justify">
<font face="arial,helvetica,sans-serif" size="3">Economic Survey of Bihar 2008-09, Government of Bihar<br />
</font><a href="http://www.indiaenvironmentportal.org.in/files/ESR-2008-09-EN.pdf"><font face="arial,helvetica,sans-serif" size="3">http://www.indiaenvironmentportal.org.in/files/ESR-2008-09-EN.pdf</font></a>
</p>
<p align="justify">
<font face="arial,helvetica,sans-serif" size="3">National Human Development Report 2001, Planning Commission,<br />
</font><a href="../docs/nhd2001.pdf"><font face="arial,helvetica,sans-serif" size="3">http://www.im4change.org/docs/nhd2001.pdf</font></a><br />
<font face="arial,helvetica,sans-serif" size="3">&nbsp;<br />
Bihar&rsquo;s miracle: growth rate at 11.03 p.c., The Hindu, 3 January, 2010,<br />
</font><a href="http://beta.thehindu.com/news/states/other-states/article74958.ece"><font face="arial,helvetica,sans-serif" size="3">http://beta.thehindu.com/news/states/other-states/article74958.ece</font></a><font face="arial,helvetica,sans-serif" size="3"> </font>
</p>
<p align="justify">
<font face="arial,helvetica,sans-serif" size="3">Road to development, The Business Standard, 6 January, 2010, </font><a href="http://www.business-standard.com/india/news/road-to-development/381731/"><font face="arial,helvetica,sans-serif" size="3">http://www.business-standard.com/india/news/road-to-development/381731/</font></a><font face="arial,helvetica,sans-serif" size="3"> <br />
&nbsp;<br />
Hope for poor states, The Economic Times, 5 January, 2010,<br />
</font><a href="http://economictimes.indiatimes.com/opinion/editorial/Hope-for-poor-states/articleshow/5411079.cms"><font face="arial,helvetica,sans-serif" size="3">http://economictimes.indiatimes.com/opinion/editorial/Hope-for-poor-states/articleshow/5411079.cms</font></a><font face="arial,helvetica,sans-serif" size="3">&nbsp; <br />
&nbsp;<br />
New miracle economies: Bihar, poor states by SA Aiyar, The Times of India, 3 Jauary, 2010, </font><a href="http://blogs.timesofindia.indiatimes.com/Swaminomics/entry/new-miracle-economies-bihar-poor"><font face="arial,helvetica,sans-serif" size="3">http://blogs.timesofindia.indiatimes.com/Swaminomics/entry/new-miracle-economies-bihar-poor</font></a><font face="arial,helvetica,sans-serif" size="3">&nbsp; <br />
&nbsp;<br />
Bihar grew by 11.03%, next only to Gujarat, The Times of India, 3 January, 2010,</font>
</p>
<p align="justify">
<a href="http://timesofindia.indiatimes.com/biz/india-business/Bihar-grew-by-1103-next-only-to-Gujarat/articleshow/5405973.cms"><font face="arial,helvetica,sans-serif" size="3">http://timesofindia.indiatimes.com/biz/india-business/Bihar-grew-by-1103-next-only-to-Gujarat/articleshow/5405973.cms</font></a><font face="arial,helvetica,sans-serif" size="3">&nbsp; </font>
</p>
<p align="justify">
<font face="arial,helvetica,sans-serif" size="3">Mind The Shadows by Lola Nayar, Outlook India,<br />
</font><a href="http://www.outlookindia.com/article.aspx?263643"><font face="arial,helvetica,sans-serif" size="3">http://www.outlookindia.com/article.aspx?263643</font></a><br />
<font face="arial,helvetica,sans-serif" size="3">&nbsp;<br />
Bihar, a growth story by Raj Kumar, The Times of India, 11 January, 2010,</font>
</p>
<p align="justify">
<a href="http://timesofindia.indiatimes.com/home/sunday-toi/special-report/Bihar-a-growth-story/articleshow/5428960.cms"><font face="arial,helvetica,sans-serif" size="3">http://timesofindia.indiatimes.com/home/sunday-toi/special-report/Bihar-a-growth-story/articleshow/5428960.cms</font></a><font face="arial,helvetica,sans-serif" size="3">&nbsp; <br />
&nbsp;<br />
How Bihar can rise as a developed state by Kailash Nautiyal, Rediff.com,</font>
</p>
<p align="justify">
<a href="http://business.rediff.com/slide-show/2010/jan/04/slide-show-1-how-bihar-can-rise-as-a-developed-state.htm#contentTop"><font face="arial,helvetica,sans-serif" size="3">http://business.rediff.com/slide-show/2010/jan/04/slide-show-1-how-bihar-can-rise-as-a-developed-state.htm#contentTop</font></a><font face="arial,helvetica,sans-serif" size="3">&nbsp; <br />
&nbsp;</font>
</p>
',
'credit_writer' => '',
'article_img' => '',
'article_img_thumb' => '',
'status' => (int) 1,
'show_on_home' => (int) 1,
'lang' => 'EN',
'category_id' => (int) 15,
'tag_keyword' => '',
'seo_url' => 'bihars-miraculous-economic-growth-myth-or-reality-1017',
'meta_title' => null,
'meta_keywords' => null,
'meta_description' => null,
'noindex' => (int) 0,
'publish_date' => object(Cake\I18n\FrozenDate) {},
'most_visit_section_id' => null,
'article_big_img' => null,
'liveid' => (int) 1017,
'created' => object(Cake\I18n\FrozenTime) {},
'modified' => object(Cake\I18n\FrozenTime) {},
'edate' => '',
'tags' => [],
'category' => object(App\Model\Entity\Category) {},
'[new]' => false,
'[accessible]' => [
'*' => true,
'id' => false
],
'[dirty]' => [],
'[original]' => [],
'[virtual]' => [],
'[hasErrors]' => false,
'[errors]' => [],
'[invalid]' => [],
'[repository]' => 'Articles'
}
$articleid = (int) 943
$metaTitle = 'News Alerts | Bihar’s miraculous economic growth: Myth or reality?'
$metaKeywords = null
$metaDesc = '
A section of the media seems to be mighty impressed with Bihar&rsquo;s miraculous (11.03%) average annual growth during the 2004-05 to 2008-09, supposedly akin to that of Gujarat (11.05%) but is there a catch in this stunning statistics? (See the...'
$disp = '<p align="justify"><br /><font >A section of the media seems to be mighty impressed with Bihar&rsquo;s miraculous (11.03%) average annual growth during the 2004-05 to 2008-09, supposedly akin to that of Gujarat (11.05%) but is there a catch in this stunning statistics? <em>(See the graph below)</em>. </font></p><p align="justify"><font >While the media has quoted the Gross State Domestic Product at factor cost (at constant 1999-2000 prices) as provided by the Central Statistical Organization (CSO), but the corresponding GSDP figures for Gujarat have yet to arrive. And hence, it will be a mistake to compare the average annual growth rate of Bihar from 2004-05 to 2008-09 with the average annual growth rate of Gujarat from 2004-05 to 2007-08. Besides, Bihar figures pertain to a much lower base of previous years. (The CSO does not generate data but merely reissues figures provided by the states.)&nbsp; </font></p><p align="justify"><font ><br />The National Human Development Report 2001 of the Planning Commission shows that Bihar comes at the bottom of the Human Development Index (HDI) among the 15 states which were studied. Bihar's HDI (0.367) comes below the HDI of Madhya Pradesh (0.394, Rank: 12), Orissa (0.404, Rank: 11) and Rajasthan (0.424, Rank: 9). Bihar is way below the average national HDI (0.472). This, obviously, strengthens the case for looking at the discrepancy between GSDP growth rate and actual development on the ground. For instance we can&rsquo;t forget that about half the population of Bihar figures below the poverty line and over 56 per cent of Bihar&rsquo;s children below the age of three years are underweight. </font></p><p align="justify"><font >Even on the statistics front, there are other states too who's GSDP at factor cost (at 1999-2000 prices) data for the year 2008-09 is yet to arrive. Some of them are: Madhya Pradesh, Maharastra, West Bengal etc. From a research point of view, it is not proper to compare Bihar with any other state in the absence of corresponding data. </font></p><p align="justify"><font >Instead of taking the period 2004-05 to 2008-09, if the period 1999-2000 and 2008-09 is considered, then Bihar's average annual growth rate falls down from 11.03% to 8.13%. Similarly, if the period for growth calculation is changed, then Gujarat's average annual growth rate reduces from 11.05% to 8.83% and India's average annual growth rate reduces from 8.49% to 7.09%. </font></p><p align="justify"><font >If we look at the various components of Bihar's GSDP (at 1999-2000 prices), we get some alarming results. Agriculture and allied activities' economic progress have been dismal in the recent years. This means that the state&rsquo;s shrinking agriculture sector, on which about 80 per cent of the state&rsquo;s population depends for livelihood, continues to stagnate. During 2005-06, the growth experienced by this sector was (-) 10.82 percent, while during 2007-08 it was (-) 8.72%. For the same years, industry in Bihar grew by 28.26% and 17.83% whereas services grew by 3.09% and 14.73%, respectively. The percentage share of Agriculture and Allied activities in the entire GSDP at factor cost (at 1999-2000 constant prices) has declined from 38.8% in 2000-01 to 26.2% in 2008-09. </font></p><p align="justify"><br /><font >The average annual growth rate of GSDP from construction (at 1999-2000 prices) between 2004-05 and 2008-09 was 36.16%. If the period is changed to between 1999-2000 and 2008-09, then the average annual growth rate of GSDP from construction turns out to be 24.44%. The percentage share of construction in the overall GSDP of Bihar has increased from 3.8% in 1999-2000 to 12.6% in 2008-09. </font></p><p align="justify"><font >The percentage share of Banking and Insurance in the entire GSDP of Bihar has more or less remained the same over the years. This sector plays a crucial role in industrial growth. We find that the percentage share of GSDP from registered manufacturing in the total GSDP of Bihar to be falling from 2.3% in 1999-2000 to 0.7% in 2008-09. The average annual growth rate of registered manufacturing GSDP during the period 2004-05 to 2008-09 has been merely 4.06%, which is much lesser than the average annual growth rate of GSDP from Agriculture and allied activities during the same period, i.e. 7.29%.&nbsp;&nbsp;&nbsp; </font></p><p align="justify"><font >The annual average growth of GSDP from unregistered manufacturing during the period 2004-05 to 2008-09 was 8.12%. The percentage share of GSDP from unregistered manufacturing in the total GSDP of Bihar has declined from 4.9% in 1999-2000 to 4.0% in 2008-09.</font> </p><p align="justify"><font >The percentage share of Public Administration in the GSDP of Bihar has been declining overtime. </font></p><p align="justify"><font ><strong>Graph 1: Economic growth faced by Bihar, Gujarat and India in different years</strong></font> </p><p align="justify"><font ><img style="width: 652px; height: 311px" src="https://im4change.in/siteadmin/tinymce/uploaded/Bihar eco gr.bmp" alt="Bihar eco gr" width="978" height="453" /><br /><em><strong>Source: </strong></em></font><a href="http://www.mospi.nic.in/" title="http://www.mospi.nic.in/">www.mospi.nic.in</a><font ><em> </em></font></p><p align="justify"><br /><font ><em>Further readings: </em></font></p><p align="justify"><font >GSDP data of various states of India,<br /></font><a href="http://www.mospi.nic.in/State-wise_SDP_1999-2000_20nov09.pdf" title="http://www.mospi.nic.in/State-wise_SDP_1999-2000_20nov09.pdf">http://www.mospi.nic.in/State-wise_SDP_1999-2000_20nov09.pdf</a><font > </font></p><p align="justify"><font >Economic Survey of Bihar 2008-09, Government of Bihar<br /></font><a href="http://www.indiaenvironmentportal.org.in/files/ESR-2008-09-EN.pdf" title="http://www.indiaenvironmentportal.org.in/files/ESR-2008-09-EN.pdf">http://www.indiaenvironmentportal.org.in/files/ESR-2008-09-EN.pdf</a> </p><p align="justify"><font >National Human Development Report 2001, Planning Commission,<br /></font><a href="https://im4change.in/docs/nhd2001.pdf" title="https://im4change.in/docs/nhd2001.pdf">http://www.im4change.org/docs/nhd2001.pdf</a><br /><font >&nbsp;<br />Bihar&rsquo;s miracle: growth rate at 11.03 p.c., The Hindu, 3 January, 2010,<br /></font><a href="http://beta.thehindu.com/news/states/other-states/article74958.ece" title="http://beta.thehindu.com/news/states/other-states/article74958.ece">http://beta.thehindu.com/news/states/other-states/article7<br />4958.ece</a><font > </font></p><p align="justify"><font >Road to development, The Business Standard, 6 January, 2010, </font><a href="http://www.business-standard.com/india/news/road-to-development/381731/" title="http://www.business-standard.com/india/news/road-to-development/381731/">http://www.business-standard.com/india/news/road-to-develo<br />pment/381731/</a><font > <br />&nbsp;<br />Hope for poor states, The Economic Times, 5 January, 2010,<br /></font><a href="http://economictimes.indiatimes.com/opinion/editorial/Hope-for-poor-states/articleshow/5411079.cms" title="http://economictimes.indiatimes.com/opinion/editorial/Hope-for-poor-states/articleshow/5411079.cms">http://economictimes.indiatimes.com/opinion/editorial/Hope<br />-for-poor-states/articleshow/5411079.cms</a><font >&nbsp; <br />&nbsp;<br />New miracle economies: Bihar, poor states by SA Aiyar, The Times of India, 3 Jauary, 2010, </font><a href="http://blogs.timesofindia.indiatimes.com/Swaminomics/entry/new-miracle-economies-bihar-poor" title="http://blogs.timesofindia.indiatimes.com/Swaminomics/entry/new-miracle-economies-bihar-poor">http://blogs.timesofindia.indiatimes.com/Swaminomics/entry<br />/new-miracle-economies-bihar-poor</a><font >&nbsp; <br />&nbsp;<br />Bihar grew by 11.03%, next only to Gujarat, The Times of India, 3 January, 2010,</font> </p><p align="justify"><a href="http://timesofindia.indiatimes.com/biz/india-business/Bihar-grew-by-1103-next-only-to-Gujarat/articleshow/5405973.cms" title="http://timesofindia.indiatimes.com/biz/india-business/Bihar-grew-by-1103-next-only-to-Gujarat/articleshow/5405973.cms">http://timesofindia.indiatimes.com/biz/india-business/Biha<br />r-grew-by-1103-next-only-to-Gujarat/articleshow/5405973.cm<br />s</a><font >&nbsp; </font></p><p align="justify"><font >Mind The Shadows by Lola Nayar, Outlook India,<br /></font><a href="http://www.outlookindia.com/article.aspx?263643" title="http://www.outlookindia.com/article.aspx?263643">http://www.outlookindia.com/article.aspx?263643</a><br /><font >&nbsp;<br />Bihar, a growth story by Raj Kumar, The Times of India, 11 January, 2010,</font> </p><p align="justify"><a href="http://timesofindia.indiatimes.com/home/sunday-toi/special-report/Bihar-a-growth-story/articleshow/5428960.cms" title="http://timesofindia.indiatimes.com/home/sunday-toi/special-report/Bihar-a-growth-story/articleshow/5428960.cms">http://timesofindia.indiatimes.com/home/sunday-toi/special<br />-report/Bihar-a-growth-story/articleshow/5428960.cms</a><font >&nbsp; <br />&nbsp;<br />How Bihar can rise as a developed state by Kailash Nautiyal, Rediff.com,</font> </p><p align="justify"><a href="http://business.rediff.com/slide-show/2010/jan/04/slide-show-1-how-bihar-can-rise-as-a-developed-state.htm#contentTop" title="http://business.rediff.com/slide-show/2010/jan/04/slide-show-1-how-bihar-can-rise-as-a-developed-state.htm#contentTop">http://business.rediff.com/slide-show/2010/jan/04/slide-sh<br />ow-1-how-bihar-can-rise-as-a-developed-state.htm#contentTo<br />p</a><font >&nbsp; <br />&nbsp;</font> </p>'
$lang = 'English'
$SITE_URL = 'https://im4change.in/'
$site_title = 'im4change'
$adminprix = 'admin'</pre><pre class="stack-trace">include - APP/Template/Layout/printlayout.ctp, line 8
Cake\View\View::_evaluate() - CORE/src/View/View.php, line 1413
Cake\View\View::_render() - CORE/src/View/View.php, line 1374
Cake\View\View::renderLayout() - CORE/src/View/View.php, line 927
Cake\View\View::render() - CORE/src/View/View.php, line 885
Cake\Controller\Controller::render() - CORE/src/Controller/Controller.php, line 791
Cake\Http\ActionDispatcher::_invoke() - CORE/src/Http/ActionDispatcher.php, line 126
Cake\Http\ActionDispatcher::dispatch() - CORE/src/Http/ActionDispatcher.php, line 94
Cake\Http\BaseApplication::__invoke() - CORE/src/Http/BaseApplication.php, line 235
Cake\Http\Runner::__invoke() - CORE/src/Http/Runner.php, line 65
Cake\Routing\Middleware\RoutingMiddleware::__invoke() - CORE/src/Routing/Middleware/RoutingMiddleware.php, line 162
Cake\Http\Runner::__invoke() - CORE/src/Http/Runner.php, line 65
Cake\Routing\Middleware\AssetMiddleware::__invoke() - CORE/src/Routing/Middleware/AssetMiddleware.php, line 88
Cake\Http\Runner::__invoke() - CORE/src/Http/Runner.php, line 65
Cake\Error\Middleware\ErrorHandlerMiddleware::__invoke() - CORE/src/Error/Middleware/ErrorHandlerMiddleware.php, line 96
Cake\Http\Runner::__invoke() - CORE/src/Http/Runner.php, line 65
Cake\Http\Runner::run() - CORE/src/Http/Runner.php, line 51</pre></div></pre>news-alerts/bihars-miraculous-economic-growth-myth-or-reality-1017.html"/>
<meta http-equiv="Content-Type" content="text/html; charset=utf-8"/>
<link href="https://im4change.in/css/control.css" rel="stylesheet" type="text/css"
media="all"/>
<title>News Alerts | Bihar’s miraculous economic growth: Myth or reality? | Im4change.org</title>
<meta name="description" content="
A section of the media seems to be mighty impressed with Bihar’s miraculous (11.03%) average annual growth during the 2004-05 to 2008-09, supposedly akin to that of Gujarat (11.05%) but is there a catch in this stunning statistics? (See the..."/>
<script src="https://im4change.in/js/jquery-1.10.2.js"></script>
<script type="text/javascript" src="https://im4change.in/js/jquery-migrate.min.js"></script>
<script language="javascript" type="text/javascript">
$(document).ready(function () {
var img = $("img")[0]; // Get my img elem
var pic_real_width, pic_real_height;
$("<img/>") // Make in memory copy of image to avoid css issues
.attr("src", $(img).attr("src"))
.load(function () {
pic_real_width = this.width; // Note: $(this).width() will not
pic_real_height = this.height; // work for in memory images.
});
});
</script>
<style type="text/css">
@media screen {
div.divFooter {
display: block;
}
}
@media print {
.printbutton {
display: none !important;
}
}
</style>
</head>
<body>
<table cellpadding="0" cellspacing="0" border="0" width="98%" align="center">
<tr>
<td class="top_bg">
<div class="divFooter">
<img src="https://im4change.in/images/logo1.jpg" height="59" border="0"
alt="Resource centre on India's rural distress" style="padding-top:14px;"/>
</div>
</td>
</tr>
<tr>
<td id="topspace"> </td>
</tr>
<tr id="topspace">
<td> </td>
</tr>
<tr>
<td height="50" style="border-bottom:1px solid #000; padding-top:10px;" class="printbutton">
<form><input type="button" value=" Print this page "
onclick="window.print();return false;"/></form>
</td>
</tr>
<tr>
<td width="100%">
<h1 class="news_headlines" style="font-style:normal">
<strong>Bihar’s miraculous economic growth: Myth or reality?</strong></h1>
</td>
</tr>
<tr>
<td width="100%" style="font-family:Arial, 'Segoe Script', 'Segoe UI', sans-serif, serif"><font size="3">
<p align="justify"><br /><font >A section of the media seems to be mighty impressed with Bihar’s miraculous (11.03%) average annual growth during the 2004-05 to 2008-09, supposedly akin to that of Gujarat (11.05%) but is there a catch in this stunning statistics? <em>(See the graph below)</em>. </font></p><p align="justify"><font >While the media has quoted the Gross State Domestic Product at factor cost (at constant 1999-2000 prices) as provided by the Central Statistical Organization (CSO), but the corresponding GSDP figures for Gujarat have yet to arrive. And hence, it will be a mistake to compare the average annual growth rate of Bihar from 2004-05 to 2008-09 with the average annual growth rate of Gujarat from 2004-05 to 2007-08. Besides, Bihar figures pertain to a much lower base of previous years. (The CSO does not generate data but merely reissues figures provided by the states.) </font></p><p align="justify"><font ><br />The National Human Development Report 2001 of the Planning Commission shows that Bihar comes at the bottom of the Human Development Index (HDI) among the 15 states which were studied. Bihar's HDI (0.367) comes below the HDI of Madhya Pradesh (0.394, Rank: 12), Orissa (0.404, Rank: 11) and Rajasthan (0.424, Rank: 9). Bihar is way below the average national HDI (0.472). This, obviously, strengthens the case for looking at the discrepancy between GSDP growth rate and actual development on the ground. For instance we can’t forget that about half the population of Bihar figures below the poverty line and over 56 per cent of Bihar’s children below the age of three years are underweight. </font></p><p align="justify"><font >Even on the statistics front, there are other states too who's GSDP at factor cost (at 1999-2000 prices) data for the year 2008-09 is yet to arrive. Some of them are: Madhya Pradesh, Maharastra, West Bengal etc. From a research point of view, it is not proper to compare Bihar with any other state in the absence of corresponding data. </font></p><p align="justify"><font >Instead of taking the period 2004-05 to 2008-09, if the period 1999-2000 and 2008-09 is considered, then Bihar's average annual growth rate falls down from 11.03% to 8.13%. Similarly, if the period for growth calculation is changed, then Gujarat's average annual growth rate reduces from 11.05% to 8.83% and India's average annual growth rate reduces from 8.49% to 7.09%. </font></p><p align="justify"><font >If we look at the various components of Bihar's GSDP (at 1999-2000 prices), we get some alarming results. Agriculture and allied activities' economic progress have been dismal in the recent years. This means that the state’s shrinking agriculture sector, on which about 80 per cent of the state’s population depends for livelihood, continues to stagnate. During 2005-06, the growth experienced by this sector was (-) 10.82 percent, while during 2007-08 it was (-) 8.72%. For the same years, industry in Bihar grew by 28.26% and 17.83% whereas services grew by 3.09% and 14.73%, respectively. The percentage share of Agriculture and Allied activities in the entire GSDP at factor cost (at 1999-2000 constant prices) has declined from 38.8% in 2000-01 to 26.2% in 2008-09. </font></p><p align="justify"><br /><font >The average annual growth rate of GSDP from construction (at 1999-2000 prices) between 2004-05 and 2008-09 was 36.16%. If the period is changed to between 1999-2000 and 2008-09, then the average annual growth rate of GSDP from construction turns out to be 24.44%. The percentage share of construction in the overall GSDP of Bihar has increased from 3.8% in 1999-2000 to 12.6% in 2008-09. </font></p><p align="justify"><font >The percentage share of Banking and Insurance in the entire GSDP of Bihar has more or less remained the same over the years. This sector plays a crucial role in industrial growth. We find that the percentage share of GSDP from registered manufacturing in the total GSDP of Bihar to be falling from 2.3% in 1999-2000 to 0.7% in 2008-09. The average annual growth rate of registered manufacturing GSDP during the period 2004-05 to 2008-09 has been merely 4.06%, which is much lesser than the average annual growth rate of GSDP from Agriculture and allied activities during the same period, i.e. 7.29%. </font></p><p align="justify"><font >The annual average growth of GSDP from unregistered manufacturing during the period 2004-05 to 2008-09 was 8.12%. The percentage share of GSDP from unregistered manufacturing in the total GSDP of Bihar has declined from 4.9% in 1999-2000 to 4.0% in 2008-09.</font> </p><p align="justify"><font >The percentage share of Public Administration in the GSDP of Bihar has been declining overtime. </font></p><p align="justify"><font ><strong>Graph 1: Economic growth faced by Bihar, Gujarat and India in different years</strong></font> </p><p align="justify"><font ><img style="width: 652px; height: 311px" src="https://im4change.in/siteadmin/tinymce/uploaded/Bihar eco gr.bmp" alt="Bihar eco gr" width="978" height="453" /><br /><em><strong>Source: </strong></em></font><a href="http://www.mospi.nic.in/" title="http://www.mospi.nic.in/">www.mospi.nic.in</a><font ><em> </em></font></p><p align="justify"><br /><font ><em>Further readings: </em></font></p><p align="justify"><font >GSDP data of various states of India,<br /></font><a href="http://www.mospi.nic.in/State-wise_SDP_1999-2000_20nov09.pdf" title="http://www.mospi.nic.in/State-wise_SDP_1999-2000_20nov09.pdf">http://www.mospi.nic.in/State-wise_SDP_1999-2000_20nov09.pdf</a><font > </font></p><p align="justify"><font >Economic Survey of Bihar 2008-09, Government of Bihar<br /></font><a href="http://www.indiaenvironmentportal.org.in/files/ESR-2008-09-EN.pdf" title="http://www.indiaenvironmentportal.org.in/files/ESR-2008-09-EN.pdf">http://www.indiaenvironmentportal.org.in/files/ESR-2008-09-EN.pdf</a> </p><p align="justify"><font >National Human Development Report 2001, Planning Commission,<br /></font><a href="https://im4change.in/docs/nhd2001.pdf" title="https://im4change.in/docs/nhd2001.pdf">http://www.im4change.org/docs/nhd2001.pdf</a><br /><font > <br />Bihar’s miracle: growth rate at 11.03 p.c., The Hindu, 3 January, 2010,<br /></font><a href="http://beta.thehindu.com/news/states/other-states/article74958.ece" title="http://beta.thehindu.com/news/states/other-states/article74958.ece">http://beta.thehindu.com/news/states/other-states/article7<br />4958.ece</a><font > </font></p><p align="justify"><font >Road to development, The Business Standard, 6 January, 2010, </font><a href="http://www.business-standard.com/india/news/road-to-development/381731/" title="http://www.business-standard.com/india/news/road-to-development/381731/">http://www.business-standard.com/india/news/road-to-develo<br />pment/381731/</a><font > <br /> <br />Hope for poor states, The Economic Times, 5 January, 2010,<br /></font><a href="http://economictimes.indiatimes.com/opinion/editorial/Hope-for-poor-states/articleshow/5411079.cms" title="http://economictimes.indiatimes.com/opinion/editorial/Hope-for-poor-states/articleshow/5411079.cms">http://economictimes.indiatimes.com/opinion/editorial/Hope<br />-for-poor-states/articleshow/5411079.cms</a><font > <br /> <br />New miracle economies: Bihar, poor states by SA Aiyar, The Times of India, 3 Jauary, 2010, </font><a href="http://blogs.timesofindia.indiatimes.com/Swaminomics/entry/new-miracle-economies-bihar-poor" title="http://blogs.timesofindia.indiatimes.com/Swaminomics/entry/new-miracle-economies-bihar-poor">http://blogs.timesofindia.indiatimes.com/Swaminomics/entry<br />/new-miracle-economies-bihar-poor</a><font > <br /> <br />Bihar grew by 11.03%, next only to Gujarat, The Times of India, 3 January, 2010,</font> </p><p align="justify"><a href="http://timesofindia.indiatimes.com/biz/india-business/Bihar-grew-by-1103-next-only-to-Gujarat/articleshow/5405973.cms" title="http://timesofindia.indiatimes.com/biz/india-business/Bihar-grew-by-1103-next-only-to-Gujarat/articleshow/5405973.cms">http://timesofindia.indiatimes.com/biz/india-business/Biha<br />r-grew-by-1103-next-only-to-Gujarat/articleshow/5405973.cm<br />s</a><font > </font></p><p align="justify"><font >Mind The Shadows by Lola Nayar, Outlook India,<br /></font><a href="http://www.outlookindia.com/article.aspx?263643" title="http://www.outlookindia.com/article.aspx?263643">http://www.outlookindia.com/article.aspx?263643</a><br /><font > <br />Bihar, a growth story by Raj Kumar, The Times of India, 11 January, 2010,</font> </p><p align="justify"><a href="http://timesofindia.indiatimes.com/home/sunday-toi/special-report/Bihar-a-growth-story/articleshow/5428960.cms" title="http://timesofindia.indiatimes.com/home/sunday-toi/special-report/Bihar-a-growth-story/articleshow/5428960.cms">http://timesofindia.indiatimes.com/home/sunday-toi/special<br />-report/Bihar-a-growth-story/articleshow/5428960.cms</a><font > <br /> <br />How Bihar can rise as a developed state by Kailash Nautiyal, Rediff.com,</font> </p><p align="justify"><a href="http://business.rediff.com/slide-show/2010/jan/04/slide-show-1-how-bihar-can-rise-as-a-developed-state.htm#contentTop" title="http://business.rediff.com/slide-show/2010/jan/04/slide-show-1-how-bihar-can-rise-as-a-developed-state.htm#contentTop">http://business.rediff.com/slide-show/2010/jan/04/slide-sh<br />ow-1-how-bihar-can-rise-as-a-developed-state.htm#contentTo<br />p</a><font > <br /> </font> </p> </font>
</td>
</tr>
<tr>
<td> </td>
</tr>
<tr>
<td height="50" style="border-top:1px solid #000; border-bottom:1px solid #000;padding-top:10px;">
<form><input type="button" value=" Print this page "
onclick="window.print();return false;"/></form>
</td>
</tr>
</table></body>
</html>'
}
$maxBufferLength = (int) 8192
$file = '/home/brlfuser/public_html/vendor/cakephp/cakephp/src/Error/Debugger.php'
$line = (int) 853
$message = 'Unable to emit headers. Headers sent in file=/home/brlfuser/public_html/vendor/cakephp/cakephp/src/Error/Debugger.php line=853'
Cake\Http\ResponseEmitter::emit() - CORE/src/Http/ResponseEmitter.php, line 48
Cake\Http\Server::emit() - CORE/src/Http/Server.php, line 141
[main] - ROOT/webroot/index.php, line 39
Warning (2): Cannot modify header information - headers already sent by (output started at /home/brlfuser/public_html/vendor/cakephp/cakephp/src/Error/Debugger.php:853) [CORE/src/Http/ResponseEmitter.php, line 148]
$response = object(Cake\Http\Response) {
'status' => (int) 200,
'contentType' => 'text/html',
'headers' => [
'Content-Type' => [
[maximum depth reached]
]
],
'file' => null,
'fileRange' => [],
'cookies' => object(Cake\Http\Cookie\CookieCollection) {},
'cacheDirectives' => [],
'body' => '<!DOCTYPE html PUBLIC "-//W3C//DTD XHTML 1.0 Transitional//EN"
"http://www.w3.org/TR/xhtml1/DTD/xhtml1-transitional.dtd">
<html xmlns="http://www.w3.org/1999/xhtml">
<head>
<link rel="canonical" href="https://im4change.in/<pre class="cake-error"><a href="javascript:void(0);" onclick="document.getElementById('cakeErr6804fb757b1d2-trace').style.display = (document.getElementById('cakeErr6804fb757b1d2-trace').style.display == 'none' ? '' : 'none');"><b>Notice</b> (8)</a>: Undefined variable: urlPrefix [<b>APP/Template/Layout/printlayout.ctp</b>, line <b>8</b>]<div id="cakeErr6804fb757b1d2-trace" class="cake-stack-trace" style="display: none;"><a href="javascript:void(0);" onclick="document.getElementById('cakeErr6804fb757b1d2-code').style.display = (document.getElementById('cakeErr6804fb757b1d2-code').style.display == 'none' ? '' : 'none')">Code</a> <a href="javascript:void(0);" onclick="document.getElementById('cakeErr6804fb757b1d2-context').style.display = (document.getElementById('cakeErr6804fb757b1d2-context').style.display == 'none' ? '' : 'none')">Context</a><pre id="cakeErr6804fb757b1d2-code" class="cake-code-dump" style="display: none;"><code><span style="color: #000000"><span style="color: #0000BB"></span><span style="color: #007700"><</span><span style="color: #0000BB">head</span><span style="color: #007700">>
</span></span></code>
<span class="code-highlight"><code><span style="color: #000000"> <link rel="canonical" href="<span style="color: #0000BB"><?php </span><span style="color: #007700">echo </span><span style="color: #0000BB">Configure</span><span style="color: #007700">::</span><span style="color: #0000BB">read</span><span style="color: #007700">(</span><span style="color: #DD0000">'SITE_URL'</span><span style="color: #007700">); </span><span style="color: #0000BB">?><?php </span><span style="color: #007700">echo </span><span style="color: #0000BB">$urlPrefix</span><span style="color: #007700">;</span><span style="color: #0000BB">?><?php </span><span style="color: #007700">echo </span><span style="color: #0000BB">$article_current</span><span style="color: #007700">-></span><span style="color: #0000BB">category</span><span style="color: #007700">-></span><span style="color: #0000BB">slug</span><span style="color: #007700">; </span><span style="color: #0000BB">?></span>/<span style="color: #0000BB"><?php </span><span style="color: #007700">echo </span><span style="color: #0000BB">$article_current</span><span style="color: #007700">-></span><span style="color: #0000BB">seo_url</span><span style="color: #007700">; </span><span style="color: #0000BB">?></span>.html"/>
</span></code></span>
<code><span style="color: #000000"><span style="color: #0000BB"> </span><span style="color: #007700"><</span><span style="color: #0000BB">meta http</span><span style="color: #007700">-</span><span style="color: #0000BB">equiv</span><span style="color: #007700">=</span><span style="color: #DD0000">"Content-Type" </span><span style="color: #0000BB">content</span><span style="color: #007700">=</span><span style="color: #DD0000">"text/html; charset=utf-8"</span><span style="color: #007700">/>
</span></span></code></pre><pre id="cakeErr6804fb757b1d2-context" class="cake-context" style="display: none;">$viewFile = '/home/brlfuser/public_html/src/Template/Layout/printlayout.ctp'
$dataForView = [
'article_current' => object(App\Model\Entity\Article) {
'id' => (int) 943,
'title' => 'Bihar’s miraculous economic growth: Myth or reality?',
'subheading' => '',
'description' => '<p align="justify">
<br />
<font face="arial,helvetica,sans-serif" size="3">A section of the media seems to be mighty impressed with Bihar&rsquo;s miraculous (11.03%) average annual growth during the 2004-05 to 2008-09, supposedly akin to that of Gujarat (11.05%) but is there a catch in this stunning statistics? <em>(See the graph below)</em>. </font>
</p>
<p align="justify">
<font face="arial,helvetica,sans-serif" size="3">While the media has quoted the Gross State Domestic Product at factor cost (at constant 1999-2000 prices) as provided by the Central Statistical Organization (CSO), but the corresponding GSDP figures for Gujarat have yet to arrive. And hence, it will be a mistake to compare the average annual growth rate of Bihar from 2004-05 to 2008-09 with the average annual growth rate of Gujarat from 2004-05 to 2007-08. Besides, Bihar figures pertain to a much lower base of previous years. (The CSO does not generate data but merely reissues figures provided by the states.)&nbsp; </font>
</p>
<p align="justify">
<font face="arial,helvetica,sans-serif" size="3"><br />
The National Human Development Report 2001 of the Planning Commission shows that Bihar comes at the bottom of the Human Development Index (HDI) among the 15 states which were studied. Bihar's HDI (0.367) comes below the HDI of Madhya Pradesh (0.394, Rank: 12), Orissa (0.404, Rank: 11) and Rajasthan (0.424, Rank: 9). Bihar is way below the average national HDI (0.472). This, obviously, strengthens the case for looking at the discrepancy between GSDP growth rate and actual development on the ground. For instance we can&rsquo;t forget that about half the population of Bihar figures below the poverty line and over 56 per cent of Bihar&rsquo;s children below the age of three years are underweight. </font>
</p>
<p align="justify">
<font face="arial,helvetica,sans-serif" size="3">Even on the statistics front, there are other states too who's GSDP at factor cost (at 1999-2000 prices) data for the year 2008-09 is yet to arrive. Some of them are: Madhya Pradesh, Maharastra, West Bengal etc. From a research point of view, it is not proper to compare Bihar with any other state in the absence of corresponding data. </font>
</p>
<p align="justify">
<font face="arial,helvetica,sans-serif" size="3">Instead of taking the period 2004-05 to 2008-09, if the period 1999-2000 and 2008-09 is considered, then Bihar's average annual growth rate falls down from 11.03% to 8.13%. Similarly, if the period for growth calculation is changed, then Gujarat's average annual growth rate reduces from 11.05% to 8.83% and India's average annual growth rate reduces from 8.49% to 7.09%. </font>
</p>
<p align="justify">
<font face="arial,helvetica,sans-serif" size="3">If we look at the various components of Bihar's GSDP (at 1999-2000 prices), we get some alarming results. Agriculture and allied activities' economic progress have been dismal in the recent years. This means that the state&rsquo;s shrinking agriculture sector, on which about 80 per cent of the state&rsquo;s population depends for livelihood, continues to stagnate. During 2005-06, the growth experienced by this sector was (-) 10.82 percent, while during 2007-08 it was (-) 8.72%. For the same years, industry in Bihar grew by 28.26% and 17.83% whereas services grew by 3.09% and 14.73%, respectively. The percentage share of Agriculture and Allied activities in the entire GSDP at factor cost (at 1999-2000 constant prices) has declined from 38.8% in 2000-01 to 26.2% in 2008-09. </font>
</p>
<p align="justify">
<br />
<font face="arial,helvetica,sans-serif" size="3">The average annual growth rate of GSDP from construction (at 1999-2000 prices) between 2004-05 and 2008-09 was 36.16%. If the period is changed to between 1999-2000 and 2008-09, then the average annual growth rate of GSDP from construction turns out to be 24.44%. The percentage share of construction in the overall GSDP of Bihar has increased from 3.8% in 1999-2000 to 12.6% in 2008-09. </font>
</p>
<p align="justify">
<font face="arial,helvetica,sans-serif" size="3">The percentage share of Banking and Insurance in the entire GSDP of Bihar has more or less remained the same over the years. This sector plays a crucial role in industrial growth. We find that the percentage share of GSDP from registered manufacturing in the total GSDP of Bihar to be falling from 2.3% in 1999-2000 to 0.7% in 2008-09. The average annual growth rate of registered manufacturing GSDP during the period 2004-05 to 2008-09 has been merely 4.06%, which is much lesser than the average annual growth rate of GSDP from Agriculture and allied activities during the same period, i.e. 7.29%.&nbsp;&nbsp;&nbsp; </font>
</p>
<p align="justify">
<font face="arial,helvetica,sans-serif" size="3">The annual average growth of GSDP from unregistered manufacturing during the period 2004-05 to 2008-09 was 8.12%. The percentage share of GSDP from unregistered manufacturing in the total GSDP of Bihar has declined from 4.9% in 1999-2000 to 4.0% in 2008-09.</font>
</p>
<p align="justify">
<font face="arial,helvetica,sans-serif" size="3">The percentage share of Public Administration in the GSDP of Bihar has been declining overtime. </font>
</p>
<p align="justify">
<font face="arial,helvetica,sans-serif" size="3"><strong>Graph 1: Economic growth faced by Bihar, Gujarat and India in different years</strong></font>
</p>
<p align="justify">
<font face="arial,helvetica,sans-serif" size="3"><img style="width: 652px; height: 311px" src="tinymce/uploaded/Bihar eco gr.bmp" alt="Bihar eco gr" width="978" height="453" /><br />
<em><strong>Source: </strong></em></font><a href="http://www.mospi.nic.in/"><font face="arial,helvetica,sans-serif" size="3"><em>www.mospi.nic.in</em></font></a><font face="arial,helvetica,sans-serif" size="3"><em> </em></font>
</p>
<p align="justify">
<br />
<font face="arial,helvetica,sans-serif" size="3"><em>Further readings: </em></font>
</p>
<p align="justify">
<font face="arial,helvetica,sans-serif" size="3">GSDP data of various states of India,<br />
</font><a href="http://www.mospi.nic.in/State-wise_SDP_1999-2000_20nov09.pdf"><font face="arial,helvetica,sans-serif" size="3">http://www.mospi.nic.in/State-wise_SDP_1999-2000_20nov09.pdf</font></a><font face="arial,helvetica,sans-serif" size="3"> </font>
</p>
<p align="justify">
<font face="arial,helvetica,sans-serif" size="3">Economic Survey of Bihar 2008-09, Government of Bihar<br />
</font><a href="http://www.indiaenvironmentportal.org.in/files/ESR-2008-09-EN.pdf"><font face="arial,helvetica,sans-serif" size="3">http://www.indiaenvironmentportal.org.in/files/ESR-2008-09-EN.pdf</font></a>
</p>
<p align="justify">
<font face="arial,helvetica,sans-serif" size="3">National Human Development Report 2001, Planning Commission,<br />
</font><a href="../docs/nhd2001.pdf"><font face="arial,helvetica,sans-serif" size="3">http://www.im4change.org/docs/nhd2001.pdf</font></a><br />
<font face="arial,helvetica,sans-serif" size="3">&nbsp;<br />
Bihar&rsquo;s miracle: growth rate at 11.03 p.c., The Hindu, 3 January, 2010,<br />
</font><a href="http://beta.thehindu.com/news/states/other-states/article74958.ece"><font face="arial,helvetica,sans-serif" size="3">http://beta.thehindu.com/news/states/other-states/article74958.ece</font></a><font face="arial,helvetica,sans-serif" size="3"> </font>
</p>
<p align="justify">
<font face="arial,helvetica,sans-serif" size="3">Road to development, The Business Standard, 6 January, 2010, </font><a href="http://www.business-standard.com/india/news/road-to-development/381731/"><font face="arial,helvetica,sans-serif" size="3">http://www.business-standard.com/india/news/road-to-development/381731/</font></a><font face="arial,helvetica,sans-serif" size="3"> <br />
&nbsp;<br />
Hope for poor states, The Economic Times, 5 January, 2010,<br />
</font><a href="http://economictimes.indiatimes.com/opinion/editorial/Hope-for-poor-states/articleshow/5411079.cms"><font face="arial,helvetica,sans-serif" size="3">http://economictimes.indiatimes.com/opinion/editorial/Hope-for-poor-states/articleshow/5411079.cms</font></a><font face="arial,helvetica,sans-serif" size="3">&nbsp; <br />
&nbsp;<br />
New miracle economies: Bihar, poor states by SA Aiyar, The Times of India, 3 Jauary, 2010, </font><a href="http://blogs.timesofindia.indiatimes.com/Swaminomics/entry/new-miracle-economies-bihar-poor"><font face="arial,helvetica,sans-serif" size="3">http://blogs.timesofindia.indiatimes.com/Swaminomics/entry/new-miracle-economies-bihar-poor</font></a><font face="arial,helvetica,sans-serif" size="3">&nbsp; <br />
&nbsp;<br />
Bihar grew by 11.03%, next only to Gujarat, The Times of India, 3 January, 2010,</font>
</p>
<p align="justify">
<a href="http://timesofindia.indiatimes.com/biz/india-business/Bihar-grew-by-1103-next-only-to-Gujarat/articleshow/5405973.cms"><font face="arial,helvetica,sans-serif" size="3">http://timesofindia.indiatimes.com/biz/india-business/Bihar-grew-by-1103-next-only-to-Gujarat/articleshow/5405973.cms</font></a><font face="arial,helvetica,sans-serif" size="3">&nbsp; </font>
</p>
<p align="justify">
<font face="arial,helvetica,sans-serif" size="3">Mind The Shadows by Lola Nayar, Outlook India,<br />
</font><a href="http://www.outlookindia.com/article.aspx?263643"><font face="arial,helvetica,sans-serif" size="3">http://www.outlookindia.com/article.aspx?263643</font></a><br />
<font face="arial,helvetica,sans-serif" size="3">&nbsp;<br />
Bihar, a growth story by Raj Kumar, The Times of India, 11 January, 2010,</font>
</p>
<p align="justify">
<a href="http://timesofindia.indiatimes.com/home/sunday-toi/special-report/Bihar-a-growth-story/articleshow/5428960.cms"><font face="arial,helvetica,sans-serif" size="3">http://timesofindia.indiatimes.com/home/sunday-toi/special-report/Bihar-a-growth-story/articleshow/5428960.cms</font></a><font face="arial,helvetica,sans-serif" size="3">&nbsp; <br />
&nbsp;<br />
How Bihar can rise as a developed state by Kailash Nautiyal, Rediff.com,</font>
</p>
<p align="justify">
<a href="http://business.rediff.com/slide-show/2010/jan/04/slide-show-1-how-bihar-can-rise-as-a-developed-state.htm#contentTop"><font face="arial,helvetica,sans-serif" size="3">http://business.rediff.com/slide-show/2010/jan/04/slide-show-1-how-bihar-can-rise-as-a-developed-state.htm#contentTop</font></a><font face="arial,helvetica,sans-serif" size="3">&nbsp; <br />
&nbsp;</font>
</p>
',
'credit_writer' => '',
'article_img' => '',
'article_img_thumb' => '',
'status' => (int) 1,
'show_on_home' => (int) 1,
'lang' => 'EN',
'category_id' => (int) 15,
'tag_keyword' => '',
'seo_url' => 'bihars-miraculous-economic-growth-myth-or-reality-1017',
'meta_title' => null,
'meta_keywords' => null,
'meta_description' => null,
'noindex' => (int) 0,
'publish_date' => object(Cake\I18n\FrozenDate) {},
'most_visit_section_id' => null,
'article_big_img' => null,
'liveid' => (int) 1017,
'created' => object(Cake\I18n\FrozenTime) {},
'modified' => object(Cake\I18n\FrozenTime) {},
'edate' => '',
'tags' => [[maximum depth reached]],
'category' => object(App\Model\Entity\Category) {},
'[new]' => false,
'[accessible]' => [
[maximum depth reached]
],
'[dirty]' => [[maximum depth reached]],
'[original]' => [[maximum depth reached]],
'[virtual]' => [[maximum depth reached]],
'[hasErrors]' => false,
'[errors]' => [[maximum depth reached]],
'[invalid]' => [[maximum depth reached]],
'[repository]' => 'Articles'
},
'articleid' => (int) 943,
'metaTitle' => 'News Alerts | Bihar’s miraculous economic growth: Myth or reality?',
'metaKeywords' => null,
'metaDesc' => '
A section of the media seems to be mighty impressed with Bihar&rsquo;s miraculous (11.03%) average annual growth during the 2004-05 to 2008-09, supposedly akin to that of Gujarat (11.05%) but is there a catch in this stunning statistics? (See the...',
'disp' => '<p align="justify"><br /><font >A section of the media seems to be mighty impressed with Bihar&rsquo;s miraculous (11.03%) average annual growth during the 2004-05 to 2008-09, supposedly akin to that of Gujarat (11.05%) but is there a catch in this stunning statistics? <em>(See the graph below)</em>. </font></p><p align="justify"><font >While the media has quoted the Gross State Domestic Product at factor cost (at constant 1999-2000 prices) as provided by the Central Statistical Organization (CSO), but the corresponding GSDP figures for Gujarat have yet to arrive. And hence, it will be a mistake to compare the average annual growth rate of Bihar from 2004-05 to 2008-09 with the average annual growth rate of Gujarat from 2004-05 to 2007-08. Besides, Bihar figures pertain to a much lower base of previous years. (The CSO does not generate data but merely reissues figures provided by the states.)&nbsp; </font></p><p align="justify"><font ><br />The National Human Development Report 2001 of the Planning Commission shows that Bihar comes at the bottom of the Human Development Index (HDI) among the 15 states which were studied. Bihar's HDI (0.367) comes below the HDI of Madhya Pradesh (0.394, Rank: 12), Orissa (0.404, Rank: 11) and Rajasthan (0.424, Rank: 9). Bihar is way below the average national HDI (0.472). This, obviously, strengthens the case for looking at the discrepancy between GSDP growth rate and actual development on the ground. For instance we can&rsquo;t forget that about half the population of Bihar figures below the poverty line and over 56 per cent of Bihar&rsquo;s children below the age of three years are underweight. </font></p><p align="justify"><font >Even on the statistics front, there are other states too who's GSDP at factor cost (at 1999-2000 prices) data for the year 2008-09 is yet to arrive. Some of them are: Madhya Pradesh, Maharastra, West Bengal etc. From a research point of view, it is not proper to compare Bihar with any other state in the absence of corresponding data. </font></p><p align="justify"><font >Instead of taking the period 2004-05 to 2008-09, if the period 1999-2000 and 2008-09 is considered, then Bihar's average annual growth rate falls down from 11.03% to 8.13%. Similarly, if the period for growth calculation is changed, then Gujarat's average annual growth rate reduces from 11.05% to 8.83% and India's average annual growth rate reduces from 8.49% to 7.09%. </font></p><p align="justify"><font >If we look at the various components of Bihar's GSDP (at 1999-2000 prices), we get some alarming results. Agriculture and allied activities' economic progress have been dismal in the recent years. This means that the state&rsquo;s shrinking agriculture sector, on which about 80 per cent of the state&rsquo;s population depends for livelihood, continues to stagnate. During 2005-06, the growth experienced by this sector was (-) 10.82 percent, while during 2007-08 it was (-) 8.72%. For the same years, industry in Bihar grew by 28.26% and 17.83% whereas services grew by 3.09% and 14.73%, respectively. The percentage share of Agriculture and Allied activities in the entire GSDP at factor cost (at 1999-2000 constant prices) has declined from 38.8% in 2000-01 to 26.2% in 2008-09. </font></p><p align="justify"><br /><font >The average annual growth rate of GSDP from construction (at 1999-2000 prices) between 2004-05 and 2008-09 was 36.16%. If the period is changed to between 1999-2000 and 2008-09, then the average annual growth rate of GSDP from construction turns out to be 24.44%. The percentage share of construction in the overall GSDP of Bihar has increased from 3.8% in 1999-2000 to 12.6% in 2008-09. </font></p><p align="justify"><font >The percentage share of Banking and Insurance in the entire GSDP of Bihar has more or less remained the same over the years. This sector plays a crucial role in industrial growth. We find that the percentage share of GSDP from registered manufacturing in the total GSDP of Bihar to be falling from 2.3% in 1999-2000 to 0.7% in 2008-09. The average annual growth rate of registered manufacturing GSDP during the period 2004-05 to 2008-09 has been merely 4.06%, which is much lesser than the average annual growth rate of GSDP from Agriculture and allied activities during the same period, i.e. 7.29%.&nbsp;&nbsp;&nbsp; </font></p><p align="justify"><font >The annual average growth of GSDP from unregistered manufacturing during the period 2004-05 to 2008-09 was 8.12%. The percentage share of GSDP from unregistered manufacturing in the total GSDP of Bihar has declined from 4.9% in 1999-2000 to 4.0% in 2008-09.</font> </p><p align="justify"><font >The percentage share of Public Administration in the GSDP of Bihar has been declining overtime. </font></p><p align="justify"><font ><strong>Graph 1: Economic growth faced by Bihar, Gujarat and India in different years</strong></font> </p><p align="justify"><font ><img style="width: 652px; height: 311px" src="https://im4change.in/siteadmin/tinymce/uploaded/Bihar eco gr.bmp" alt="Bihar eco gr" width="978" height="453" /><br /><em><strong>Source: </strong></em></font><a href="http://www.mospi.nic.in/" title="http://www.mospi.nic.in/">www.mospi.nic.in</a><font ><em> </em></font></p><p align="justify"><br /><font ><em>Further readings: </em></font></p><p align="justify"><font >GSDP data of various states of India,<br /></font><a href="http://www.mospi.nic.in/State-wise_SDP_1999-2000_20nov09.pdf" title="http://www.mospi.nic.in/State-wise_SDP_1999-2000_20nov09.pdf">http://www.mospi.nic.in/State-wise_SDP_1999-2000_20nov09.pdf</a><font > </font></p><p align="justify"><font >Economic Survey of Bihar 2008-09, Government of Bihar<br /></font><a href="http://www.indiaenvironmentportal.org.in/files/ESR-2008-09-EN.pdf" title="http://www.indiaenvironmentportal.org.in/files/ESR-2008-09-EN.pdf">http://www.indiaenvironmentportal.org.in/files/ESR-2008-09-EN.pdf</a> </p><p align="justify"><font >National Human Development Report 2001, Planning Commission,<br /></font><a href="https://im4change.in/docs/nhd2001.pdf" title="https://im4change.in/docs/nhd2001.pdf">http://www.im4change.org/docs/nhd2001.pdf</a><br /><font >&nbsp;<br />Bihar&rsquo;s miracle: growth rate at 11.03 p.c., The Hindu, 3 January, 2010,<br /></font><a href="http://beta.thehindu.com/news/states/other-states/article74958.ece" title="http://beta.thehindu.com/news/states/other-states/article74958.ece">http://beta.thehindu.com/news/states/other-states/article7<br />4958.ece</a><font > </font></p><p align="justify"><font >Road to development, The Business Standard, 6 January, 2010, </font><a href="http://www.business-standard.com/india/news/road-to-development/381731/" title="http://www.business-standard.com/india/news/road-to-development/381731/">http://www.business-standard.com/india/news/road-to-develo<br />pment/381731/</a><font > <br />&nbsp;<br />Hope for poor states, The Economic Times, 5 January, 2010,<br /></font><a href="http://economictimes.indiatimes.com/opinion/editorial/Hope-for-poor-states/articleshow/5411079.cms" title="http://economictimes.indiatimes.com/opinion/editorial/Hope-for-poor-states/articleshow/5411079.cms">http://economictimes.indiatimes.com/opinion/editorial/Hope<br />-for-poor-states/articleshow/5411079.cms</a><font >&nbsp; <br />&nbsp;<br />New miracle economies: Bihar, poor states by SA Aiyar, The Times of India, 3 Jauary, 2010, </font><a href="http://blogs.timesofindia.indiatimes.com/Swaminomics/entry/new-miracle-economies-bihar-poor" title="http://blogs.timesofindia.indiatimes.com/Swaminomics/entry/new-miracle-economies-bihar-poor">http://blogs.timesofindia.indiatimes.com/Swaminomics/entry<br />/new-miracle-economies-bihar-poor</a><font >&nbsp; <br />&nbsp;<br />Bihar grew by 11.03%, next only to Gujarat, The Times of India, 3 January, 2010,</font> </p><p align="justify"><a href="http://timesofindia.indiatimes.com/biz/india-business/Bihar-grew-by-1103-next-only-to-Gujarat/articleshow/5405973.cms" title="http://timesofindia.indiatimes.com/biz/india-business/Bihar-grew-by-1103-next-only-to-Gujarat/articleshow/5405973.cms">http://timesofindia.indiatimes.com/biz/india-business/Biha<br />r-grew-by-1103-next-only-to-Gujarat/articleshow/5405973.cm<br />s</a><font >&nbsp; </font></p><p align="justify"><font >Mind The Shadows by Lola Nayar, Outlook India,<br /></font><a href="http://www.outlookindia.com/article.aspx?263643" title="http://www.outlookindia.com/article.aspx?263643">http://www.outlookindia.com/article.aspx?263643</a><br /><font >&nbsp;<br />Bihar, a growth story by Raj Kumar, The Times of India, 11 January, 2010,</font> </p><p align="justify"><a href="http://timesofindia.indiatimes.com/home/sunday-toi/special-report/Bihar-a-growth-story/articleshow/5428960.cms" title="http://timesofindia.indiatimes.com/home/sunday-toi/special-report/Bihar-a-growth-story/articleshow/5428960.cms">http://timesofindia.indiatimes.com/home/sunday-toi/special<br />-report/Bihar-a-growth-story/articleshow/5428960.cms</a><font >&nbsp; <br />&nbsp;<br />How Bihar can rise as a developed state by Kailash Nautiyal, Rediff.com,</font> </p><p align="justify"><a href="http://business.rediff.com/slide-show/2010/jan/04/slide-show-1-how-bihar-can-rise-as-a-developed-state.htm#contentTop" title="http://business.rediff.com/slide-show/2010/jan/04/slide-show-1-how-bihar-can-rise-as-a-developed-state.htm#contentTop">http://business.rediff.com/slide-show/2010/jan/04/slide-sh<br />ow-1-how-bihar-can-rise-as-a-developed-state.htm#contentTo<br />p</a><font >&nbsp; <br />&nbsp;</font> </p>',
'lang' => 'English',
'SITE_URL' => 'https://im4change.in/',
'site_title' => 'im4change',
'adminprix' => 'admin'
]
$article_current = object(App\Model\Entity\Article) {
'id' => (int) 943,
'title' => 'Bihar’s miraculous economic growth: Myth or reality?',
'subheading' => '',
'description' => '<p align="justify">
<br />
<font face="arial,helvetica,sans-serif" size="3">A section of the media seems to be mighty impressed with Bihar&rsquo;s miraculous (11.03%) average annual growth during the 2004-05 to 2008-09, supposedly akin to that of Gujarat (11.05%) but is there a catch in this stunning statistics? <em>(See the graph below)</em>. </font>
</p>
<p align="justify">
<font face="arial,helvetica,sans-serif" size="3">While the media has quoted the Gross State Domestic Product at factor cost (at constant 1999-2000 prices) as provided by the Central Statistical Organization (CSO), but the corresponding GSDP figures for Gujarat have yet to arrive. And hence, it will be a mistake to compare the average annual growth rate of Bihar from 2004-05 to 2008-09 with the average annual growth rate of Gujarat from 2004-05 to 2007-08. Besides, Bihar figures pertain to a much lower base of previous years. (The CSO does not generate data but merely reissues figures provided by the states.)&nbsp; </font>
</p>
<p align="justify">
<font face="arial,helvetica,sans-serif" size="3"><br />
The National Human Development Report 2001 of the Planning Commission shows that Bihar comes at the bottom of the Human Development Index (HDI) among the 15 states which were studied. Bihar's HDI (0.367) comes below the HDI of Madhya Pradesh (0.394, Rank: 12), Orissa (0.404, Rank: 11) and Rajasthan (0.424, Rank: 9). Bihar is way below the average national HDI (0.472). This, obviously, strengthens the case for looking at the discrepancy between GSDP growth rate and actual development on the ground. For instance we can&rsquo;t forget that about half the population of Bihar figures below the poverty line and over 56 per cent of Bihar&rsquo;s children below the age of three years are underweight. </font>
</p>
<p align="justify">
<font face="arial,helvetica,sans-serif" size="3">Even on the statistics front, there are other states too who's GSDP at factor cost (at 1999-2000 prices) data for the year 2008-09 is yet to arrive. Some of them are: Madhya Pradesh, Maharastra, West Bengal etc. From a research point of view, it is not proper to compare Bihar with any other state in the absence of corresponding data. </font>
</p>
<p align="justify">
<font face="arial,helvetica,sans-serif" size="3">Instead of taking the period 2004-05 to 2008-09, if the period 1999-2000 and 2008-09 is considered, then Bihar's average annual growth rate falls down from 11.03% to 8.13%. Similarly, if the period for growth calculation is changed, then Gujarat's average annual growth rate reduces from 11.05% to 8.83% and India's average annual growth rate reduces from 8.49% to 7.09%. </font>
</p>
<p align="justify">
<font face="arial,helvetica,sans-serif" size="3">If we look at the various components of Bihar's GSDP (at 1999-2000 prices), we get some alarming results. Agriculture and allied activities' economic progress have been dismal in the recent years. This means that the state&rsquo;s shrinking agriculture sector, on which about 80 per cent of the state&rsquo;s population depends for livelihood, continues to stagnate. During 2005-06, the growth experienced by this sector was (-) 10.82 percent, while during 2007-08 it was (-) 8.72%. For the same years, industry in Bihar grew by 28.26% and 17.83% whereas services grew by 3.09% and 14.73%, respectively. The percentage share of Agriculture and Allied activities in the entire GSDP at factor cost (at 1999-2000 constant prices) has declined from 38.8% in 2000-01 to 26.2% in 2008-09. </font>
</p>
<p align="justify">
<br />
<font face="arial,helvetica,sans-serif" size="3">The average annual growth rate of GSDP from construction (at 1999-2000 prices) between 2004-05 and 2008-09 was 36.16%. If the period is changed to between 1999-2000 and 2008-09, then the average annual growth rate of GSDP from construction turns out to be 24.44%. The percentage share of construction in the overall GSDP of Bihar has increased from 3.8% in 1999-2000 to 12.6% in 2008-09. </font>
</p>
<p align="justify">
<font face="arial,helvetica,sans-serif" size="3">The percentage share of Banking and Insurance in the entire GSDP of Bihar has more or less remained the same over the years. This sector plays a crucial role in industrial growth. We find that the percentage share of GSDP from registered manufacturing in the total GSDP of Bihar to be falling from 2.3% in 1999-2000 to 0.7% in 2008-09. The average annual growth rate of registered manufacturing GSDP during the period 2004-05 to 2008-09 has been merely 4.06%, which is much lesser than the average annual growth rate of GSDP from Agriculture and allied activities during the same period, i.e. 7.29%.&nbsp;&nbsp;&nbsp; </font>
</p>
<p align="justify">
<font face="arial,helvetica,sans-serif" size="3">The annual average growth of GSDP from unregistered manufacturing during the period 2004-05 to 2008-09 was 8.12%. The percentage share of GSDP from unregistered manufacturing in the total GSDP of Bihar has declined from 4.9% in 1999-2000 to 4.0% in 2008-09.</font>
</p>
<p align="justify">
<font face="arial,helvetica,sans-serif" size="3">The percentage share of Public Administration in the GSDP of Bihar has been declining overtime. </font>
</p>
<p align="justify">
<font face="arial,helvetica,sans-serif" size="3"><strong>Graph 1: Economic growth faced by Bihar, Gujarat and India in different years</strong></font>
</p>
<p align="justify">
<font face="arial,helvetica,sans-serif" size="3"><img style="width: 652px; height: 311px" src="tinymce/uploaded/Bihar eco gr.bmp" alt="Bihar eco gr" width="978" height="453" /><br />
<em><strong>Source: </strong></em></font><a href="http://www.mospi.nic.in/"><font face="arial,helvetica,sans-serif" size="3"><em>www.mospi.nic.in</em></font></a><font face="arial,helvetica,sans-serif" size="3"><em> </em></font>
</p>
<p align="justify">
<br />
<font face="arial,helvetica,sans-serif" size="3"><em>Further readings: </em></font>
</p>
<p align="justify">
<font face="arial,helvetica,sans-serif" size="3">GSDP data of various states of India,<br />
</font><a href="http://www.mospi.nic.in/State-wise_SDP_1999-2000_20nov09.pdf"><font face="arial,helvetica,sans-serif" size="3">http://www.mospi.nic.in/State-wise_SDP_1999-2000_20nov09.pdf</font></a><font face="arial,helvetica,sans-serif" size="3"> </font>
</p>
<p align="justify">
<font face="arial,helvetica,sans-serif" size="3">Economic Survey of Bihar 2008-09, Government of Bihar<br />
</font><a href="http://www.indiaenvironmentportal.org.in/files/ESR-2008-09-EN.pdf"><font face="arial,helvetica,sans-serif" size="3">http://www.indiaenvironmentportal.org.in/files/ESR-2008-09-EN.pdf</font></a>
</p>
<p align="justify">
<font face="arial,helvetica,sans-serif" size="3">National Human Development Report 2001, Planning Commission,<br />
</font><a href="../docs/nhd2001.pdf"><font face="arial,helvetica,sans-serif" size="3">http://www.im4change.org/docs/nhd2001.pdf</font></a><br />
<font face="arial,helvetica,sans-serif" size="3">&nbsp;<br />
Bihar&rsquo;s miracle: growth rate at 11.03 p.c., The Hindu, 3 January, 2010,<br />
</font><a href="http://beta.thehindu.com/news/states/other-states/article74958.ece"><font face="arial,helvetica,sans-serif" size="3">http://beta.thehindu.com/news/states/other-states/article74958.ece</font></a><font face="arial,helvetica,sans-serif" size="3"> </font>
</p>
<p align="justify">
<font face="arial,helvetica,sans-serif" size="3">Road to development, The Business Standard, 6 January, 2010, </font><a href="http://www.business-standard.com/india/news/road-to-development/381731/"><font face="arial,helvetica,sans-serif" size="3">http://www.business-standard.com/india/news/road-to-development/381731/</font></a><font face="arial,helvetica,sans-serif" size="3"> <br />
&nbsp;<br />
Hope for poor states, The Economic Times, 5 January, 2010,<br />
</font><a href="http://economictimes.indiatimes.com/opinion/editorial/Hope-for-poor-states/articleshow/5411079.cms"><font face="arial,helvetica,sans-serif" size="3">http://economictimes.indiatimes.com/opinion/editorial/Hope-for-poor-states/articleshow/5411079.cms</font></a><font face="arial,helvetica,sans-serif" size="3">&nbsp; <br />
&nbsp;<br />
New miracle economies: Bihar, poor states by SA Aiyar, The Times of India, 3 Jauary, 2010, </font><a href="http://blogs.timesofindia.indiatimes.com/Swaminomics/entry/new-miracle-economies-bihar-poor"><font face="arial,helvetica,sans-serif" size="3">http://blogs.timesofindia.indiatimes.com/Swaminomics/entry/new-miracle-economies-bihar-poor</font></a><font face="arial,helvetica,sans-serif" size="3">&nbsp; <br />
&nbsp;<br />
Bihar grew by 11.03%, next only to Gujarat, The Times of India, 3 January, 2010,</font>
</p>
<p align="justify">
<a href="http://timesofindia.indiatimes.com/biz/india-business/Bihar-grew-by-1103-next-only-to-Gujarat/articleshow/5405973.cms"><font face="arial,helvetica,sans-serif" size="3">http://timesofindia.indiatimes.com/biz/india-business/Bihar-grew-by-1103-next-only-to-Gujarat/articleshow/5405973.cms</font></a><font face="arial,helvetica,sans-serif" size="3">&nbsp; </font>
</p>
<p align="justify">
<font face="arial,helvetica,sans-serif" size="3">Mind The Shadows by Lola Nayar, Outlook India,<br />
</font><a href="http://www.outlookindia.com/article.aspx?263643"><font face="arial,helvetica,sans-serif" size="3">http://www.outlookindia.com/article.aspx?263643</font></a><br />
<font face="arial,helvetica,sans-serif" size="3">&nbsp;<br />
Bihar, a growth story by Raj Kumar, The Times of India, 11 January, 2010,</font>
</p>
<p align="justify">
<a href="http://timesofindia.indiatimes.com/home/sunday-toi/special-report/Bihar-a-growth-story/articleshow/5428960.cms"><font face="arial,helvetica,sans-serif" size="3">http://timesofindia.indiatimes.com/home/sunday-toi/special-report/Bihar-a-growth-story/articleshow/5428960.cms</font></a><font face="arial,helvetica,sans-serif" size="3">&nbsp; <br />
&nbsp;<br />
How Bihar can rise as a developed state by Kailash Nautiyal, Rediff.com,</font>
</p>
<p align="justify">
<a href="http://business.rediff.com/slide-show/2010/jan/04/slide-show-1-how-bihar-can-rise-as-a-developed-state.htm#contentTop"><font face="arial,helvetica,sans-serif" size="3">http://business.rediff.com/slide-show/2010/jan/04/slide-show-1-how-bihar-can-rise-as-a-developed-state.htm#contentTop</font></a><font face="arial,helvetica,sans-serif" size="3">&nbsp; <br />
&nbsp;</font>
</p>
',
'credit_writer' => '',
'article_img' => '',
'article_img_thumb' => '',
'status' => (int) 1,
'show_on_home' => (int) 1,
'lang' => 'EN',
'category_id' => (int) 15,
'tag_keyword' => '',
'seo_url' => 'bihars-miraculous-economic-growth-myth-or-reality-1017',
'meta_title' => null,
'meta_keywords' => null,
'meta_description' => null,
'noindex' => (int) 0,
'publish_date' => object(Cake\I18n\FrozenDate) {},
'most_visit_section_id' => null,
'article_big_img' => null,
'liveid' => (int) 1017,
'created' => object(Cake\I18n\FrozenTime) {},
'modified' => object(Cake\I18n\FrozenTime) {},
'edate' => '',
'tags' => [],
'category' => object(App\Model\Entity\Category) {},
'[new]' => false,
'[accessible]' => [
'*' => true,
'id' => false
],
'[dirty]' => [],
'[original]' => [],
'[virtual]' => [],
'[hasErrors]' => false,
'[errors]' => [],
'[invalid]' => [],
'[repository]' => 'Articles'
}
$articleid = (int) 943
$metaTitle = 'News Alerts | Bihar’s miraculous economic growth: Myth or reality?'
$metaKeywords = null
$metaDesc = '
A section of the media seems to be mighty impressed with Bihar&rsquo;s miraculous (11.03%) average annual growth during the 2004-05 to 2008-09, supposedly akin to that of Gujarat (11.05%) but is there a catch in this stunning statistics? (See the...'
$disp = '<p align="justify"><br /><font >A section of the media seems to be mighty impressed with Bihar&rsquo;s miraculous (11.03%) average annual growth during the 2004-05 to 2008-09, supposedly akin to that of Gujarat (11.05%) but is there a catch in this stunning statistics? <em>(See the graph below)</em>. </font></p><p align="justify"><font >While the media has quoted the Gross State Domestic Product at factor cost (at constant 1999-2000 prices) as provided by the Central Statistical Organization (CSO), but the corresponding GSDP figures for Gujarat have yet to arrive. And hence, it will be a mistake to compare the average annual growth rate of Bihar from 2004-05 to 2008-09 with the average annual growth rate of Gujarat from 2004-05 to 2007-08. Besides, Bihar figures pertain to a much lower base of previous years. (The CSO does not generate data but merely reissues figures provided by the states.)&nbsp; </font></p><p align="justify"><font ><br />The National Human Development Report 2001 of the Planning Commission shows that Bihar comes at the bottom of the Human Development Index (HDI) among the 15 states which were studied. Bihar's HDI (0.367) comes below the HDI of Madhya Pradesh (0.394, Rank: 12), Orissa (0.404, Rank: 11) and Rajasthan (0.424, Rank: 9). Bihar is way below the average national HDI (0.472). This, obviously, strengthens the case for looking at the discrepancy between GSDP growth rate and actual development on the ground. For instance we can&rsquo;t forget that about half the population of Bihar figures below the poverty line and over 56 per cent of Bihar&rsquo;s children below the age of three years are underweight. </font></p><p align="justify"><font >Even on the statistics front, there are other states too who's GSDP at factor cost (at 1999-2000 prices) data for the year 2008-09 is yet to arrive. Some of them are: Madhya Pradesh, Maharastra, West Bengal etc. From a research point of view, it is not proper to compare Bihar with any other state in the absence of corresponding data. </font></p><p align="justify"><font >Instead of taking the period 2004-05 to 2008-09, if the period 1999-2000 and 2008-09 is considered, then Bihar's average annual growth rate falls down from 11.03% to 8.13%. Similarly, if the period for growth calculation is changed, then Gujarat's average annual growth rate reduces from 11.05% to 8.83% and India's average annual growth rate reduces from 8.49% to 7.09%. </font></p><p align="justify"><font >If we look at the various components of Bihar's GSDP (at 1999-2000 prices), we get some alarming results. Agriculture and allied activities' economic progress have been dismal in the recent years. This means that the state&rsquo;s shrinking agriculture sector, on which about 80 per cent of the state&rsquo;s population depends for livelihood, continues to stagnate. During 2005-06, the growth experienced by this sector was (-) 10.82 percent, while during 2007-08 it was (-) 8.72%. For the same years, industry in Bihar grew by 28.26% and 17.83% whereas services grew by 3.09% and 14.73%, respectively. The percentage share of Agriculture and Allied activities in the entire GSDP at factor cost (at 1999-2000 constant prices) has declined from 38.8% in 2000-01 to 26.2% in 2008-09. </font></p><p align="justify"><br /><font >The average annual growth rate of GSDP from construction (at 1999-2000 prices) between 2004-05 and 2008-09 was 36.16%. If the period is changed to between 1999-2000 and 2008-09, then the average annual growth rate of GSDP from construction turns out to be 24.44%. The percentage share of construction in the overall GSDP of Bihar has increased from 3.8% in 1999-2000 to 12.6% in 2008-09. </font></p><p align="justify"><font >The percentage share of Banking and Insurance in the entire GSDP of Bihar has more or less remained the same over the years. This sector plays a crucial role in industrial growth. We find that the percentage share of GSDP from registered manufacturing in the total GSDP of Bihar to be falling from 2.3% in 1999-2000 to 0.7% in 2008-09. The average annual growth rate of registered manufacturing GSDP during the period 2004-05 to 2008-09 has been merely 4.06%, which is much lesser than the average annual growth rate of GSDP from Agriculture and allied activities during the same period, i.e. 7.29%.&nbsp;&nbsp;&nbsp; </font></p><p align="justify"><font >The annual average growth of GSDP from unregistered manufacturing during the period 2004-05 to 2008-09 was 8.12%. The percentage share of GSDP from unregistered manufacturing in the total GSDP of Bihar has declined from 4.9% in 1999-2000 to 4.0% in 2008-09.</font> </p><p align="justify"><font >The percentage share of Public Administration in the GSDP of Bihar has been declining overtime. </font></p><p align="justify"><font ><strong>Graph 1: Economic growth faced by Bihar, Gujarat and India in different years</strong></font> </p><p align="justify"><font ><img style="width: 652px; height: 311px" src="https://im4change.in/siteadmin/tinymce/uploaded/Bihar eco gr.bmp" alt="Bihar eco gr" width="978" height="453" /><br /><em><strong>Source: </strong></em></font><a href="http://www.mospi.nic.in/" title="http://www.mospi.nic.in/">www.mospi.nic.in</a><font ><em> </em></font></p><p align="justify"><br /><font ><em>Further readings: </em></font></p><p align="justify"><font >GSDP data of various states of India,<br /></font><a href="http://www.mospi.nic.in/State-wise_SDP_1999-2000_20nov09.pdf" title="http://www.mospi.nic.in/State-wise_SDP_1999-2000_20nov09.pdf">http://www.mospi.nic.in/State-wise_SDP_1999-2000_20nov09.pdf</a><font > </font></p><p align="justify"><font >Economic Survey of Bihar 2008-09, Government of Bihar<br /></font><a href="http://www.indiaenvironmentportal.org.in/files/ESR-2008-09-EN.pdf" title="http://www.indiaenvironmentportal.org.in/files/ESR-2008-09-EN.pdf">http://www.indiaenvironmentportal.org.in/files/ESR-2008-09-EN.pdf</a> </p><p align="justify"><font >National Human Development Report 2001, Planning Commission,<br /></font><a href="https://im4change.in/docs/nhd2001.pdf" title="https://im4change.in/docs/nhd2001.pdf">http://www.im4change.org/docs/nhd2001.pdf</a><br /><font >&nbsp;<br />Bihar&rsquo;s miracle: growth rate at 11.03 p.c., The Hindu, 3 January, 2010,<br /></font><a href="http://beta.thehindu.com/news/states/other-states/article74958.ece" title="http://beta.thehindu.com/news/states/other-states/article74958.ece">http://beta.thehindu.com/news/states/other-states/article7<br />4958.ece</a><font > </font></p><p align="justify"><font >Road to development, The Business Standard, 6 January, 2010, </font><a href="http://www.business-standard.com/india/news/road-to-development/381731/" title="http://www.business-standard.com/india/news/road-to-development/381731/">http://www.business-standard.com/india/news/road-to-develo<br />pment/381731/</a><font > <br />&nbsp;<br />Hope for poor states, The Economic Times, 5 January, 2010,<br /></font><a href="http://economictimes.indiatimes.com/opinion/editorial/Hope-for-poor-states/articleshow/5411079.cms" title="http://economictimes.indiatimes.com/opinion/editorial/Hope-for-poor-states/articleshow/5411079.cms">http://economictimes.indiatimes.com/opinion/editorial/Hope<br />-for-poor-states/articleshow/5411079.cms</a><font >&nbsp; <br />&nbsp;<br />New miracle economies: Bihar, poor states by SA Aiyar, The Times of India, 3 Jauary, 2010, </font><a href="http://blogs.timesofindia.indiatimes.com/Swaminomics/entry/new-miracle-economies-bihar-poor" title="http://blogs.timesofindia.indiatimes.com/Swaminomics/entry/new-miracle-economies-bihar-poor">http://blogs.timesofindia.indiatimes.com/Swaminomics/entry<br />/new-miracle-economies-bihar-poor</a><font >&nbsp; <br />&nbsp;<br />Bihar grew by 11.03%, next only to Gujarat, The Times of India, 3 January, 2010,</font> </p><p align="justify"><a href="http://timesofindia.indiatimes.com/biz/india-business/Bihar-grew-by-1103-next-only-to-Gujarat/articleshow/5405973.cms" title="http://timesofindia.indiatimes.com/biz/india-business/Bihar-grew-by-1103-next-only-to-Gujarat/articleshow/5405973.cms">http://timesofindia.indiatimes.com/biz/india-business/Biha<br />r-grew-by-1103-next-only-to-Gujarat/articleshow/5405973.cm<br />s</a><font >&nbsp; </font></p><p align="justify"><font >Mind The Shadows by Lola Nayar, Outlook India,<br /></font><a href="http://www.outlookindia.com/article.aspx?263643" title="http://www.outlookindia.com/article.aspx?263643">http://www.outlookindia.com/article.aspx?263643</a><br /><font >&nbsp;<br />Bihar, a growth story by Raj Kumar, The Times of India, 11 January, 2010,</font> </p><p align="justify"><a href="http://timesofindia.indiatimes.com/home/sunday-toi/special-report/Bihar-a-growth-story/articleshow/5428960.cms" title="http://timesofindia.indiatimes.com/home/sunday-toi/special-report/Bihar-a-growth-story/articleshow/5428960.cms">http://timesofindia.indiatimes.com/home/sunday-toi/special<br />-report/Bihar-a-growth-story/articleshow/5428960.cms</a><font >&nbsp; <br />&nbsp;<br />How Bihar can rise as a developed state by Kailash Nautiyal, Rediff.com,</font> </p><p align="justify"><a href="http://business.rediff.com/slide-show/2010/jan/04/slide-show-1-how-bihar-can-rise-as-a-developed-state.htm#contentTop" title="http://business.rediff.com/slide-show/2010/jan/04/slide-show-1-how-bihar-can-rise-as-a-developed-state.htm#contentTop">http://business.rediff.com/slide-show/2010/jan/04/slide-sh<br />ow-1-how-bihar-can-rise-as-a-developed-state.htm#contentTo<br />p</a><font >&nbsp; <br />&nbsp;</font> </p>'
$lang = 'English'
$SITE_URL = 'https://im4change.in/'
$site_title = 'im4change'
$adminprix = 'admin'</pre><pre class="stack-trace">include - APP/Template/Layout/printlayout.ctp, line 8
Cake\View\View::_evaluate() - CORE/src/View/View.php, line 1413
Cake\View\View::_render() - CORE/src/View/View.php, line 1374
Cake\View\View::renderLayout() - CORE/src/View/View.php, line 927
Cake\View\View::render() - CORE/src/View/View.php, line 885
Cake\Controller\Controller::render() - CORE/src/Controller/Controller.php, line 791
Cake\Http\ActionDispatcher::_invoke() - CORE/src/Http/ActionDispatcher.php, line 126
Cake\Http\ActionDispatcher::dispatch() - CORE/src/Http/ActionDispatcher.php, line 94
Cake\Http\BaseApplication::__invoke() - CORE/src/Http/BaseApplication.php, line 235
Cake\Http\Runner::__invoke() - CORE/src/Http/Runner.php, line 65
Cake\Routing\Middleware\RoutingMiddleware::__invoke() - CORE/src/Routing/Middleware/RoutingMiddleware.php, line 162
Cake\Http\Runner::__invoke() - CORE/src/Http/Runner.php, line 65
Cake\Routing\Middleware\AssetMiddleware::__invoke() - CORE/src/Routing/Middleware/AssetMiddleware.php, line 88
Cake\Http\Runner::__invoke() - CORE/src/Http/Runner.php, line 65
Cake\Error\Middleware\ErrorHandlerMiddleware::__invoke() - CORE/src/Error/Middleware/ErrorHandlerMiddleware.php, line 96
Cake\Http\Runner::__invoke() - CORE/src/Http/Runner.php, line 65
Cake\Http\Runner::run() - CORE/src/Http/Runner.php, line 51</pre></div></pre>news-alerts/bihars-miraculous-economic-growth-myth-or-reality-1017.html"/>
<meta http-equiv="Content-Type" content="text/html; charset=utf-8"/>
<link href="https://im4change.in/css/control.css" rel="stylesheet" type="text/css"
media="all"/>
<title>News Alerts | Bihar’s miraculous economic growth: Myth or reality? | Im4change.org</title>
<meta name="description" content="
A section of the media seems to be mighty impressed with Bihar’s miraculous (11.03%) average annual growth during the 2004-05 to 2008-09, supposedly akin to that of Gujarat (11.05%) but is there a catch in this stunning statistics? (See the..."/>
<script src="https://im4change.in/js/jquery-1.10.2.js"></script>
<script type="text/javascript" src="https://im4change.in/js/jquery-migrate.min.js"></script>
<script language="javascript" type="text/javascript">
$(document).ready(function () {
var img = $("img")[0]; // Get my img elem
var pic_real_width, pic_real_height;
$("<img/>") // Make in memory copy of image to avoid css issues
.attr("src", $(img).attr("src"))
.load(function () {
pic_real_width = this.width; // Note: $(this).width() will not
pic_real_height = this.height; // work for in memory images.
});
});
</script>
<style type="text/css">
@media screen {
div.divFooter {
display: block;
}
}
@media print {
.printbutton {
display: none !important;
}
}
</style>
</head>
<body>
<table cellpadding="0" cellspacing="0" border="0" width="98%" align="center">
<tr>
<td class="top_bg">
<div class="divFooter">
<img src="https://im4change.in/images/logo1.jpg" height="59" border="0"
alt="Resource centre on India's rural distress" style="padding-top:14px;"/>
</div>
</td>
</tr>
<tr>
<td id="topspace"> </td>
</tr>
<tr id="topspace">
<td> </td>
</tr>
<tr>
<td height="50" style="border-bottom:1px solid #000; padding-top:10px;" class="printbutton">
<form><input type="button" value=" Print this page "
onclick="window.print();return false;"/></form>
</td>
</tr>
<tr>
<td width="100%">
<h1 class="news_headlines" style="font-style:normal">
<strong>Bihar’s miraculous economic growth: Myth or reality?</strong></h1>
</td>
</tr>
<tr>
<td width="100%" style="font-family:Arial, 'Segoe Script', 'Segoe UI', sans-serif, serif"><font size="3">
<p align="justify"><br /><font >A section of the media seems to be mighty impressed with Bihar’s miraculous (11.03%) average annual growth during the 2004-05 to 2008-09, supposedly akin to that of Gujarat (11.05%) but is there a catch in this stunning statistics? <em>(See the graph below)</em>. </font></p><p align="justify"><font >While the media has quoted the Gross State Domestic Product at factor cost (at constant 1999-2000 prices) as provided by the Central Statistical Organization (CSO), but the corresponding GSDP figures for Gujarat have yet to arrive. And hence, it will be a mistake to compare the average annual growth rate of Bihar from 2004-05 to 2008-09 with the average annual growth rate of Gujarat from 2004-05 to 2007-08. Besides, Bihar figures pertain to a much lower base of previous years. (The CSO does not generate data but merely reissues figures provided by the states.) </font></p><p align="justify"><font ><br />The National Human Development Report 2001 of the Planning Commission shows that Bihar comes at the bottom of the Human Development Index (HDI) among the 15 states which were studied. Bihar's HDI (0.367) comes below the HDI of Madhya Pradesh (0.394, Rank: 12), Orissa (0.404, Rank: 11) and Rajasthan (0.424, Rank: 9). Bihar is way below the average national HDI (0.472). This, obviously, strengthens the case for looking at the discrepancy between GSDP growth rate and actual development on the ground. For instance we can’t forget that about half the population of Bihar figures below the poverty line and over 56 per cent of Bihar’s children below the age of three years are underweight. </font></p><p align="justify"><font >Even on the statistics front, there are other states too who's GSDP at factor cost (at 1999-2000 prices) data for the year 2008-09 is yet to arrive. Some of them are: Madhya Pradesh, Maharastra, West Bengal etc. From a research point of view, it is not proper to compare Bihar with any other state in the absence of corresponding data. </font></p><p align="justify"><font >Instead of taking the period 2004-05 to 2008-09, if the period 1999-2000 and 2008-09 is considered, then Bihar's average annual growth rate falls down from 11.03% to 8.13%. Similarly, if the period for growth calculation is changed, then Gujarat's average annual growth rate reduces from 11.05% to 8.83% and India's average annual growth rate reduces from 8.49% to 7.09%. </font></p><p align="justify"><font >If we look at the various components of Bihar's GSDP (at 1999-2000 prices), we get some alarming results. Agriculture and allied activities' economic progress have been dismal in the recent years. This means that the state’s shrinking agriculture sector, on which about 80 per cent of the state’s population depends for livelihood, continues to stagnate. During 2005-06, the growth experienced by this sector was (-) 10.82 percent, while during 2007-08 it was (-) 8.72%. For the same years, industry in Bihar grew by 28.26% and 17.83% whereas services grew by 3.09% and 14.73%, respectively. The percentage share of Agriculture and Allied activities in the entire GSDP at factor cost (at 1999-2000 constant prices) has declined from 38.8% in 2000-01 to 26.2% in 2008-09. </font></p><p align="justify"><br /><font >The average annual growth rate of GSDP from construction (at 1999-2000 prices) between 2004-05 and 2008-09 was 36.16%. If the period is changed to between 1999-2000 and 2008-09, then the average annual growth rate of GSDP from construction turns out to be 24.44%. The percentage share of construction in the overall GSDP of Bihar has increased from 3.8% in 1999-2000 to 12.6% in 2008-09. </font></p><p align="justify"><font >The percentage share of Banking and Insurance in the entire GSDP of Bihar has more or less remained the same over the years. This sector plays a crucial role in industrial growth. We find that the percentage share of GSDP from registered manufacturing in the total GSDP of Bihar to be falling from 2.3% in 1999-2000 to 0.7% in 2008-09. The average annual growth rate of registered manufacturing GSDP during the period 2004-05 to 2008-09 has been merely 4.06%, which is much lesser than the average annual growth rate of GSDP from Agriculture and allied activities during the same period, i.e. 7.29%. </font></p><p align="justify"><font >The annual average growth of GSDP from unregistered manufacturing during the period 2004-05 to 2008-09 was 8.12%. The percentage share of GSDP from unregistered manufacturing in the total GSDP of Bihar has declined from 4.9% in 1999-2000 to 4.0% in 2008-09.</font> </p><p align="justify"><font >The percentage share of Public Administration in the GSDP of Bihar has been declining overtime. </font></p><p align="justify"><font ><strong>Graph 1: Economic growth faced by Bihar, Gujarat and India in different years</strong></font> </p><p align="justify"><font ><img style="width: 652px; height: 311px" src="https://im4change.in/siteadmin/tinymce/uploaded/Bihar eco gr.bmp" alt="Bihar eco gr" width="978" height="453" /><br /><em><strong>Source: </strong></em></font><a href="http://www.mospi.nic.in/" title="http://www.mospi.nic.in/">www.mospi.nic.in</a><font ><em> </em></font></p><p align="justify"><br /><font ><em>Further readings: </em></font></p><p align="justify"><font >GSDP data of various states of India,<br /></font><a href="http://www.mospi.nic.in/State-wise_SDP_1999-2000_20nov09.pdf" title="http://www.mospi.nic.in/State-wise_SDP_1999-2000_20nov09.pdf">http://www.mospi.nic.in/State-wise_SDP_1999-2000_20nov09.pdf</a><font > </font></p><p align="justify"><font >Economic Survey of Bihar 2008-09, Government of Bihar<br /></font><a href="http://www.indiaenvironmentportal.org.in/files/ESR-2008-09-EN.pdf" title="http://www.indiaenvironmentportal.org.in/files/ESR-2008-09-EN.pdf">http://www.indiaenvironmentportal.org.in/files/ESR-2008-09-EN.pdf</a> </p><p align="justify"><font >National Human Development Report 2001, Planning Commission,<br /></font><a href="https://im4change.in/docs/nhd2001.pdf" title="https://im4change.in/docs/nhd2001.pdf">http://www.im4change.org/docs/nhd2001.pdf</a><br /><font > <br />Bihar’s miracle: growth rate at 11.03 p.c., The Hindu, 3 January, 2010,<br /></font><a href="http://beta.thehindu.com/news/states/other-states/article74958.ece" title="http://beta.thehindu.com/news/states/other-states/article74958.ece">http://beta.thehindu.com/news/states/other-states/article7<br />4958.ece</a><font > </font></p><p align="justify"><font >Road to development, The Business Standard, 6 January, 2010, </font><a href="http://www.business-standard.com/india/news/road-to-development/381731/" title="http://www.business-standard.com/india/news/road-to-development/381731/">http://www.business-standard.com/india/news/road-to-develo<br />pment/381731/</a><font > <br /> <br />Hope for poor states, The Economic Times, 5 January, 2010,<br /></font><a href="http://economictimes.indiatimes.com/opinion/editorial/Hope-for-poor-states/articleshow/5411079.cms" title="http://economictimes.indiatimes.com/opinion/editorial/Hope-for-poor-states/articleshow/5411079.cms">http://economictimes.indiatimes.com/opinion/editorial/Hope<br />-for-poor-states/articleshow/5411079.cms</a><font > <br /> <br />New miracle economies: Bihar, poor states by SA Aiyar, The Times of India, 3 Jauary, 2010, </font><a href="http://blogs.timesofindia.indiatimes.com/Swaminomics/entry/new-miracle-economies-bihar-poor" title="http://blogs.timesofindia.indiatimes.com/Swaminomics/entry/new-miracle-economies-bihar-poor">http://blogs.timesofindia.indiatimes.com/Swaminomics/entry<br />/new-miracle-economies-bihar-poor</a><font > <br /> <br />Bihar grew by 11.03%, next only to Gujarat, The Times of India, 3 January, 2010,</font> </p><p align="justify"><a href="http://timesofindia.indiatimes.com/biz/india-business/Bihar-grew-by-1103-next-only-to-Gujarat/articleshow/5405973.cms" title="http://timesofindia.indiatimes.com/biz/india-business/Bihar-grew-by-1103-next-only-to-Gujarat/articleshow/5405973.cms">http://timesofindia.indiatimes.com/biz/india-business/Biha<br />r-grew-by-1103-next-only-to-Gujarat/articleshow/5405973.cm<br />s</a><font > </font></p><p align="justify"><font >Mind The Shadows by Lola Nayar, Outlook India,<br /></font><a href="http://www.outlookindia.com/article.aspx?263643" title="http://www.outlookindia.com/article.aspx?263643">http://www.outlookindia.com/article.aspx?263643</a><br /><font > <br />Bihar, a growth story by Raj Kumar, The Times of India, 11 January, 2010,</font> </p><p align="justify"><a href="http://timesofindia.indiatimes.com/home/sunday-toi/special-report/Bihar-a-growth-story/articleshow/5428960.cms" title="http://timesofindia.indiatimes.com/home/sunday-toi/special-report/Bihar-a-growth-story/articleshow/5428960.cms">http://timesofindia.indiatimes.com/home/sunday-toi/special<br />-report/Bihar-a-growth-story/articleshow/5428960.cms</a><font > <br /> <br />How Bihar can rise as a developed state by Kailash Nautiyal, Rediff.com,</font> </p><p align="justify"><a href="http://business.rediff.com/slide-show/2010/jan/04/slide-show-1-how-bihar-can-rise-as-a-developed-state.htm#contentTop" title="http://business.rediff.com/slide-show/2010/jan/04/slide-show-1-how-bihar-can-rise-as-a-developed-state.htm#contentTop">http://business.rediff.com/slide-show/2010/jan/04/slide-sh<br />ow-1-how-bihar-can-rise-as-a-developed-state.htm#contentTo<br />p</a><font > <br /> </font> </p> </font>
</td>
</tr>
<tr>
<td> </td>
</tr>
<tr>
<td height="50" style="border-top:1px solid #000; border-bottom:1px solid #000;padding-top:10px;">
<form><input type="button" value=" Print this page "
onclick="window.print();return false;"/></form>
</td>
</tr>
</table></body>
</html>'
}
$reasonPhrase = 'OK'
header - [internal], line ??
Cake\Http\ResponseEmitter::emitStatusLine() - CORE/src/Http/ResponseEmitter.php, line 148
Cake\Http\ResponseEmitter::emit() - CORE/src/Http/ResponseEmitter.php, line 54
Cake\Http\Server::emit() - CORE/src/Http/Server.php, line 141
[main] - ROOT/webroot/index.php, line 39
Warning (2): Cannot modify header information - headers already sent by (output started at /home/brlfuser/public_html/vendor/cakephp/cakephp/src/Error/Debugger.php:853) [CORE/src/Http/ResponseEmitter.php, line 181]
$response = object(Cake\Http\Response) {
'status' => (int) 200,
'contentType' => 'text/html',
'headers' => [
'Content-Type' => [
[maximum depth reached]
]
],
'file' => null,
'fileRange' => [],
'cookies' => object(Cake\Http\Cookie\CookieCollection) {},
'cacheDirectives' => [],
'body' => '<!DOCTYPE html PUBLIC "-//W3C//DTD XHTML 1.0 Transitional//EN"
"http://www.w3.org/TR/xhtml1/DTD/xhtml1-transitional.dtd">
<html xmlns="http://www.w3.org/1999/xhtml">
<head>
<link rel="canonical" href="https://im4change.in/<pre class="cake-error"><a href="javascript:void(0);" onclick="document.getElementById('cakeErr6804fb757b1d2-trace').style.display = (document.getElementById('cakeErr6804fb757b1d2-trace').style.display == 'none' ? '' : 'none');"><b>Notice</b> (8)</a>: Undefined variable: urlPrefix [<b>APP/Template/Layout/printlayout.ctp</b>, line <b>8</b>]<div id="cakeErr6804fb757b1d2-trace" class="cake-stack-trace" style="display: none;"><a href="javascript:void(0);" onclick="document.getElementById('cakeErr6804fb757b1d2-code').style.display = (document.getElementById('cakeErr6804fb757b1d2-code').style.display == 'none' ? '' : 'none')">Code</a> <a href="javascript:void(0);" onclick="document.getElementById('cakeErr6804fb757b1d2-context').style.display = (document.getElementById('cakeErr6804fb757b1d2-context').style.display == 'none' ? '' : 'none')">Context</a><pre id="cakeErr6804fb757b1d2-code" class="cake-code-dump" style="display: none;"><code><span style="color: #000000"><span style="color: #0000BB"></span><span style="color: #007700"><</span><span style="color: #0000BB">head</span><span style="color: #007700">>
</span></span></code>
<span class="code-highlight"><code><span style="color: #000000"> <link rel="canonical" href="<span style="color: #0000BB"><?php </span><span style="color: #007700">echo </span><span style="color: #0000BB">Configure</span><span style="color: #007700">::</span><span style="color: #0000BB">read</span><span style="color: #007700">(</span><span style="color: #DD0000">'SITE_URL'</span><span style="color: #007700">); </span><span style="color: #0000BB">?><?php </span><span style="color: #007700">echo </span><span style="color: #0000BB">$urlPrefix</span><span style="color: #007700">;</span><span style="color: #0000BB">?><?php </span><span style="color: #007700">echo </span><span style="color: #0000BB">$article_current</span><span style="color: #007700">-></span><span style="color: #0000BB">category</span><span style="color: #007700">-></span><span style="color: #0000BB">slug</span><span style="color: #007700">; </span><span style="color: #0000BB">?></span>/<span style="color: #0000BB"><?php </span><span style="color: #007700">echo </span><span style="color: #0000BB">$article_current</span><span style="color: #007700">-></span><span style="color: #0000BB">seo_url</span><span style="color: #007700">; </span><span style="color: #0000BB">?></span>.html"/>
</span></code></span>
<code><span style="color: #000000"><span style="color: #0000BB"> </span><span style="color: #007700"><</span><span style="color: #0000BB">meta http</span><span style="color: #007700">-</span><span style="color: #0000BB">equiv</span><span style="color: #007700">=</span><span style="color: #DD0000">"Content-Type" </span><span style="color: #0000BB">content</span><span style="color: #007700">=</span><span style="color: #DD0000">"text/html; charset=utf-8"</span><span style="color: #007700">/>
</span></span></code></pre><pre id="cakeErr6804fb757b1d2-context" class="cake-context" style="display: none;">$viewFile = '/home/brlfuser/public_html/src/Template/Layout/printlayout.ctp'
$dataForView = [
'article_current' => object(App\Model\Entity\Article) {
'id' => (int) 943,
'title' => 'Bihar’s miraculous economic growth: Myth or reality?',
'subheading' => '',
'description' => '<p align="justify">
<br />
<font face="arial,helvetica,sans-serif" size="3">A section of the media seems to be mighty impressed with Bihar&rsquo;s miraculous (11.03%) average annual growth during the 2004-05 to 2008-09, supposedly akin to that of Gujarat (11.05%) but is there a catch in this stunning statistics? <em>(See the graph below)</em>. </font>
</p>
<p align="justify">
<font face="arial,helvetica,sans-serif" size="3">While the media has quoted the Gross State Domestic Product at factor cost (at constant 1999-2000 prices) as provided by the Central Statistical Organization (CSO), but the corresponding GSDP figures for Gujarat have yet to arrive. And hence, it will be a mistake to compare the average annual growth rate of Bihar from 2004-05 to 2008-09 with the average annual growth rate of Gujarat from 2004-05 to 2007-08. Besides, Bihar figures pertain to a much lower base of previous years. (The CSO does not generate data but merely reissues figures provided by the states.)&nbsp; </font>
</p>
<p align="justify">
<font face="arial,helvetica,sans-serif" size="3"><br />
The National Human Development Report 2001 of the Planning Commission shows that Bihar comes at the bottom of the Human Development Index (HDI) among the 15 states which were studied. Bihar's HDI (0.367) comes below the HDI of Madhya Pradesh (0.394, Rank: 12), Orissa (0.404, Rank: 11) and Rajasthan (0.424, Rank: 9). Bihar is way below the average national HDI (0.472). This, obviously, strengthens the case for looking at the discrepancy between GSDP growth rate and actual development on the ground. For instance we can&rsquo;t forget that about half the population of Bihar figures below the poverty line and over 56 per cent of Bihar&rsquo;s children below the age of three years are underweight. </font>
</p>
<p align="justify">
<font face="arial,helvetica,sans-serif" size="3">Even on the statistics front, there are other states too who's GSDP at factor cost (at 1999-2000 prices) data for the year 2008-09 is yet to arrive. Some of them are: Madhya Pradesh, Maharastra, West Bengal etc. From a research point of view, it is not proper to compare Bihar with any other state in the absence of corresponding data. </font>
</p>
<p align="justify">
<font face="arial,helvetica,sans-serif" size="3">Instead of taking the period 2004-05 to 2008-09, if the period 1999-2000 and 2008-09 is considered, then Bihar's average annual growth rate falls down from 11.03% to 8.13%. Similarly, if the period for growth calculation is changed, then Gujarat's average annual growth rate reduces from 11.05% to 8.83% and India's average annual growth rate reduces from 8.49% to 7.09%. </font>
</p>
<p align="justify">
<font face="arial,helvetica,sans-serif" size="3">If we look at the various components of Bihar's GSDP (at 1999-2000 prices), we get some alarming results. Agriculture and allied activities' economic progress have been dismal in the recent years. This means that the state&rsquo;s shrinking agriculture sector, on which about 80 per cent of the state&rsquo;s population depends for livelihood, continues to stagnate. During 2005-06, the growth experienced by this sector was (-) 10.82 percent, while during 2007-08 it was (-) 8.72%. For the same years, industry in Bihar grew by 28.26% and 17.83% whereas services grew by 3.09% and 14.73%, respectively. The percentage share of Agriculture and Allied activities in the entire GSDP at factor cost (at 1999-2000 constant prices) has declined from 38.8% in 2000-01 to 26.2% in 2008-09. </font>
</p>
<p align="justify">
<br />
<font face="arial,helvetica,sans-serif" size="3">The average annual growth rate of GSDP from construction (at 1999-2000 prices) between 2004-05 and 2008-09 was 36.16%. If the period is changed to between 1999-2000 and 2008-09, then the average annual growth rate of GSDP from construction turns out to be 24.44%. The percentage share of construction in the overall GSDP of Bihar has increased from 3.8% in 1999-2000 to 12.6% in 2008-09. </font>
</p>
<p align="justify">
<font face="arial,helvetica,sans-serif" size="3">The percentage share of Banking and Insurance in the entire GSDP of Bihar has more or less remained the same over the years. This sector plays a crucial role in industrial growth. We find that the percentage share of GSDP from registered manufacturing in the total GSDP of Bihar to be falling from 2.3% in 1999-2000 to 0.7% in 2008-09. The average annual growth rate of registered manufacturing GSDP during the period 2004-05 to 2008-09 has been merely 4.06%, which is much lesser than the average annual growth rate of GSDP from Agriculture and allied activities during the same period, i.e. 7.29%.&nbsp;&nbsp;&nbsp; </font>
</p>
<p align="justify">
<font face="arial,helvetica,sans-serif" size="3">The annual average growth of GSDP from unregistered manufacturing during the period 2004-05 to 2008-09 was 8.12%. The percentage share of GSDP from unregistered manufacturing in the total GSDP of Bihar has declined from 4.9% in 1999-2000 to 4.0% in 2008-09.</font>
</p>
<p align="justify">
<font face="arial,helvetica,sans-serif" size="3">The percentage share of Public Administration in the GSDP of Bihar has been declining overtime. </font>
</p>
<p align="justify">
<font face="arial,helvetica,sans-serif" size="3"><strong>Graph 1: Economic growth faced by Bihar, Gujarat and India in different years</strong></font>
</p>
<p align="justify">
<font face="arial,helvetica,sans-serif" size="3"><img style="width: 652px; height: 311px" src="tinymce/uploaded/Bihar eco gr.bmp" alt="Bihar eco gr" width="978" height="453" /><br />
<em><strong>Source: </strong></em></font><a href="http://www.mospi.nic.in/"><font face="arial,helvetica,sans-serif" size="3"><em>www.mospi.nic.in</em></font></a><font face="arial,helvetica,sans-serif" size="3"><em> </em></font>
</p>
<p align="justify">
<br />
<font face="arial,helvetica,sans-serif" size="3"><em>Further readings: </em></font>
</p>
<p align="justify">
<font face="arial,helvetica,sans-serif" size="3">GSDP data of various states of India,<br />
</font><a href="http://www.mospi.nic.in/State-wise_SDP_1999-2000_20nov09.pdf"><font face="arial,helvetica,sans-serif" size="3">http://www.mospi.nic.in/State-wise_SDP_1999-2000_20nov09.pdf</font></a><font face="arial,helvetica,sans-serif" size="3"> </font>
</p>
<p align="justify">
<font face="arial,helvetica,sans-serif" size="3">Economic Survey of Bihar 2008-09, Government of Bihar<br />
</font><a href="http://www.indiaenvironmentportal.org.in/files/ESR-2008-09-EN.pdf"><font face="arial,helvetica,sans-serif" size="3">http://www.indiaenvironmentportal.org.in/files/ESR-2008-09-EN.pdf</font></a>
</p>
<p align="justify">
<font face="arial,helvetica,sans-serif" size="3">National Human Development Report 2001, Planning Commission,<br />
</font><a href="../docs/nhd2001.pdf"><font face="arial,helvetica,sans-serif" size="3">http://www.im4change.org/docs/nhd2001.pdf</font></a><br />
<font face="arial,helvetica,sans-serif" size="3">&nbsp;<br />
Bihar&rsquo;s miracle: growth rate at 11.03 p.c., The Hindu, 3 January, 2010,<br />
</font><a href="http://beta.thehindu.com/news/states/other-states/article74958.ece"><font face="arial,helvetica,sans-serif" size="3">http://beta.thehindu.com/news/states/other-states/article74958.ece</font></a><font face="arial,helvetica,sans-serif" size="3"> </font>
</p>
<p align="justify">
<font face="arial,helvetica,sans-serif" size="3">Road to development, The Business Standard, 6 January, 2010, </font><a href="http://www.business-standard.com/india/news/road-to-development/381731/"><font face="arial,helvetica,sans-serif" size="3">http://www.business-standard.com/india/news/road-to-development/381731/</font></a><font face="arial,helvetica,sans-serif" size="3"> <br />
&nbsp;<br />
Hope for poor states, The Economic Times, 5 January, 2010,<br />
</font><a href="http://economictimes.indiatimes.com/opinion/editorial/Hope-for-poor-states/articleshow/5411079.cms"><font face="arial,helvetica,sans-serif" size="3">http://economictimes.indiatimes.com/opinion/editorial/Hope-for-poor-states/articleshow/5411079.cms</font></a><font face="arial,helvetica,sans-serif" size="3">&nbsp; <br />
&nbsp;<br />
New miracle economies: Bihar, poor states by SA Aiyar, The Times of India, 3 Jauary, 2010, </font><a href="http://blogs.timesofindia.indiatimes.com/Swaminomics/entry/new-miracle-economies-bihar-poor"><font face="arial,helvetica,sans-serif" size="3">http://blogs.timesofindia.indiatimes.com/Swaminomics/entry/new-miracle-economies-bihar-poor</font></a><font face="arial,helvetica,sans-serif" size="3">&nbsp; <br />
&nbsp;<br />
Bihar grew by 11.03%, next only to Gujarat, The Times of India, 3 January, 2010,</font>
</p>
<p align="justify">
<a href="http://timesofindia.indiatimes.com/biz/india-business/Bihar-grew-by-1103-next-only-to-Gujarat/articleshow/5405973.cms"><font face="arial,helvetica,sans-serif" size="3">http://timesofindia.indiatimes.com/biz/india-business/Bihar-grew-by-1103-next-only-to-Gujarat/articleshow/5405973.cms</font></a><font face="arial,helvetica,sans-serif" size="3">&nbsp; </font>
</p>
<p align="justify">
<font face="arial,helvetica,sans-serif" size="3">Mind The Shadows by Lola Nayar, Outlook India,<br />
</font><a href="http://www.outlookindia.com/article.aspx?263643"><font face="arial,helvetica,sans-serif" size="3">http://www.outlookindia.com/article.aspx?263643</font></a><br />
<font face="arial,helvetica,sans-serif" size="3">&nbsp;<br />
Bihar, a growth story by Raj Kumar, The Times of India, 11 January, 2010,</font>
</p>
<p align="justify">
<a href="http://timesofindia.indiatimes.com/home/sunday-toi/special-report/Bihar-a-growth-story/articleshow/5428960.cms"><font face="arial,helvetica,sans-serif" size="3">http://timesofindia.indiatimes.com/home/sunday-toi/special-report/Bihar-a-growth-story/articleshow/5428960.cms</font></a><font face="arial,helvetica,sans-serif" size="3">&nbsp; <br />
&nbsp;<br />
How Bihar can rise as a developed state by Kailash Nautiyal, Rediff.com,</font>
</p>
<p align="justify">
<a href="http://business.rediff.com/slide-show/2010/jan/04/slide-show-1-how-bihar-can-rise-as-a-developed-state.htm#contentTop"><font face="arial,helvetica,sans-serif" size="3">http://business.rediff.com/slide-show/2010/jan/04/slide-show-1-how-bihar-can-rise-as-a-developed-state.htm#contentTop</font></a><font face="arial,helvetica,sans-serif" size="3">&nbsp; <br />
&nbsp;</font>
</p>
',
'credit_writer' => '',
'article_img' => '',
'article_img_thumb' => '',
'status' => (int) 1,
'show_on_home' => (int) 1,
'lang' => 'EN',
'category_id' => (int) 15,
'tag_keyword' => '',
'seo_url' => 'bihars-miraculous-economic-growth-myth-or-reality-1017',
'meta_title' => null,
'meta_keywords' => null,
'meta_description' => null,
'noindex' => (int) 0,
'publish_date' => object(Cake\I18n\FrozenDate) {},
'most_visit_section_id' => null,
'article_big_img' => null,
'liveid' => (int) 1017,
'created' => object(Cake\I18n\FrozenTime) {},
'modified' => object(Cake\I18n\FrozenTime) {},
'edate' => '',
'tags' => [[maximum depth reached]],
'category' => object(App\Model\Entity\Category) {},
'[new]' => false,
'[accessible]' => [
[maximum depth reached]
],
'[dirty]' => [[maximum depth reached]],
'[original]' => [[maximum depth reached]],
'[virtual]' => [[maximum depth reached]],
'[hasErrors]' => false,
'[errors]' => [[maximum depth reached]],
'[invalid]' => [[maximum depth reached]],
'[repository]' => 'Articles'
},
'articleid' => (int) 943,
'metaTitle' => 'News Alerts | Bihar’s miraculous economic growth: Myth or reality?',
'metaKeywords' => null,
'metaDesc' => '
A section of the media seems to be mighty impressed with Bihar&rsquo;s miraculous (11.03%) average annual growth during the 2004-05 to 2008-09, supposedly akin to that of Gujarat (11.05%) but is there a catch in this stunning statistics? (See the...',
'disp' => '<p align="justify"><br /><font >A section of the media seems to be mighty impressed with Bihar&rsquo;s miraculous (11.03%) average annual growth during the 2004-05 to 2008-09, supposedly akin to that of Gujarat (11.05%) but is there a catch in this stunning statistics? <em>(See the graph below)</em>. </font></p><p align="justify"><font >While the media has quoted the Gross State Domestic Product at factor cost (at constant 1999-2000 prices) as provided by the Central Statistical Organization (CSO), but the corresponding GSDP figures for Gujarat have yet to arrive. And hence, it will be a mistake to compare the average annual growth rate of Bihar from 2004-05 to 2008-09 with the average annual growth rate of Gujarat from 2004-05 to 2007-08. Besides, Bihar figures pertain to a much lower base of previous years. (The CSO does not generate data but merely reissues figures provided by the states.)&nbsp; </font></p><p align="justify"><font ><br />The National Human Development Report 2001 of the Planning Commission shows that Bihar comes at the bottom of the Human Development Index (HDI) among the 15 states which were studied. Bihar's HDI (0.367) comes below the HDI of Madhya Pradesh (0.394, Rank: 12), Orissa (0.404, Rank: 11) and Rajasthan (0.424, Rank: 9). Bihar is way below the average national HDI (0.472). This, obviously, strengthens the case for looking at the discrepancy between GSDP growth rate and actual development on the ground. For instance we can&rsquo;t forget that about half the population of Bihar figures below the poverty line and over 56 per cent of Bihar&rsquo;s children below the age of three years are underweight. </font></p><p align="justify"><font >Even on the statistics front, there are other states too who's GSDP at factor cost (at 1999-2000 prices) data for the year 2008-09 is yet to arrive. Some of them are: Madhya Pradesh, Maharastra, West Bengal etc. From a research point of view, it is not proper to compare Bihar with any other state in the absence of corresponding data. </font></p><p align="justify"><font >Instead of taking the period 2004-05 to 2008-09, if the period 1999-2000 and 2008-09 is considered, then Bihar's average annual growth rate falls down from 11.03% to 8.13%. Similarly, if the period for growth calculation is changed, then Gujarat's average annual growth rate reduces from 11.05% to 8.83% and India's average annual growth rate reduces from 8.49% to 7.09%. </font></p><p align="justify"><font >If we look at the various components of Bihar's GSDP (at 1999-2000 prices), we get some alarming results. Agriculture and allied activities' economic progress have been dismal in the recent years. This means that the state&rsquo;s shrinking agriculture sector, on which about 80 per cent of the state&rsquo;s population depends for livelihood, continues to stagnate. During 2005-06, the growth experienced by this sector was (-) 10.82 percent, while during 2007-08 it was (-) 8.72%. For the same years, industry in Bihar grew by 28.26% and 17.83% whereas services grew by 3.09% and 14.73%, respectively. The percentage share of Agriculture and Allied activities in the entire GSDP at factor cost (at 1999-2000 constant prices) has declined from 38.8% in 2000-01 to 26.2% in 2008-09. </font></p><p align="justify"><br /><font >The average annual growth rate of GSDP from construction (at 1999-2000 prices) between 2004-05 and 2008-09 was 36.16%. If the period is changed to between 1999-2000 and 2008-09, then the average annual growth rate of GSDP from construction turns out to be 24.44%. The percentage share of construction in the overall GSDP of Bihar has increased from 3.8% in 1999-2000 to 12.6% in 2008-09. </font></p><p align="justify"><font >The percentage share of Banking and Insurance in the entire GSDP of Bihar has more or less remained the same over the years. This sector plays a crucial role in industrial growth. We find that the percentage share of GSDP from registered manufacturing in the total GSDP of Bihar to be falling from 2.3% in 1999-2000 to 0.7% in 2008-09. The average annual growth rate of registered manufacturing GSDP during the period 2004-05 to 2008-09 has been merely 4.06%, which is much lesser than the average annual growth rate of GSDP from Agriculture and allied activities during the same period, i.e. 7.29%.&nbsp;&nbsp;&nbsp; </font></p><p align="justify"><font >The annual average growth of GSDP from unregistered manufacturing during the period 2004-05 to 2008-09 was 8.12%. The percentage share of GSDP from unregistered manufacturing in the total GSDP of Bihar has declined from 4.9% in 1999-2000 to 4.0% in 2008-09.</font> </p><p align="justify"><font >The percentage share of Public Administration in the GSDP of Bihar has been declining overtime. </font></p><p align="justify"><font ><strong>Graph 1: Economic growth faced by Bihar, Gujarat and India in different years</strong></font> </p><p align="justify"><font ><img style="width: 652px; height: 311px" src="https://im4change.in/siteadmin/tinymce/uploaded/Bihar eco gr.bmp" alt="Bihar eco gr" width="978" height="453" /><br /><em><strong>Source: </strong></em></font><a href="http://www.mospi.nic.in/" title="http://www.mospi.nic.in/">www.mospi.nic.in</a><font ><em> </em></font></p><p align="justify"><br /><font ><em>Further readings: </em></font></p><p align="justify"><font >GSDP data of various states of India,<br /></font><a href="http://www.mospi.nic.in/State-wise_SDP_1999-2000_20nov09.pdf" title="http://www.mospi.nic.in/State-wise_SDP_1999-2000_20nov09.pdf">http://www.mospi.nic.in/State-wise_SDP_1999-2000_20nov09.pdf</a><font > </font></p><p align="justify"><font >Economic Survey of Bihar 2008-09, Government of Bihar<br /></font><a href="http://www.indiaenvironmentportal.org.in/files/ESR-2008-09-EN.pdf" title="http://www.indiaenvironmentportal.org.in/files/ESR-2008-09-EN.pdf">http://www.indiaenvironmentportal.org.in/files/ESR-2008-09-EN.pdf</a> </p><p align="justify"><font >National Human Development Report 2001, Planning Commission,<br /></font><a href="https://im4change.in/docs/nhd2001.pdf" title="https://im4change.in/docs/nhd2001.pdf">http://www.im4change.org/docs/nhd2001.pdf</a><br /><font >&nbsp;<br />Bihar&rsquo;s miracle: growth rate at 11.03 p.c., The Hindu, 3 January, 2010,<br /></font><a href="http://beta.thehindu.com/news/states/other-states/article74958.ece" title="http://beta.thehindu.com/news/states/other-states/article74958.ece">http://beta.thehindu.com/news/states/other-states/article7<br />4958.ece</a><font > </font></p><p align="justify"><font >Road to development, The Business Standard, 6 January, 2010, </font><a href="http://www.business-standard.com/india/news/road-to-development/381731/" title="http://www.business-standard.com/india/news/road-to-development/381731/">http://www.business-standard.com/india/news/road-to-develo<br />pment/381731/</a><font > <br />&nbsp;<br />Hope for poor states, The Economic Times, 5 January, 2010,<br /></font><a href="http://economictimes.indiatimes.com/opinion/editorial/Hope-for-poor-states/articleshow/5411079.cms" title="http://economictimes.indiatimes.com/opinion/editorial/Hope-for-poor-states/articleshow/5411079.cms">http://economictimes.indiatimes.com/opinion/editorial/Hope<br />-for-poor-states/articleshow/5411079.cms</a><font >&nbsp; <br />&nbsp;<br />New miracle economies: Bihar, poor states by SA Aiyar, The Times of India, 3 Jauary, 2010, </font><a href="http://blogs.timesofindia.indiatimes.com/Swaminomics/entry/new-miracle-economies-bihar-poor" title="http://blogs.timesofindia.indiatimes.com/Swaminomics/entry/new-miracle-economies-bihar-poor">http://blogs.timesofindia.indiatimes.com/Swaminomics/entry<br />/new-miracle-economies-bihar-poor</a><font >&nbsp; <br />&nbsp;<br />Bihar grew by 11.03%, next only to Gujarat, The Times of India, 3 January, 2010,</font> </p><p align="justify"><a href="http://timesofindia.indiatimes.com/biz/india-business/Bihar-grew-by-1103-next-only-to-Gujarat/articleshow/5405973.cms" title="http://timesofindia.indiatimes.com/biz/india-business/Bihar-grew-by-1103-next-only-to-Gujarat/articleshow/5405973.cms">http://timesofindia.indiatimes.com/biz/india-business/Biha<br />r-grew-by-1103-next-only-to-Gujarat/articleshow/5405973.cm<br />s</a><font >&nbsp; </font></p><p align="justify"><font >Mind The Shadows by Lola Nayar, Outlook India,<br /></font><a href="http://www.outlookindia.com/article.aspx?263643" title="http://www.outlookindia.com/article.aspx?263643">http://www.outlookindia.com/article.aspx?263643</a><br /><font >&nbsp;<br />Bihar, a growth story by Raj Kumar, The Times of India, 11 January, 2010,</font> </p><p align="justify"><a href="http://timesofindia.indiatimes.com/home/sunday-toi/special-report/Bihar-a-growth-story/articleshow/5428960.cms" title="http://timesofindia.indiatimes.com/home/sunday-toi/special-report/Bihar-a-growth-story/articleshow/5428960.cms">http://timesofindia.indiatimes.com/home/sunday-toi/special<br />-report/Bihar-a-growth-story/articleshow/5428960.cms</a><font >&nbsp; <br />&nbsp;<br />How Bihar can rise as a developed state by Kailash Nautiyal, Rediff.com,</font> </p><p align="justify"><a href="http://business.rediff.com/slide-show/2010/jan/04/slide-show-1-how-bihar-can-rise-as-a-developed-state.htm#contentTop" title="http://business.rediff.com/slide-show/2010/jan/04/slide-show-1-how-bihar-can-rise-as-a-developed-state.htm#contentTop">http://business.rediff.com/slide-show/2010/jan/04/slide-sh<br />ow-1-how-bihar-can-rise-as-a-developed-state.htm#contentTo<br />p</a><font >&nbsp; <br />&nbsp;</font> </p>',
'lang' => 'English',
'SITE_URL' => 'https://im4change.in/',
'site_title' => 'im4change',
'adminprix' => 'admin'
]
$article_current = object(App\Model\Entity\Article) {
'id' => (int) 943,
'title' => 'Bihar’s miraculous economic growth: Myth or reality?',
'subheading' => '',
'description' => '<p align="justify">
<br />
<font face="arial,helvetica,sans-serif" size="3">A section of the media seems to be mighty impressed with Bihar&rsquo;s miraculous (11.03%) average annual growth during the 2004-05 to 2008-09, supposedly akin to that of Gujarat (11.05%) but is there a catch in this stunning statistics? <em>(See the graph below)</em>. </font>
</p>
<p align="justify">
<font face="arial,helvetica,sans-serif" size="3">While the media has quoted the Gross State Domestic Product at factor cost (at constant 1999-2000 prices) as provided by the Central Statistical Organization (CSO), but the corresponding GSDP figures for Gujarat have yet to arrive. And hence, it will be a mistake to compare the average annual growth rate of Bihar from 2004-05 to 2008-09 with the average annual growth rate of Gujarat from 2004-05 to 2007-08. Besides, Bihar figures pertain to a much lower base of previous years. (The CSO does not generate data but merely reissues figures provided by the states.)&nbsp; </font>
</p>
<p align="justify">
<font face="arial,helvetica,sans-serif" size="3"><br />
The National Human Development Report 2001 of the Planning Commission shows that Bihar comes at the bottom of the Human Development Index (HDI) among the 15 states which were studied. Bihar's HDI (0.367) comes below the HDI of Madhya Pradesh (0.394, Rank: 12), Orissa (0.404, Rank: 11) and Rajasthan (0.424, Rank: 9). Bihar is way below the average national HDI (0.472). This, obviously, strengthens the case for looking at the discrepancy between GSDP growth rate and actual development on the ground. For instance we can&rsquo;t forget that about half the population of Bihar figures below the poverty line and over 56 per cent of Bihar&rsquo;s children below the age of three years are underweight. </font>
</p>
<p align="justify">
<font face="arial,helvetica,sans-serif" size="3">Even on the statistics front, there are other states too who's GSDP at factor cost (at 1999-2000 prices) data for the year 2008-09 is yet to arrive. Some of them are: Madhya Pradesh, Maharastra, West Bengal etc. From a research point of view, it is not proper to compare Bihar with any other state in the absence of corresponding data. </font>
</p>
<p align="justify">
<font face="arial,helvetica,sans-serif" size="3">Instead of taking the period 2004-05 to 2008-09, if the period 1999-2000 and 2008-09 is considered, then Bihar's average annual growth rate falls down from 11.03% to 8.13%. Similarly, if the period for growth calculation is changed, then Gujarat's average annual growth rate reduces from 11.05% to 8.83% and India's average annual growth rate reduces from 8.49% to 7.09%. </font>
</p>
<p align="justify">
<font face="arial,helvetica,sans-serif" size="3">If we look at the various components of Bihar's GSDP (at 1999-2000 prices), we get some alarming results. Agriculture and allied activities' economic progress have been dismal in the recent years. This means that the state&rsquo;s shrinking agriculture sector, on which about 80 per cent of the state&rsquo;s population depends for livelihood, continues to stagnate. During 2005-06, the growth experienced by this sector was (-) 10.82 percent, while during 2007-08 it was (-) 8.72%. For the same years, industry in Bihar grew by 28.26% and 17.83% whereas services grew by 3.09% and 14.73%, respectively. The percentage share of Agriculture and Allied activities in the entire GSDP at factor cost (at 1999-2000 constant prices) has declined from 38.8% in 2000-01 to 26.2% in 2008-09. </font>
</p>
<p align="justify">
<br />
<font face="arial,helvetica,sans-serif" size="3">The average annual growth rate of GSDP from construction (at 1999-2000 prices) between 2004-05 and 2008-09 was 36.16%. If the period is changed to between 1999-2000 and 2008-09, then the average annual growth rate of GSDP from construction turns out to be 24.44%. The percentage share of construction in the overall GSDP of Bihar has increased from 3.8% in 1999-2000 to 12.6% in 2008-09. </font>
</p>
<p align="justify">
<font face="arial,helvetica,sans-serif" size="3">The percentage share of Banking and Insurance in the entire GSDP of Bihar has more or less remained the same over the years. This sector plays a crucial role in industrial growth. We find that the percentage share of GSDP from registered manufacturing in the total GSDP of Bihar to be falling from 2.3% in 1999-2000 to 0.7% in 2008-09. The average annual growth rate of registered manufacturing GSDP during the period 2004-05 to 2008-09 has been merely 4.06%, which is much lesser than the average annual growth rate of GSDP from Agriculture and allied activities during the same period, i.e. 7.29%.&nbsp;&nbsp;&nbsp; </font>
</p>
<p align="justify">
<font face="arial,helvetica,sans-serif" size="3">The annual average growth of GSDP from unregistered manufacturing during the period 2004-05 to 2008-09 was 8.12%. The percentage share of GSDP from unregistered manufacturing in the total GSDP of Bihar has declined from 4.9% in 1999-2000 to 4.0% in 2008-09.</font>
</p>
<p align="justify">
<font face="arial,helvetica,sans-serif" size="3">The percentage share of Public Administration in the GSDP of Bihar has been declining overtime. </font>
</p>
<p align="justify">
<font face="arial,helvetica,sans-serif" size="3"><strong>Graph 1: Economic growth faced by Bihar, Gujarat and India in different years</strong></font>
</p>
<p align="justify">
<font face="arial,helvetica,sans-serif" size="3"><img style="width: 652px; height: 311px" src="tinymce/uploaded/Bihar eco gr.bmp" alt="Bihar eco gr" width="978" height="453" /><br />
<em><strong>Source: </strong></em></font><a href="http://www.mospi.nic.in/"><font face="arial,helvetica,sans-serif" size="3"><em>www.mospi.nic.in</em></font></a><font face="arial,helvetica,sans-serif" size="3"><em> </em></font>
</p>
<p align="justify">
<br />
<font face="arial,helvetica,sans-serif" size="3"><em>Further readings: </em></font>
</p>
<p align="justify">
<font face="arial,helvetica,sans-serif" size="3">GSDP data of various states of India,<br />
</font><a href="http://www.mospi.nic.in/State-wise_SDP_1999-2000_20nov09.pdf"><font face="arial,helvetica,sans-serif" size="3">http://www.mospi.nic.in/State-wise_SDP_1999-2000_20nov09.pdf</font></a><font face="arial,helvetica,sans-serif" size="3"> </font>
</p>
<p align="justify">
<font face="arial,helvetica,sans-serif" size="3">Economic Survey of Bihar 2008-09, Government of Bihar<br />
</font><a href="http://www.indiaenvironmentportal.org.in/files/ESR-2008-09-EN.pdf"><font face="arial,helvetica,sans-serif" size="3">http://www.indiaenvironmentportal.org.in/files/ESR-2008-09-EN.pdf</font></a>
</p>
<p align="justify">
<font face="arial,helvetica,sans-serif" size="3">National Human Development Report 2001, Planning Commission,<br />
</font><a href="../docs/nhd2001.pdf"><font face="arial,helvetica,sans-serif" size="3">http://www.im4change.org/docs/nhd2001.pdf</font></a><br />
<font face="arial,helvetica,sans-serif" size="3">&nbsp;<br />
Bihar&rsquo;s miracle: growth rate at 11.03 p.c., The Hindu, 3 January, 2010,<br />
</font><a href="http://beta.thehindu.com/news/states/other-states/article74958.ece"><font face="arial,helvetica,sans-serif" size="3">http://beta.thehindu.com/news/states/other-states/article74958.ece</font></a><font face="arial,helvetica,sans-serif" size="3"> </font>
</p>
<p align="justify">
<font face="arial,helvetica,sans-serif" size="3">Road to development, The Business Standard, 6 January, 2010, </font><a href="http://www.business-standard.com/india/news/road-to-development/381731/"><font face="arial,helvetica,sans-serif" size="3">http://www.business-standard.com/india/news/road-to-development/381731/</font></a><font face="arial,helvetica,sans-serif" size="3"> <br />
&nbsp;<br />
Hope for poor states, The Economic Times, 5 January, 2010,<br />
</font><a href="http://economictimes.indiatimes.com/opinion/editorial/Hope-for-poor-states/articleshow/5411079.cms"><font face="arial,helvetica,sans-serif" size="3">http://economictimes.indiatimes.com/opinion/editorial/Hope-for-poor-states/articleshow/5411079.cms</font></a><font face="arial,helvetica,sans-serif" size="3">&nbsp; <br />
&nbsp;<br />
New miracle economies: Bihar, poor states by SA Aiyar, The Times of India, 3 Jauary, 2010, </font><a href="http://blogs.timesofindia.indiatimes.com/Swaminomics/entry/new-miracle-economies-bihar-poor"><font face="arial,helvetica,sans-serif" size="3">http://blogs.timesofindia.indiatimes.com/Swaminomics/entry/new-miracle-economies-bihar-poor</font></a><font face="arial,helvetica,sans-serif" size="3">&nbsp; <br />
&nbsp;<br />
Bihar grew by 11.03%, next only to Gujarat, The Times of India, 3 January, 2010,</font>
</p>
<p align="justify">
<a href="http://timesofindia.indiatimes.com/biz/india-business/Bihar-grew-by-1103-next-only-to-Gujarat/articleshow/5405973.cms"><font face="arial,helvetica,sans-serif" size="3">http://timesofindia.indiatimes.com/biz/india-business/Bihar-grew-by-1103-next-only-to-Gujarat/articleshow/5405973.cms</font></a><font face="arial,helvetica,sans-serif" size="3">&nbsp; </font>
</p>
<p align="justify">
<font face="arial,helvetica,sans-serif" size="3">Mind The Shadows by Lola Nayar, Outlook India,<br />
</font><a href="http://www.outlookindia.com/article.aspx?263643"><font face="arial,helvetica,sans-serif" size="3">http://www.outlookindia.com/article.aspx?263643</font></a><br />
<font face="arial,helvetica,sans-serif" size="3">&nbsp;<br />
Bihar, a growth story by Raj Kumar, The Times of India, 11 January, 2010,</font>
</p>
<p align="justify">
<a href="http://timesofindia.indiatimes.com/home/sunday-toi/special-report/Bihar-a-growth-story/articleshow/5428960.cms"><font face="arial,helvetica,sans-serif" size="3">http://timesofindia.indiatimes.com/home/sunday-toi/special-report/Bihar-a-growth-story/articleshow/5428960.cms</font></a><font face="arial,helvetica,sans-serif" size="3">&nbsp; <br />
&nbsp;<br />
How Bihar can rise as a developed state by Kailash Nautiyal, Rediff.com,</font>
</p>
<p align="justify">
<a href="http://business.rediff.com/slide-show/2010/jan/04/slide-show-1-how-bihar-can-rise-as-a-developed-state.htm#contentTop"><font face="arial,helvetica,sans-serif" size="3">http://business.rediff.com/slide-show/2010/jan/04/slide-show-1-how-bihar-can-rise-as-a-developed-state.htm#contentTop</font></a><font face="arial,helvetica,sans-serif" size="3">&nbsp; <br />
&nbsp;</font>
</p>
',
'credit_writer' => '',
'article_img' => '',
'article_img_thumb' => '',
'status' => (int) 1,
'show_on_home' => (int) 1,
'lang' => 'EN',
'category_id' => (int) 15,
'tag_keyword' => '',
'seo_url' => 'bihars-miraculous-economic-growth-myth-or-reality-1017',
'meta_title' => null,
'meta_keywords' => null,
'meta_description' => null,
'noindex' => (int) 0,
'publish_date' => object(Cake\I18n\FrozenDate) {},
'most_visit_section_id' => null,
'article_big_img' => null,
'liveid' => (int) 1017,
'created' => object(Cake\I18n\FrozenTime) {},
'modified' => object(Cake\I18n\FrozenTime) {},
'edate' => '',
'tags' => [],
'category' => object(App\Model\Entity\Category) {},
'[new]' => false,
'[accessible]' => [
'*' => true,
'id' => false
],
'[dirty]' => [],
'[original]' => [],
'[virtual]' => [],
'[hasErrors]' => false,
'[errors]' => [],
'[invalid]' => [],
'[repository]' => 'Articles'
}
$articleid = (int) 943
$metaTitle = 'News Alerts | Bihar’s miraculous economic growth: Myth or reality?'
$metaKeywords = null
$metaDesc = '
A section of the media seems to be mighty impressed with Bihar&rsquo;s miraculous (11.03%) average annual growth during the 2004-05 to 2008-09, supposedly akin to that of Gujarat (11.05%) but is there a catch in this stunning statistics? (See the...'
$disp = '<p align="justify"><br /><font >A section of the media seems to be mighty impressed with Bihar&rsquo;s miraculous (11.03%) average annual growth during the 2004-05 to 2008-09, supposedly akin to that of Gujarat (11.05%) but is there a catch in this stunning statistics? <em>(See the graph below)</em>. </font></p><p align="justify"><font >While the media has quoted the Gross State Domestic Product at factor cost (at constant 1999-2000 prices) as provided by the Central Statistical Organization (CSO), but the corresponding GSDP figures for Gujarat have yet to arrive. And hence, it will be a mistake to compare the average annual growth rate of Bihar from 2004-05 to 2008-09 with the average annual growth rate of Gujarat from 2004-05 to 2007-08. Besides, Bihar figures pertain to a much lower base of previous years. (The CSO does not generate data but merely reissues figures provided by the states.)&nbsp; </font></p><p align="justify"><font ><br />The National Human Development Report 2001 of the Planning Commission shows that Bihar comes at the bottom of the Human Development Index (HDI) among the 15 states which were studied. Bihar's HDI (0.367) comes below the HDI of Madhya Pradesh (0.394, Rank: 12), Orissa (0.404, Rank: 11) and Rajasthan (0.424, Rank: 9). Bihar is way below the average national HDI (0.472). This, obviously, strengthens the case for looking at the discrepancy between GSDP growth rate and actual development on the ground. For instance we can&rsquo;t forget that about half the population of Bihar figures below the poverty line and over 56 per cent of Bihar&rsquo;s children below the age of three years are underweight. </font></p><p align="justify"><font >Even on the statistics front, there are other states too who's GSDP at factor cost (at 1999-2000 prices) data for the year 2008-09 is yet to arrive. Some of them are: Madhya Pradesh, Maharastra, West Bengal etc. From a research point of view, it is not proper to compare Bihar with any other state in the absence of corresponding data. </font></p><p align="justify"><font >Instead of taking the period 2004-05 to 2008-09, if the period 1999-2000 and 2008-09 is considered, then Bihar's average annual growth rate falls down from 11.03% to 8.13%. Similarly, if the period for growth calculation is changed, then Gujarat's average annual growth rate reduces from 11.05% to 8.83% and India's average annual growth rate reduces from 8.49% to 7.09%. </font></p><p align="justify"><font >If we look at the various components of Bihar's GSDP (at 1999-2000 prices), we get some alarming results. Agriculture and allied activities' economic progress have been dismal in the recent years. This means that the state&rsquo;s shrinking agriculture sector, on which about 80 per cent of the state&rsquo;s population depends for livelihood, continues to stagnate. During 2005-06, the growth experienced by this sector was (-) 10.82 percent, while during 2007-08 it was (-) 8.72%. For the same years, industry in Bihar grew by 28.26% and 17.83% whereas services grew by 3.09% and 14.73%, respectively. The percentage share of Agriculture and Allied activities in the entire GSDP at factor cost (at 1999-2000 constant prices) has declined from 38.8% in 2000-01 to 26.2% in 2008-09. </font></p><p align="justify"><br /><font >The average annual growth rate of GSDP from construction (at 1999-2000 prices) between 2004-05 and 2008-09 was 36.16%. If the period is changed to between 1999-2000 and 2008-09, then the average annual growth rate of GSDP from construction turns out to be 24.44%. The percentage share of construction in the overall GSDP of Bihar has increased from 3.8% in 1999-2000 to 12.6% in 2008-09. </font></p><p align="justify"><font >The percentage share of Banking and Insurance in the entire GSDP of Bihar has more or less remained the same over the years. This sector plays a crucial role in industrial growth. We find that the percentage share of GSDP from registered manufacturing in the total GSDP of Bihar to be falling from 2.3% in 1999-2000 to 0.7% in 2008-09. The average annual growth rate of registered manufacturing GSDP during the period 2004-05 to 2008-09 has been merely 4.06%, which is much lesser than the average annual growth rate of GSDP from Agriculture and allied activities during the same period, i.e. 7.29%.&nbsp;&nbsp;&nbsp; </font></p><p align="justify"><font >The annual average growth of GSDP from unregistered manufacturing during the period 2004-05 to 2008-09 was 8.12%. The percentage share of GSDP from unregistered manufacturing in the total GSDP of Bihar has declined from 4.9% in 1999-2000 to 4.0% in 2008-09.</font> </p><p align="justify"><font >The percentage share of Public Administration in the GSDP of Bihar has been declining overtime. </font></p><p align="justify"><font ><strong>Graph 1: Economic growth faced by Bihar, Gujarat and India in different years</strong></font> </p><p align="justify"><font ><img style="width: 652px; height: 311px" src="https://im4change.in/siteadmin/tinymce/uploaded/Bihar eco gr.bmp" alt="Bihar eco gr" width="978" height="453" /><br /><em><strong>Source: </strong></em></font><a href="http://www.mospi.nic.in/" title="http://www.mospi.nic.in/">www.mospi.nic.in</a><font ><em> </em></font></p><p align="justify"><br /><font ><em>Further readings: </em></font></p><p align="justify"><font >GSDP data of various states of India,<br /></font><a href="http://www.mospi.nic.in/State-wise_SDP_1999-2000_20nov09.pdf" title="http://www.mospi.nic.in/State-wise_SDP_1999-2000_20nov09.pdf">http://www.mospi.nic.in/State-wise_SDP_1999-2000_20nov09.pdf</a><font > </font></p><p align="justify"><font >Economic Survey of Bihar 2008-09, Government of Bihar<br /></font><a href="http://www.indiaenvironmentportal.org.in/files/ESR-2008-09-EN.pdf" title="http://www.indiaenvironmentportal.org.in/files/ESR-2008-09-EN.pdf">http://www.indiaenvironmentportal.org.in/files/ESR-2008-09-EN.pdf</a> </p><p align="justify"><font >National Human Development Report 2001, Planning Commission,<br /></font><a href="https://im4change.in/docs/nhd2001.pdf" title="https://im4change.in/docs/nhd2001.pdf">http://www.im4change.org/docs/nhd2001.pdf</a><br /><font >&nbsp;<br />Bihar&rsquo;s miracle: growth rate at 11.03 p.c., The Hindu, 3 January, 2010,<br /></font><a href="http://beta.thehindu.com/news/states/other-states/article74958.ece" title="http://beta.thehindu.com/news/states/other-states/article74958.ece">http://beta.thehindu.com/news/states/other-states/article7<br />4958.ece</a><font > </font></p><p align="justify"><font >Road to development, The Business Standard, 6 January, 2010, </font><a href="http://www.business-standard.com/india/news/road-to-development/381731/" title="http://www.business-standard.com/india/news/road-to-development/381731/">http://www.business-standard.com/india/news/road-to-develo<br />pment/381731/</a><font > <br />&nbsp;<br />Hope for poor states, The Economic Times, 5 January, 2010,<br /></font><a href="http://economictimes.indiatimes.com/opinion/editorial/Hope-for-poor-states/articleshow/5411079.cms" title="http://economictimes.indiatimes.com/opinion/editorial/Hope-for-poor-states/articleshow/5411079.cms">http://economictimes.indiatimes.com/opinion/editorial/Hope<br />-for-poor-states/articleshow/5411079.cms</a><font >&nbsp; <br />&nbsp;<br />New miracle economies: Bihar, poor states by SA Aiyar, The Times of India, 3 Jauary, 2010, </font><a href="http://blogs.timesofindia.indiatimes.com/Swaminomics/entry/new-miracle-economies-bihar-poor" title="http://blogs.timesofindia.indiatimes.com/Swaminomics/entry/new-miracle-economies-bihar-poor">http://blogs.timesofindia.indiatimes.com/Swaminomics/entry<br />/new-miracle-economies-bihar-poor</a><font >&nbsp; <br />&nbsp;<br />Bihar grew by 11.03%, next only to Gujarat, The Times of India, 3 January, 2010,</font> </p><p align="justify"><a href="http://timesofindia.indiatimes.com/biz/india-business/Bihar-grew-by-1103-next-only-to-Gujarat/articleshow/5405973.cms" title="http://timesofindia.indiatimes.com/biz/india-business/Bihar-grew-by-1103-next-only-to-Gujarat/articleshow/5405973.cms">http://timesofindia.indiatimes.com/biz/india-business/Biha<br />r-grew-by-1103-next-only-to-Gujarat/articleshow/5405973.cm<br />s</a><font >&nbsp; </font></p><p align="justify"><font >Mind The Shadows by Lola Nayar, Outlook India,<br /></font><a href="http://www.outlookindia.com/article.aspx?263643" title="http://www.outlookindia.com/article.aspx?263643">http://www.outlookindia.com/article.aspx?263643</a><br /><font >&nbsp;<br />Bihar, a growth story by Raj Kumar, The Times of India, 11 January, 2010,</font> </p><p align="justify"><a href="http://timesofindia.indiatimes.com/home/sunday-toi/special-report/Bihar-a-growth-story/articleshow/5428960.cms" title="http://timesofindia.indiatimes.com/home/sunday-toi/special-report/Bihar-a-growth-story/articleshow/5428960.cms">http://timesofindia.indiatimes.com/home/sunday-toi/special<br />-report/Bihar-a-growth-story/articleshow/5428960.cms</a><font >&nbsp; <br />&nbsp;<br />How Bihar can rise as a developed state by Kailash Nautiyal, Rediff.com,</font> </p><p align="justify"><a href="http://business.rediff.com/slide-show/2010/jan/04/slide-show-1-how-bihar-can-rise-as-a-developed-state.htm#contentTop" title="http://business.rediff.com/slide-show/2010/jan/04/slide-show-1-how-bihar-can-rise-as-a-developed-state.htm#contentTop">http://business.rediff.com/slide-show/2010/jan/04/slide-sh<br />ow-1-how-bihar-can-rise-as-a-developed-state.htm#contentTo<br />p</a><font >&nbsp; <br />&nbsp;</font> </p>'
$lang = 'English'
$SITE_URL = 'https://im4change.in/'
$site_title = 'im4change'
$adminprix = 'admin'</pre><pre class="stack-trace">include - APP/Template/Layout/printlayout.ctp, line 8
Cake\View\View::_evaluate() - CORE/src/View/View.php, line 1413
Cake\View\View::_render() - CORE/src/View/View.php, line 1374
Cake\View\View::renderLayout() - CORE/src/View/View.php, line 927
Cake\View\View::render() - CORE/src/View/View.php, line 885
Cake\Controller\Controller::render() - CORE/src/Controller/Controller.php, line 791
Cake\Http\ActionDispatcher::_invoke() - CORE/src/Http/ActionDispatcher.php, line 126
Cake\Http\ActionDispatcher::dispatch() - CORE/src/Http/ActionDispatcher.php, line 94
Cake\Http\BaseApplication::__invoke() - CORE/src/Http/BaseApplication.php, line 235
Cake\Http\Runner::__invoke() - CORE/src/Http/Runner.php, line 65
Cake\Routing\Middleware\RoutingMiddleware::__invoke() - CORE/src/Routing/Middleware/RoutingMiddleware.php, line 162
Cake\Http\Runner::__invoke() - CORE/src/Http/Runner.php, line 65
Cake\Routing\Middleware\AssetMiddleware::__invoke() - CORE/src/Routing/Middleware/AssetMiddleware.php, line 88
Cake\Http\Runner::__invoke() - CORE/src/Http/Runner.php, line 65
Cake\Error\Middleware\ErrorHandlerMiddleware::__invoke() - CORE/src/Error/Middleware/ErrorHandlerMiddleware.php, line 96
Cake\Http\Runner::__invoke() - CORE/src/Http/Runner.php, line 65
Cake\Http\Runner::run() - CORE/src/Http/Runner.php, line 51</pre></div></pre>news-alerts/bihars-miraculous-economic-growth-myth-or-reality-1017.html"/>
<meta http-equiv="Content-Type" content="text/html; charset=utf-8"/>
<link href="https://im4change.in/css/control.css" rel="stylesheet" type="text/css"
media="all"/>
<title>News Alerts | Bihar’s miraculous economic growth: Myth or reality? | Im4change.org</title>
<meta name="description" content="
A section of the media seems to be mighty impressed with Bihar’s miraculous (11.03%) average annual growth during the 2004-05 to 2008-09, supposedly akin to that of Gujarat (11.05%) but is there a catch in this stunning statistics? (See the..."/>
<script src="https://im4change.in/js/jquery-1.10.2.js"></script>
<script type="text/javascript" src="https://im4change.in/js/jquery-migrate.min.js"></script>
<script language="javascript" type="text/javascript">
$(document).ready(function () {
var img = $("img")[0]; // Get my img elem
var pic_real_width, pic_real_height;
$("<img/>") // Make in memory copy of image to avoid css issues
.attr("src", $(img).attr("src"))
.load(function () {
pic_real_width = this.width; // Note: $(this).width() will not
pic_real_height = this.height; // work for in memory images.
});
});
</script>
<style type="text/css">
@media screen {
div.divFooter {
display: block;
}
}
@media print {
.printbutton {
display: none !important;
}
}
</style>
</head>
<body>
<table cellpadding="0" cellspacing="0" border="0" width="98%" align="center">
<tr>
<td class="top_bg">
<div class="divFooter">
<img src="https://im4change.in/images/logo1.jpg" height="59" border="0"
alt="Resource centre on India's rural distress" style="padding-top:14px;"/>
</div>
</td>
</tr>
<tr>
<td id="topspace"> </td>
</tr>
<tr id="topspace">
<td> </td>
</tr>
<tr>
<td height="50" style="border-bottom:1px solid #000; padding-top:10px;" class="printbutton">
<form><input type="button" value=" Print this page "
onclick="window.print();return false;"/></form>
</td>
</tr>
<tr>
<td width="100%">
<h1 class="news_headlines" style="font-style:normal">
<strong>Bihar’s miraculous economic growth: Myth or reality?</strong></h1>
</td>
</tr>
<tr>
<td width="100%" style="font-family:Arial, 'Segoe Script', 'Segoe UI', sans-serif, serif"><font size="3">
<p align="justify"><br /><font >A section of the media seems to be mighty impressed with Bihar’s miraculous (11.03%) average annual growth during the 2004-05 to 2008-09, supposedly akin to that of Gujarat (11.05%) but is there a catch in this stunning statistics? <em>(See the graph below)</em>. </font></p><p align="justify"><font >While the media has quoted the Gross State Domestic Product at factor cost (at constant 1999-2000 prices) as provided by the Central Statistical Organization (CSO), but the corresponding GSDP figures for Gujarat have yet to arrive. And hence, it will be a mistake to compare the average annual growth rate of Bihar from 2004-05 to 2008-09 with the average annual growth rate of Gujarat from 2004-05 to 2007-08. Besides, Bihar figures pertain to a much lower base of previous years. (The CSO does not generate data but merely reissues figures provided by the states.) </font></p><p align="justify"><font ><br />The National Human Development Report 2001 of the Planning Commission shows that Bihar comes at the bottom of the Human Development Index (HDI) among the 15 states which were studied. Bihar's HDI (0.367) comes below the HDI of Madhya Pradesh (0.394, Rank: 12), Orissa (0.404, Rank: 11) and Rajasthan (0.424, Rank: 9). Bihar is way below the average national HDI (0.472). This, obviously, strengthens the case for looking at the discrepancy between GSDP growth rate and actual development on the ground. For instance we can’t forget that about half the population of Bihar figures below the poverty line and over 56 per cent of Bihar’s children below the age of three years are underweight. </font></p><p align="justify"><font >Even on the statistics front, there are other states too who's GSDP at factor cost (at 1999-2000 prices) data for the year 2008-09 is yet to arrive. Some of them are: Madhya Pradesh, Maharastra, West Bengal etc. From a research point of view, it is not proper to compare Bihar with any other state in the absence of corresponding data. </font></p><p align="justify"><font >Instead of taking the period 2004-05 to 2008-09, if the period 1999-2000 and 2008-09 is considered, then Bihar's average annual growth rate falls down from 11.03% to 8.13%. Similarly, if the period for growth calculation is changed, then Gujarat's average annual growth rate reduces from 11.05% to 8.83% and India's average annual growth rate reduces from 8.49% to 7.09%. </font></p><p align="justify"><font >If we look at the various components of Bihar's GSDP (at 1999-2000 prices), we get some alarming results. Agriculture and allied activities' economic progress have been dismal in the recent years. This means that the state’s shrinking agriculture sector, on which about 80 per cent of the state’s population depends for livelihood, continues to stagnate. During 2005-06, the growth experienced by this sector was (-) 10.82 percent, while during 2007-08 it was (-) 8.72%. For the same years, industry in Bihar grew by 28.26% and 17.83% whereas services grew by 3.09% and 14.73%, respectively. The percentage share of Agriculture and Allied activities in the entire GSDP at factor cost (at 1999-2000 constant prices) has declined from 38.8% in 2000-01 to 26.2% in 2008-09. </font></p><p align="justify"><br /><font >The average annual growth rate of GSDP from construction (at 1999-2000 prices) between 2004-05 and 2008-09 was 36.16%. If the period is changed to between 1999-2000 and 2008-09, then the average annual growth rate of GSDP from construction turns out to be 24.44%. The percentage share of construction in the overall GSDP of Bihar has increased from 3.8% in 1999-2000 to 12.6% in 2008-09. </font></p><p align="justify"><font >The percentage share of Banking and Insurance in the entire GSDP of Bihar has more or less remained the same over the years. This sector plays a crucial role in industrial growth. We find that the percentage share of GSDP from registered manufacturing in the total GSDP of Bihar to be falling from 2.3% in 1999-2000 to 0.7% in 2008-09. The average annual growth rate of registered manufacturing GSDP during the period 2004-05 to 2008-09 has been merely 4.06%, which is much lesser than the average annual growth rate of GSDP from Agriculture and allied activities during the same period, i.e. 7.29%. </font></p><p align="justify"><font >The annual average growth of GSDP from unregistered manufacturing during the period 2004-05 to 2008-09 was 8.12%. The percentage share of GSDP from unregistered manufacturing in the total GSDP of Bihar has declined from 4.9% in 1999-2000 to 4.0% in 2008-09.</font> </p><p align="justify"><font >The percentage share of Public Administration in the GSDP of Bihar has been declining overtime. </font></p><p align="justify"><font ><strong>Graph 1: Economic growth faced by Bihar, Gujarat and India in different years</strong></font> </p><p align="justify"><font ><img style="width: 652px; height: 311px" src="https://im4change.in/siteadmin/tinymce/uploaded/Bihar eco gr.bmp" alt="Bihar eco gr" width="978" height="453" /><br /><em><strong>Source: </strong></em></font><a href="http://www.mospi.nic.in/" title="http://www.mospi.nic.in/">www.mospi.nic.in</a><font ><em> </em></font></p><p align="justify"><br /><font ><em>Further readings: </em></font></p><p align="justify"><font >GSDP data of various states of India,<br /></font><a href="http://www.mospi.nic.in/State-wise_SDP_1999-2000_20nov09.pdf" title="http://www.mospi.nic.in/State-wise_SDP_1999-2000_20nov09.pdf">http://www.mospi.nic.in/State-wise_SDP_1999-2000_20nov09.pdf</a><font > </font></p><p align="justify"><font >Economic Survey of Bihar 2008-09, Government of Bihar<br /></font><a href="http://www.indiaenvironmentportal.org.in/files/ESR-2008-09-EN.pdf" title="http://www.indiaenvironmentportal.org.in/files/ESR-2008-09-EN.pdf">http://www.indiaenvironmentportal.org.in/files/ESR-2008-09-EN.pdf</a> </p><p align="justify"><font >National Human Development Report 2001, Planning Commission,<br /></font><a href="https://im4change.in/docs/nhd2001.pdf" title="https://im4change.in/docs/nhd2001.pdf">http://www.im4change.org/docs/nhd2001.pdf</a><br /><font > <br />Bihar’s miracle: growth rate at 11.03 p.c., The Hindu, 3 January, 2010,<br /></font><a href="http://beta.thehindu.com/news/states/other-states/article74958.ece" title="http://beta.thehindu.com/news/states/other-states/article74958.ece">http://beta.thehindu.com/news/states/other-states/article7<br />4958.ece</a><font > </font></p><p align="justify"><font >Road to development, The Business Standard, 6 January, 2010, </font><a href="http://www.business-standard.com/india/news/road-to-development/381731/" title="http://www.business-standard.com/india/news/road-to-development/381731/">http://www.business-standard.com/india/news/road-to-develo<br />pment/381731/</a><font > <br /> <br />Hope for poor states, The Economic Times, 5 January, 2010,<br /></font><a href="http://economictimes.indiatimes.com/opinion/editorial/Hope-for-poor-states/articleshow/5411079.cms" title="http://economictimes.indiatimes.com/opinion/editorial/Hope-for-poor-states/articleshow/5411079.cms">http://economictimes.indiatimes.com/opinion/editorial/Hope<br />-for-poor-states/articleshow/5411079.cms</a><font > <br /> <br />New miracle economies: Bihar, poor states by SA Aiyar, The Times of India, 3 Jauary, 2010, </font><a href="http://blogs.timesofindia.indiatimes.com/Swaminomics/entry/new-miracle-economies-bihar-poor" title="http://blogs.timesofindia.indiatimes.com/Swaminomics/entry/new-miracle-economies-bihar-poor">http://blogs.timesofindia.indiatimes.com/Swaminomics/entry<br />/new-miracle-economies-bihar-poor</a><font > <br /> <br />Bihar grew by 11.03%, next only to Gujarat, The Times of India, 3 January, 2010,</font> </p><p align="justify"><a href="http://timesofindia.indiatimes.com/biz/india-business/Bihar-grew-by-1103-next-only-to-Gujarat/articleshow/5405973.cms" title="http://timesofindia.indiatimes.com/biz/india-business/Bihar-grew-by-1103-next-only-to-Gujarat/articleshow/5405973.cms">http://timesofindia.indiatimes.com/biz/india-business/Biha<br />r-grew-by-1103-next-only-to-Gujarat/articleshow/5405973.cm<br />s</a><font > </font></p><p align="justify"><font >Mind The Shadows by Lola Nayar, Outlook India,<br /></font><a href="http://www.outlookindia.com/article.aspx?263643" title="http://www.outlookindia.com/article.aspx?263643">http://www.outlookindia.com/article.aspx?263643</a><br /><font > <br />Bihar, a growth story by Raj Kumar, The Times of India, 11 January, 2010,</font> </p><p align="justify"><a href="http://timesofindia.indiatimes.com/home/sunday-toi/special-report/Bihar-a-growth-story/articleshow/5428960.cms" title="http://timesofindia.indiatimes.com/home/sunday-toi/special-report/Bihar-a-growth-story/articleshow/5428960.cms">http://timesofindia.indiatimes.com/home/sunday-toi/special<br />-report/Bihar-a-growth-story/articleshow/5428960.cms</a><font > <br /> <br />How Bihar can rise as a developed state by Kailash Nautiyal, Rediff.com,</font> </p><p align="justify"><a href="http://business.rediff.com/slide-show/2010/jan/04/slide-show-1-how-bihar-can-rise-as-a-developed-state.htm#contentTop" title="http://business.rediff.com/slide-show/2010/jan/04/slide-show-1-how-bihar-can-rise-as-a-developed-state.htm#contentTop">http://business.rediff.com/slide-show/2010/jan/04/slide-sh<br />ow-1-how-bihar-can-rise-as-a-developed-state.htm#contentTo<br />p</a><font > <br /> </font> </p> </font>
</td>
</tr>
<tr>
<td> </td>
</tr>
<tr>
<td height="50" style="border-top:1px solid #000; border-bottom:1px solid #000;padding-top:10px;">
<form><input type="button" value=" Print this page "
onclick="window.print();return false;"/></form>
</td>
</tr>
</table></body>
</html>'
}
$cookies = []
$values = [
(int) 0 => 'text/html; charset=UTF-8'
]
$name = 'Content-Type'
$first = true
$value = 'text/html; charset=UTF-8'
header - [internal], line ??
Cake\Http\ResponseEmitter::emitHeaders() - CORE/src/Http/ResponseEmitter.php, line 181
Cake\Http\ResponseEmitter::emit() - CORE/src/Http/ResponseEmitter.php, line 55
Cake\Http\Server::emit() - CORE/src/Http/Server.php, line 141
[main] - ROOT/webroot/index.php, line 39
Notice (8): Undefined variable: urlPrefix [APP/Template/Layout/printlayout.ctp, line 8]
$viewFile = '/home/brlfuser/public_html/src/Template/Layout/printlayout.ctp'
$dataForView = [
'article_current' => object(App\Model\Entity\Article) {
'id' => (int) 943,
'title' => 'Bihar’s miraculous economic growth: Myth or reality?',
'subheading' => '',
'description' => '<p align="justify">
<br />
<font face="arial,helvetica,sans-serif" size="3">A section of the media seems to be mighty impressed with Bihar’s miraculous (11.03%) average annual growth during the 2004-05 to 2008-09, supposedly akin to that of Gujarat (11.05%) but is there a catch in this stunning statistics? <em>(See the graph below)</em>. </font>
</p>
<p align="justify">
<font face="arial,helvetica,sans-serif" size="3">While the media has quoted the Gross State Domestic Product at factor cost (at constant 1999-2000 prices) as provided by the Central Statistical Organization (CSO), but the corresponding GSDP figures for Gujarat have yet to arrive. And hence, it will be a mistake to compare the average annual growth rate of Bihar from 2004-05 to 2008-09 with the average annual growth rate of Gujarat from 2004-05 to 2007-08. Besides, Bihar figures pertain to a much lower base of previous years. (The CSO does not generate data but merely reissues figures provided by the states.) </font>
</p>
<p align="justify">
<font face="arial,helvetica,sans-serif" size="3"><br />
The National Human Development Report 2001 of the Planning Commission shows that Bihar comes at the bottom of the Human Development Index (HDI) among the 15 states which were studied. Bihar's HDI (0.367) comes below the HDI of Madhya Pradesh (0.394, Rank: 12), Orissa (0.404, Rank: 11) and Rajasthan (0.424, Rank: 9). Bihar is way below the average national HDI (0.472). This, obviously, strengthens the case for looking at the discrepancy between GSDP growth rate and actual development on the ground. For instance we can’t forget that about half the population of Bihar figures below the poverty line and over 56 per cent of Bihar’s children below the age of three years are underweight. </font>
</p>
<p align="justify">
<font face="arial,helvetica,sans-serif" size="3">Even on the statistics front, there are other states too who's GSDP at factor cost (at 1999-2000 prices) data for the year 2008-09 is yet to arrive. Some of them are: Madhya Pradesh, Maharastra, West Bengal etc. From a research point of view, it is not proper to compare Bihar with any other state in the absence of corresponding data. </font>
</p>
<p align="justify">
<font face="arial,helvetica,sans-serif" size="3">Instead of taking the period 2004-05 to 2008-09, if the period 1999-2000 and 2008-09 is considered, then Bihar's average annual growth rate falls down from 11.03% to 8.13%. Similarly, if the period for growth calculation is changed, then Gujarat's average annual growth rate reduces from 11.05% to 8.83% and India's average annual growth rate reduces from 8.49% to 7.09%. </font>
</p>
<p align="justify">
<font face="arial,helvetica,sans-serif" size="3">If we look at the various components of Bihar's GSDP (at 1999-2000 prices), we get some alarming results. Agriculture and allied activities' economic progress have been dismal in the recent years. This means that the state’s shrinking agriculture sector, on which about 80 per cent of the state’s population depends for livelihood, continues to stagnate. During 2005-06, the growth experienced by this sector was (-) 10.82 percent, while during 2007-08 it was (-) 8.72%. For the same years, industry in Bihar grew by 28.26% and 17.83% whereas services grew by 3.09% and 14.73%, respectively. The percentage share of Agriculture and Allied activities in the entire GSDP at factor cost (at 1999-2000 constant prices) has declined from 38.8% in 2000-01 to 26.2% in 2008-09. </font>
</p>
<p align="justify">
<br />
<font face="arial,helvetica,sans-serif" size="3">The average annual growth rate of GSDP from construction (at 1999-2000 prices) between 2004-05 and 2008-09 was 36.16%. If the period is changed to between 1999-2000 and 2008-09, then the average annual growth rate of GSDP from construction turns out to be 24.44%. The percentage share of construction in the overall GSDP of Bihar has increased from 3.8% in 1999-2000 to 12.6% in 2008-09. </font>
</p>
<p align="justify">
<font face="arial,helvetica,sans-serif" size="3">The percentage share of Banking and Insurance in the entire GSDP of Bihar has more or less remained the same over the years. This sector plays a crucial role in industrial growth. We find that the percentage share of GSDP from registered manufacturing in the total GSDP of Bihar to be falling from 2.3% in 1999-2000 to 0.7% in 2008-09. The average annual growth rate of registered manufacturing GSDP during the period 2004-05 to 2008-09 has been merely 4.06%, which is much lesser than the average annual growth rate of GSDP from Agriculture and allied activities during the same period, i.e. 7.29%. </font>
</p>
<p align="justify">
<font face="arial,helvetica,sans-serif" size="3">The annual average growth of GSDP from unregistered manufacturing during the period 2004-05 to 2008-09 was 8.12%. The percentage share of GSDP from unregistered manufacturing in the total GSDP of Bihar has declined from 4.9% in 1999-2000 to 4.0% in 2008-09.</font>
</p>
<p align="justify">
<font face="arial,helvetica,sans-serif" size="3">The percentage share of Public Administration in the GSDP of Bihar has been declining overtime. </font>
</p>
<p align="justify">
<font face="arial,helvetica,sans-serif" size="3"><strong>Graph 1: Economic growth faced by Bihar, Gujarat and India in different years</strong></font>
</p>
<p align="justify">
<font face="arial,helvetica,sans-serif" size="3"><img style="width: 652px; height: 311px" src="tinymce/uploaded/Bihar eco gr.bmp" alt="Bihar eco gr" width="978" height="453" /><br />
<em><strong>Source: </strong></em></font><a href="http://www.mospi.nic.in/"><font face="arial,helvetica,sans-serif" size="3"><em>www.mospi.nic.in</em></font></a><font face="arial,helvetica,sans-serif" size="3"><em> </em></font>
</p>
<p align="justify">
<br />
<font face="arial,helvetica,sans-serif" size="3"><em>Further readings: </em></font>
</p>
<p align="justify">
<font face="arial,helvetica,sans-serif" size="3">GSDP data of various states of India,<br />
</font><a href="http://www.mospi.nic.in/State-wise_SDP_1999-2000_20nov09.pdf"><font face="arial,helvetica,sans-serif" size="3">http://www.mospi.nic.in/State-wise_SDP_1999-2000_20nov09.pdf</font></a><font face="arial,helvetica,sans-serif" size="3"> </font>
</p>
<p align="justify">
<font face="arial,helvetica,sans-serif" size="3">Economic Survey of Bihar 2008-09, Government of Bihar<br />
</font><a href="http://www.indiaenvironmentportal.org.in/files/ESR-2008-09-EN.pdf"><font face="arial,helvetica,sans-serif" size="3">http://www.indiaenvironmentportal.org.in/files/ESR-2008-09-EN.pdf</font></a>
</p>
<p align="justify">
<font face="arial,helvetica,sans-serif" size="3">National Human Development Report 2001, Planning Commission,<br />
</font><a href="../docs/nhd2001.pdf"><font face="arial,helvetica,sans-serif" size="3">http://www.im4change.org/docs/nhd2001.pdf</font></a><br />
<font face="arial,helvetica,sans-serif" size="3"> <br />
Bihar’s miracle: growth rate at 11.03 p.c., The Hindu, 3 January, 2010,<br />
</font><a href="http://beta.thehindu.com/news/states/other-states/article74958.ece"><font face="arial,helvetica,sans-serif" size="3">http://beta.thehindu.com/news/states/other-states/article74958.ece</font></a><font face="arial,helvetica,sans-serif" size="3"> </font>
</p>
<p align="justify">
<font face="arial,helvetica,sans-serif" size="3">Road to development, The Business Standard, 6 January, 2010, </font><a href="http://www.business-standard.com/india/news/road-to-development/381731/"><font face="arial,helvetica,sans-serif" size="3">http://www.business-standard.com/india/news/road-to-development/381731/</font></a><font face="arial,helvetica,sans-serif" size="3"> <br />
<br />
Hope for poor states, The Economic Times, 5 January, 2010,<br />
</font><a href="http://economictimes.indiatimes.com/opinion/editorial/Hope-for-poor-states/articleshow/5411079.cms"><font face="arial,helvetica,sans-serif" size="3">http://economictimes.indiatimes.com/opinion/editorial/Hope-for-poor-states/articleshow/5411079.cms</font></a><font face="arial,helvetica,sans-serif" size="3"> <br />
<br />
New miracle economies: Bihar, poor states by SA Aiyar, The Times of India, 3 Jauary, 2010, </font><a href="http://blogs.timesofindia.indiatimes.com/Swaminomics/entry/new-miracle-economies-bihar-poor"><font face="arial,helvetica,sans-serif" size="3">http://blogs.timesofindia.indiatimes.com/Swaminomics/entry/new-miracle-economies-bihar-poor</font></a><font face="arial,helvetica,sans-serif" size="3"> <br />
<br />
Bihar grew by 11.03%, next only to Gujarat, The Times of India, 3 January, 2010,</font>
</p>
<p align="justify">
<a href="http://timesofindia.indiatimes.com/biz/india-business/Bihar-grew-by-1103-next-only-to-Gujarat/articleshow/5405973.cms"><font face="arial,helvetica,sans-serif" size="3">http://timesofindia.indiatimes.com/biz/india-business/Bihar-grew-by-1103-next-only-to-Gujarat/articleshow/5405973.cms</font></a><font face="arial,helvetica,sans-serif" size="3"> </font>
</p>
<p align="justify">
<font face="arial,helvetica,sans-serif" size="3">Mind The Shadows by Lola Nayar, Outlook India,<br />
</font><a href="http://www.outlookindia.com/article.aspx?263643"><font face="arial,helvetica,sans-serif" size="3">http://www.outlookindia.com/article.aspx?263643</font></a><br />
<font face="arial,helvetica,sans-serif" size="3"> <br />
Bihar, a growth story by Raj Kumar, The Times of India, 11 January, 2010,</font>
</p>
<p align="justify">
<a href="http://timesofindia.indiatimes.com/home/sunday-toi/special-report/Bihar-a-growth-story/articleshow/5428960.cms"><font face="arial,helvetica,sans-serif" size="3">http://timesofindia.indiatimes.com/home/sunday-toi/special-report/Bihar-a-growth-story/articleshow/5428960.cms</font></a><font face="arial,helvetica,sans-serif" size="3"> <br />
<br />
How Bihar can rise as a developed state by Kailash Nautiyal, Rediff.com,</font>
</p>
<p align="justify">
<a href="http://business.rediff.com/slide-show/2010/jan/04/slide-show-1-how-bihar-can-rise-as-a-developed-state.htm#contentTop"><font face="arial,helvetica,sans-serif" size="3">http://business.rediff.com/slide-show/2010/jan/04/slide-show-1-how-bihar-can-rise-as-a-developed-state.htm#contentTop</font></a><font face="arial,helvetica,sans-serif" size="3"> <br />
</font>
</p>
',
'credit_writer' => '',
'article_img' => '',
'article_img_thumb' => '',
'status' => (int) 1,
'show_on_home' => (int) 1,
'lang' => 'EN',
'category_id' => (int) 15,
'tag_keyword' => '',
'seo_url' => 'bihars-miraculous-economic-growth-myth-or-reality-1017',
'meta_title' => null,
'meta_keywords' => null,
'meta_description' => null,
'noindex' => (int) 0,
'publish_date' => object(Cake\I18n\FrozenDate) {},
'most_visit_section_id' => null,
'article_big_img' => null,
'liveid' => (int) 1017,
'created' => object(Cake\I18n\FrozenTime) {},
'modified' => object(Cake\I18n\FrozenTime) {},
'edate' => '',
'tags' => [[maximum depth reached]],
'category' => object(App\Model\Entity\Category) {},
'[new]' => false,
'[accessible]' => [
[maximum depth reached]
],
'[dirty]' => [[maximum depth reached]],
'[original]' => [[maximum depth reached]],
'[virtual]' => [[maximum depth reached]],
'[hasErrors]' => false,
'[errors]' => [[maximum depth reached]],
'[invalid]' => [[maximum depth reached]],
'[repository]' => 'Articles'
},
'articleid' => (int) 943,
'metaTitle' => 'News Alerts | Bihar’s miraculous economic growth: Myth or reality?',
'metaKeywords' => null,
'metaDesc' => '
A section of the media seems to be mighty impressed with Bihar’s miraculous (11.03%) average annual growth during the 2004-05 to 2008-09, supposedly akin to that of Gujarat (11.05%) but is there a catch in this stunning statistics? (See the...',
'disp' => '<p align="justify"><br /><font >A section of the media seems to be mighty impressed with Bihar’s miraculous (11.03%) average annual growth during the 2004-05 to 2008-09, supposedly akin to that of Gujarat (11.05%) but is there a catch in this stunning statistics? <em>(See the graph below)</em>. </font></p><p align="justify"><font >While the media has quoted the Gross State Domestic Product at factor cost (at constant 1999-2000 prices) as provided by the Central Statistical Organization (CSO), but the corresponding GSDP figures for Gujarat have yet to arrive. And hence, it will be a mistake to compare the average annual growth rate of Bihar from 2004-05 to 2008-09 with the average annual growth rate of Gujarat from 2004-05 to 2007-08. Besides, Bihar figures pertain to a much lower base of previous years. (The CSO does not generate data but merely reissues figures provided by the states.) </font></p><p align="justify"><font ><br />The National Human Development Report 2001 of the Planning Commission shows that Bihar comes at the bottom of the Human Development Index (HDI) among the 15 states which were studied. Bihar's HDI (0.367) comes below the HDI of Madhya Pradesh (0.394, Rank: 12), Orissa (0.404, Rank: 11) and Rajasthan (0.424, Rank: 9). Bihar is way below the average national HDI (0.472). This, obviously, strengthens the case for looking at the discrepancy between GSDP growth rate and actual development on the ground. For instance we can’t forget that about half the population of Bihar figures below the poverty line and over 56 per cent of Bihar’s children below the age of three years are underweight. </font></p><p align="justify"><font >Even on the statistics front, there are other states too who's GSDP at factor cost (at 1999-2000 prices) data for the year 2008-09 is yet to arrive. Some of them are: Madhya Pradesh, Maharastra, West Bengal etc. From a research point of view, it is not proper to compare Bihar with any other state in the absence of corresponding data. </font></p><p align="justify"><font >Instead of taking the period 2004-05 to 2008-09, if the period 1999-2000 and 2008-09 is considered, then Bihar's average annual growth rate falls down from 11.03% to 8.13%. Similarly, if the period for growth calculation is changed, then Gujarat's average annual growth rate reduces from 11.05% to 8.83% and India's average annual growth rate reduces from 8.49% to 7.09%. </font></p><p align="justify"><font >If we look at the various components of Bihar's GSDP (at 1999-2000 prices), we get some alarming results. Agriculture and allied activities' economic progress have been dismal in the recent years. This means that the state’s shrinking agriculture sector, on which about 80 per cent of the state’s population depends for livelihood, continues to stagnate. During 2005-06, the growth experienced by this sector was (-) 10.82 percent, while during 2007-08 it was (-) 8.72%. For the same years, industry in Bihar grew by 28.26% and 17.83% whereas services grew by 3.09% and 14.73%, respectively. The percentage share of Agriculture and Allied activities in the entire GSDP at factor cost (at 1999-2000 constant prices) has declined from 38.8% in 2000-01 to 26.2% in 2008-09. </font></p><p align="justify"><br /><font >The average annual growth rate of GSDP from construction (at 1999-2000 prices) between 2004-05 and 2008-09 was 36.16%. If the period is changed to between 1999-2000 and 2008-09, then the average annual growth rate of GSDP from construction turns out to be 24.44%. The percentage share of construction in the overall GSDP of Bihar has increased from 3.8% in 1999-2000 to 12.6% in 2008-09. </font></p><p align="justify"><font >The percentage share of Banking and Insurance in the entire GSDP of Bihar has more or less remained the same over the years. This sector plays a crucial role in industrial growth. We find that the percentage share of GSDP from registered manufacturing in the total GSDP of Bihar to be falling from 2.3% in 1999-2000 to 0.7% in 2008-09. The average annual growth rate of registered manufacturing GSDP during the period 2004-05 to 2008-09 has been merely 4.06%, which is much lesser than the average annual growth rate of GSDP from Agriculture and allied activities during the same period, i.e. 7.29%. </font></p><p align="justify"><font >The annual average growth of GSDP from unregistered manufacturing during the period 2004-05 to 2008-09 was 8.12%. The percentage share of GSDP from unregistered manufacturing in the total GSDP of Bihar has declined from 4.9% in 1999-2000 to 4.0% in 2008-09.</font> </p><p align="justify"><font >The percentage share of Public Administration in the GSDP of Bihar has been declining overtime. </font></p><p align="justify"><font ><strong>Graph 1: Economic growth faced by Bihar, Gujarat and India in different years</strong></font> </p><p align="justify"><font ><img style="width: 652px; height: 311px" src="https://im4change.in/siteadmin/tinymce/uploaded/Bihar eco gr.bmp" alt="Bihar eco gr" width="978" height="453" /><br /><em><strong>Source: </strong></em></font><a href="http://www.mospi.nic.in/" title="http://www.mospi.nic.in/">www.mospi.nic.in</a><font ><em> </em></font></p><p align="justify"><br /><font ><em>Further readings: </em></font></p><p align="justify"><font >GSDP data of various states of India,<br /></font><a href="http://www.mospi.nic.in/State-wise_SDP_1999-2000_20nov09.pdf" title="http://www.mospi.nic.in/State-wise_SDP_1999-2000_20nov09.pdf">http://www.mospi.nic.in/State-wise_SDP_1999-2000_20nov09.pdf</a><font > </font></p><p align="justify"><font >Economic Survey of Bihar 2008-09, Government of Bihar<br /></font><a href="http://www.indiaenvironmentportal.org.in/files/ESR-2008-09-EN.pdf" title="http://www.indiaenvironmentportal.org.in/files/ESR-2008-09-EN.pdf">http://www.indiaenvironmentportal.org.in/files/ESR-2008-09-EN.pdf</a> </p><p align="justify"><font >National Human Development Report 2001, Planning Commission,<br /></font><a href="https://im4change.in/docs/nhd2001.pdf" title="https://im4change.in/docs/nhd2001.pdf">http://www.im4change.org/docs/nhd2001.pdf</a><br /><font > <br />Bihar’s miracle: growth rate at 11.03 p.c., The Hindu, 3 January, 2010,<br /></font><a href="http://beta.thehindu.com/news/states/other-states/article74958.ece" title="http://beta.thehindu.com/news/states/other-states/article74958.ece">http://beta.thehindu.com/news/states/other-states/article7<br />4958.ece</a><font > </font></p><p align="justify"><font >Road to development, The Business Standard, 6 January, 2010, </font><a href="http://www.business-standard.com/india/news/road-to-development/381731/" title="http://www.business-standard.com/india/news/road-to-development/381731/">http://www.business-standard.com/india/news/road-to-develo<br />pment/381731/</a><font > <br /> <br />Hope for poor states, The Economic Times, 5 January, 2010,<br /></font><a href="http://economictimes.indiatimes.com/opinion/editorial/Hope-for-poor-states/articleshow/5411079.cms" title="http://economictimes.indiatimes.com/opinion/editorial/Hope-for-poor-states/articleshow/5411079.cms">http://economictimes.indiatimes.com/opinion/editorial/Hope<br />-for-poor-states/articleshow/5411079.cms</a><font > <br /> <br />New miracle economies: Bihar, poor states by SA Aiyar, The Times of India, 3 Jauary, 2010, </font><a href="http://blogs.timesofindia.indiatimes.com/Swaminomics/entry/new-miracle-economies-bihar-poor" title="http://blogs.timesofindia.indiatimes.com/Swaminomics/entry/new-miracle-economies-bihar-poor">http://blogs.timesofindia.indiatimes.com/Swaminomics/entry<br />/new-miracle-economies-bihar-poor</a><font > <br /> <br />Bihar grew by 11.03%, next only to Gujarat, The Times of India, 3 January, 2010,</font> </p><p align="justify"><a href="http://timesofindia.indiatimes.com/biz/india-business/Bihar-grew-by-1103-next-only-to-Gujarat/articleshow/5405973.cms" title="http://timesofindia.indiatimes.com/biz/india-business/Bihar-grew-by-1103-next-only-to-Gujarat/articleshow/5405973.cms">http://timesofindia.indiatimes.com/biz/india-business/Biha<br />r-grew-by-1103-next-only-to-Gujarat/articleshow/5405973.cm<br />s</a><font > </font></p><p align="justify"><font >Mind The Shadows by Lola Nayar, Outlook India,<br /></font><a href="http://www.outlookindia.com/article.aspx?263643" title="http://www.outlookindia.com/article.aspx?263643">http://www.outlookindia.com/article.aspx?263643</a><br /><font > <br />Bihar, a growth story by Raj Kumar, The Times of India, 11 January, 2010,</font> </p><p align="justify"><a href="http://timesofindia.indiatimes.com/home/sunday-toi/special-report/Bihar-a-growth-story/articleshow/5428960.cms" title="http://timesofindia.indiatimes.com/home/sunday-toi/special-report/Bihar-a-growth-story/articleshow/5428960.cms">http://timesofindia.indiatimes.com/home/sunday-toi/special<br />-report/Bihar-a-growth-story/articleshow/5428960.cms</a><font > <br /> <br />How Bihar can rise as a developed state by Kailash Nautiyal, Rediff.com,</font> </p><p align="justify"><a href="http://business.rediff.com/slide-show/2010/jan/04/slide-show-1-how-bihar-can-rise-as-a-developed-state.htm#contentTop" title="http://business.rediff.com/slide-show/2010/jan/04/slide-show-1-how-bihar-can-rise-as-a-developed-state.htm#contentTop">http://business.rediff.com/slide-show/2010/jan/04/slide-sh<br />ow-1-how-bihar-can-rise-as-a-developed-state.htm#contentTo<br />p</a><font > <br /> </font> </p>',
'lang' => 'English',
'SITE_URL' => 'https://im4change.in/',
'site_title' => 'im4change',
'adminprix' => 'admin'
]
$article_current = object(App\Model\Entity\Article) {
'id' => (int) 943,
'title' => 'Bihar’s miraculous economic growth: Myth or reality?',
'subheading' => '',
'description' => '<p align="justify">
<br />
<font face="arial,helvetica,sans-serif" size="3">A section of the media seems to be mighty impressed with Bihar’s miraculous (11.03%) average annual growth during the 2004-05 to 2008-09, supposedly akin to that of Gujarat (11.05%) but is there a catch in this stunning statistics? <em>(See the graph below)</em>. </font>
</p>
<p align="justify">
<font face="arial,helvetica,sans-serif" size="3">While the media has quoted the Gross State Domestic Product at factor cost (at constant 1999-2000 prices) as provided by the Central Statistical Organization (CSO), but the corresponding GSDP figures for Gujarat have yet to arrive. And hence, it will be a mistake to compare the average annual growth rate of Bihar from 2004-05 to 2008-09 with the average annual growth rate of Gujarat from 2004-05 to 2007-08. Besides, Bihar figures pertain to a much lower base of previous years. (The CSO does not generate data but merely reissues figures provided by the states.) </font>
</p>
<p align="justify">
<font face="arial,helvetica,sans-serif" size="3"><br />
The National Human Development Report 2001 of the Planning Commission shows that Bihar comes at the bottom of the Human Development Index (HDI) among the 15 states which were studied. Bihar's HDI (0.367) comes below the HDI of Madhya Pradesh (0.394, Rank: 12), Orissa (0.404, Rank: 11) and Rajasthan (0.424, Rank: 9). Bihar is way below the average national HDI (0.472). This, obviously, strengthens the case for looking at the discrepancy between GSDP growth rate and actual development on the ground. For instance we can’t forget that about half the population of Bihar figures below the poverty line and over 56 per cent of Bihar’s children below the age of three years are underweight. </font>
</p>
<p align="justify">
<font face="arial,helvetica,sans-serif" size="3">Even on the statistics front, there are other states too who's GSDP at factor cost (at 1999-2000 prices) data for the year 2008-09 is yet to arrive. Some of them are: Madhya Pradesh, Maharastra, West Bengal etc. From a research point of view, it is not proper to compare Bihar with any other state in the absence of corresponding data. </font>
</p>
<p align="justify">
<font face="arial,helvetica,sans-serif" size="3">Instead of taking the period 2004-05 to 2008-09, if the period 1999-2000 and 2008-09 is considered, then Bihar's average annual growth rate falls down from 11.03% to 8.13%. Similarly, if the period for growth calculation is changed, then Gujarat's average annual growth rate reduces from 11.05% to 8.83% and India's average annual growth rate reduces from 8.49% to 7.09%. </font>
</p>
<p align="justify">
<font face="arial,helvetica,sans-serif" size="3">If we look at the various components of Bihar's GSDP (at 1999-2000 prices), we get some alarming results. Agriculture and allied activities' economic progress have been dismal in the recent years. This means that the state’s shrinking agriculture sector, on which about 80 per cent of the state’s population depends for livelihood, continues to stagnate. During 2005-06, the growth experienced by this sector was (-) 10.82 percent, while during 2007-08 it was (-) 8.72%. For the same years, industry in Bihar grew by 28.26% and 17.83% whereas services grew by 3.09% and 14.73%, respectively. The percentage share of Agriculture and Allied activities in the entire GSDP at factor cost (at 1999-2000 constant prices) has declined from 38.8% in 2000-01 to 26.2% in 2008-09. </font>
</p>
<p align="justify">
<br />
<font face="arial,helvetica,sans-serif" size="3">The average annual growth rate of GSDP from construction (at 1999-2000 prices) between 2004-05 and 2008-09 was 36.16%. If the period is changed to between 1999-2000 and 2008-09, then the average annual growth rate of GSDP from construction turns out to be 24.44%. The percentage share of construction in the overall GSDP of Bihar has increased from 3.8% in 1999-2000 to 12.6% in 2008-09. </font>
</p>
<p align="justify">
<font face="arial,helvetica,sans-serif" size="3">The percentage share of Banking and Insurance in the entire GSDP of Bihar has more or less remained the same over the years. This sector plays a crucial role in industrial growth. We find that the percentage share of GSDP from registered manufacturing in the total GSDP of Bihar to be falling from 2.3% in 1999-2000 to 0.7% in 2008-09. The average annual growth rate of registered manufacturing GSDP during the period 2004-05 to 2008-09 has been merely 4.06%, which is much lesser than the average annual growth rate of GSDP from Agriculture and allied activities during the same period, i.e. 7.29%. </font>
</p>
<p align="justify">
<font face="arial,helvetica,sans-serif" size="3">The annual average growth of GSDP from unregistered manufacturing during the period 2004-05 to 2008-09 was 8.12%. The percentage share of GSDP from unregistered manufacturing in the total GSDP of Bihar has declined from 4.9% in 1999-2000 to 4.0% in 2008-09.</font>
</p>
<p align="justify">
<font face="arial,helvetica,sans-serif" size="3">The percentage share of Public Administration in the GSDP of Bihar has been declining overtime. </font>
</p>
<p align="justify">
<font face="arial,helvetica,sans-serif" size="3"><strong>Graph 1: Economic growth faced by Bihar, Gujarat and India in different years</strong></font>
</p>
<p align="justify">
<font face="arial,helvetica,sans-serif" size="3"><img style="width: 652px; height: 311px" src="tinymce/uploaded/Bihar eco gr.bmp" alt="Bihar eco gr" width="978" height="453" /><br />
<em><strong>Source: </strong></em></font><a href="http://www.mospi.nic.in/"><font face="arial,helvetica,sans-serif" size="3"><em>www.mospi.nic.in</em></font></a><font face="arial,helvetica,sans-serif" size="3"><em> </em></font>
</p>
<p align="justify">
<br />
<font face="arial,helvetica,sans-serif" size="3"><em>Further readings: </em></font>
</p>
<p align="justify">
<font face="arial,helvetica,sans-serif" size="3">GSDP data of various states of India,<br />
</font><a href="http://www.mospi.nic.in/State-wise_SDP_1999-2000_20nov09.pdf"><font face="arial,helvetica,sans-serif" size="3">http://www.mospi.nic.in/State-wise_SDP_1999-2000_20nov09.pdf</font></a><font face="arial,helvetica,sans-serif" size="3"> </font>
</p>
<p align="justify">
<font face="arial,helvetica,sans-serif" size="3">Economic Survey of Bihar 2008-09, Government of Bihar<br />
</font><a href="http://www.indiaenvironmentportal.org.in/files/ESR-2008-09-EN.pdf"><font face="arial,helvetica,sans-serif" size="3">http://www.indiaenvironmentportal.org.in/files/ESR-2008-09-EN.pdf</font></a>
</p>
<p align="justify">
<font face="arial,helvetica,sans-serif" size="3">National Human Development Report 2001, Planning Commission,<br />
</font><a href="../docs/nhd2001.pdf"><font face="arial,helvetica,sans-serif" size="3">http://www.im4change.org/docs/nhd2001.pdf</font></a><br />
<font face="arial,helvetica,sans-serif" size="3"> <br />
Bihar’s miracle: growth rate at 11.03 p.c., The Hindu, 3 January, 2010,<br />
</font><a href="http://beta.thehindu.com/news/states/other-states/article74958.ece"><font face="arial,helvetica,sans-serif" size="3">http://beta.thehindu.com/news/states/other-states/article74958.ece</font></a><font face="arial,helvetica,sans-serif" size="3"> </font>
</p>
<p align="justify">
<font face="arial,helvetica,sans-serif" size="3">Road to development, The Business Standard, 6 January, 2010, </font><a href="http://www.business-standard.com/india/news/road-to-development/381731/"><font face="arial,helvetica,sans-serif" size="3">http://www.business-standard.com/india/news/road-to-development/381731/</font></a><font face="arial,helvetica,sans-serif" size="3"> <br />
<br />
Hope for poor states, The Economic Times, 5 January, 2010,<br />
</font><a href="http://economictimes.indiatimes.com/opinion/editorial/Hope-for-poor-states/articleshow/5411079.cms"><font face="arial,helvetica,sans-serif" size="3">http://economictimes.indiatimes.com/opinion/editorial/Hope-for-poor-states/articleshow/5411079.cms</font></a><font face="arial,helvetica,sans-serif" size="3"> <br />
<br />
New miracle economies: Bihar, poor states by SA Aiyar, The Times of India, 3 Jauary, 2010, </font><a href="http://blogs.timesofindia.indiatimes.com/Swaminomics/entry/new-miracle-economies-bihar-poor"><font face="arial,helvetica,sans-serif" size="3">http://blogs.timesofindia.indiatimes.com/Swaminomics/entry/new-miracle-economies-bihar-poor</font></a><font face="arial,helvetica,sans-serif" size="3"> <br />
<br />
Bihar grew by 11.03%, next only to Gujarat, The Times of India, 3 January, 2010,</font>
</p>
<p align="justify">
<a href="http://timesofindia.indiatimes.com/biz/india-business/Bihar-grew-by-1103-next-only-to-Gujarat/articleshow/5405973.cms"><font face="arial,helvetica,sans-serif" size="3">http://timesofindia.indiatimes.com/biz/india-business/Bihar-grew-by-1103-next-only-to-Gujarat/articleshow/5405973.cms</font></a><font face="arial,helvetica,sans-serif" size="3"> </font>
</p>
<p align="justify">
<font face="arial,helvetica,sans-serif" size="3">Mind The Shadows by Lola Nayar, Outlook India,<br />
</font><a href="http://www.outlookindia.com/article.aspx?263643"><font face="arial,helvetica,sans-serif" size="3">http://www.outlookindia.com/article.aspx?263643</font></a><br />
<font face="arial,helvetica,sans-serif" size="3"> <br />
Bihar, a growth story by Raj Kumar, The Times of India, 11 January, 2010,</font>
</p>
<p align="justify">
<a href="http://timesofindia.indiatimes.com/home/sunday-toi/special-report/Bihar-a-growth-story/articleshow/5428960.cms"><font face="arial,helvetica,sans-serif" size="3">http://timesofindia.indiatimes.com/home/sunday-toi/special-report/Bihar-a-growth-story/articleshow/5428960.cms</font></a><font face="arial,helvetica,sans-serif" size="3"> <br />
<br />
How Bihar can rise as a developed state by Kailash Nautiyal, Rediff.com,</font>
</p>
<p align="justify">
<a href="http://business.rediff.com/slide-show/2010/jan/04/slide-show-1-how-bihar-can-rise-as-a-developed-state.htm#contentTop"><font face="arial,helvetica,sans-serif" size="3">http://business.rediff.com/slide-show/2010/jan/04/slide-show-1-how-bihar-can-rise-as-a-developed-state.htm#contentTop</font></a><font face="arial,helvetica,sans-serif" size="3"> <br />
</font>
</p>
',
'credit_writer' => '',
'article_img' => '',
'article_img_thumb' => '',
'status' => (int) 1,
'show_on_home' => (int) 1,
'lang' => 'EN',
'category_id' => (int) 15,
'tag_keyword' => '',
'seo_url' => 'bihars-miraculous-economic-growth-myth-or-reality-1017',
'meta_title' => null,
'meta_keywords' => null,
'meta_description' => null,
'noindex' => (int) 0,
'publish_date' => object(Cake\I18n\FrozenDate) {},
'most_visit_section_id' => null,
'article_big_img' => null,
'liveid' => (int) 1017,
'created' => object(Cake\I18n\FrozenTime) {},
'modified' => object(Cake\I18n\FrozenTime) {},
'edate' => '',
'tags' => [],
'category' => object(App\Model\Entity\Category) {},
'[new]' => false,
'[accessible]' => [
'*' => true,
'id' => false
],
'[dirty]' => [],
'[original]' => [],
'[virtual]' => [],
'[hasErrors]' => false,
'[errors]' => [],
'[invalid]' => [],
'[repository]' => 'Articles'
}
$articleid = (int) 943
$metaTitle = 'News Alerts | Bihar’s miraculous economic growth: Myth or reality?'
$metaKeywords = null
$metaDesc = '
A section of the media seems to be mighty impressed with Bihar’s miraculous (11.03%) average annual growth during the 2004-05 to 2008-09, supposedly akin to that of Gujarat (11.05%) but is there a catch in this stunning statistics? (See the...'
$disp = '<p align="justify"><br /><font >A section of the media seems to be mighty impressed with Bihar’s miraculous (11.03%) average annual growth during the 2004-05 to 2008-09, supposedly akin to that of Gujarat (11.05%) but is there a catch in this stunning statistics? <em>(See the graph below)</em>. </font></p><p align="justify"><font >While the media has quoted the Gross State Domestic Product at factor cost (at constant 1999-2000 prices) as provided by the Central Statistical Organization (CSO), but the corresponding GSDP figures for Gujarat have yet to arrive. And hence, it will be a mistake to compare the average annual growth rate of Bihar from 2004-05 to 2008-09 with the average annual growth rate of Gujarat from 2004-05 to 2007-08. Besides, Bihar figures pertain to a much lower base of previous years. (The CSO does not generate data but merely reissues figures provided by the states.) </font></p><p align="justify"><font ><br />The National Human Development Report 2001 of the Planning Commission shows that Bihar comes at the bottom of the Human Development Index (HDI) among the 15 states which were studied. Bihar's HDI (0.367) comes below the HDI of Madhya Pradesh (0.394, Rank: 12), Orissa (0.404, Rank: 11) and Rajasthan (0.424, Rank: 9). Bihar is way below the average national HDI (0.472). This, obviously, strengthens the case for looking at the discrepancy between GSDP growth rate and actual development on the ground. For instance we can’t forget that about half the population of Bihar figures below the poverty line and over 56 per cent of Bihar’s children below the age of three years are underweight. </font></p><p align="justify"><font >Even on the statistics front, there are other states too who's GSDP at factor cost (at 1999-2000 prices) data for the year 2008-09 is yet to arrive. Some of them are: Madhya Pradesh, Maharastra, West Bengal etc. From a research point of view, it is not proper to compare Bihar with any other state in the absence of corresponding data. </font></p><p align="justify"><font >Instead of taking the period 2004-05 to 2008-09, if the period 1999-2000 and 2008-09 is considered, then Bihar's average annual growth rate falls down from 11.03% to 8.13%. Similarly, if the period for growth calculation is changed, then Gujarat's average annual growth rate reduces from 11.05% to 8.83% and India's average annual growth rate reduces from 8.49% to 7.09%. </font></p><p align="justify"><font >If we look at the various components of Bihar's GSDP (at 1999-2000 prices), we get some alarming results. Agriculture and allied activities' economic progress have been dismal in the recent years. This means that the state’s shrinking agriculture sector, on which about 80 per cent of the state’s population depends for livelihood, continues to stagnate. During 2005-06, the growth experienced by this sector was (-) 10.82 percent, while during 2007-08 it was (-) 8.72%. For the same years, industry in Bihar grew by 28.26% and 17.83% whereas services grew by 3.09% and 14.73%, respectively. The percentage share of Agriculture and Allied activities in the entire GSDP at factor cost (at 1999-2000 constant prices) has declined from 38.8% in 2000-01 to 26.2% in 2008-09. </font></p><p align="justify"><br /><font >The average annual growth rate of GSDP from construction (at 1999-2000 prices) between 2004-05 and 2008-09 was 36.16%. If the period is changed to between 1999-2000 and 2008-09, then the average annual growth rate of GSDP from construction turns out to be 24.44%. The percentage share of construction in the overall GSDP of Bihar has increased from 3.8% in 1999-2000 to 12.6% in 2008-09. </font></p><p align="justify"><font >The percentage share of Banking and Insurance in the entire GSDP of Bihar has more or less remained the same over the years. This sector plays a crucial role in industrial growth. We find that the percentage share of GSDP from registered manufacturing in the total GSDP of Bihar to be falling from 2.3% in 1999-2000 to 0.7% in 2008-09. The average annual growth rate of registered manufacturing GSDP during the period 2004-05 to 2008-09 has been merely 4.06%, which is much lesser than the average annual growth rate of GSDP from Agriculture and allied activities during the same period, i.e. 7.29%. </font></p><p align="justify"><font >The annual average growth of GSDP from unregistered manufacturing during the period 2004-05 to 2008-09 was 8.12%. The percentage share of GSDP from unregistered manufacturing in the total GSDP of Bihar has declined from 4.9% in 1999-2000 to 4.0% in 2008-09.</font> </p><p align="justify"><font >The percentage share of Public Administration in the GSDP of Bihar has been declining overtime. </font></p><p align="justify"><font ><strong>Graph 1: Economic growth faced by Bihar, Gujarat and India in different years</strong></font> </p><p align="justify"><font ><img style="width: 652px; height: 311px" src="https://im4change.in/siteadmin/tinymce/uploaded/Bihar eco gr.bmp" alt="Bihar eco gr" width="978" height="453" /><br /><em><strong>Source: </strong></em></font><a href="http://www.mospi.nic.in/" title="http://www.mospi.nic.in/">www.mospi.nic.in</a><font ><em> </em></font></p><p align="justify"><br /><font ><em>Further readings: </em></font></p><p align="justify"><font >GSDP data of various states of India,<br /></font><a href="http://www.mospi.nic.in/State-wise_SDP_1999-2000_20nov09.pdf" title="http://www.mospi.nic.in/State-wise_SDP_1999-2000_20nov09.pdf">http://www.mospi.nic.in/State-wise_SDP_1999-2000_20nov09.pdf</a><font > </font></p><p align="justify"><font >Economic Survey of Bihar 2008-09, Government of Bihar<br /></font><a href="http://www.indiaenvironmentportal.org.in/files/ESR-2008-09-EN.pdf" title="http://www.indiaenvironmentportal.org.in/files/ESR-2008-09-EN.pdf">http://www.indiaenvironmentportal.org.in/files/ESR-2008-09-EN.pdf</a> </p><p align="justify"><font >National Human Development Report 2001, Planning Commission,<br /></font><a href="https://im4change.in/docs/nhd2001.pdf" title="https://im4change.in/docs/nhd2001.pdf">http://www.im4change.org/docs/nhd2001.pdf</a><br /><font > <br />Bihar’s miracle: growth rate at 11.03 p.c., The Hindu, 3 January, 2010,<br /></font><a href="http://beta.thehindu.com/news/states/other-states/article74958.ece" title="http://beta.thehindu.com/news/states/other-states/article74958.ece">http://beta.thehindu.com/news/states/other-states/article7<br />4958.ece</a><font > </font></p><p align="justify"><font >Road to development, The Business Standard, 6 January, 2010, </font><a href="http://www.business-standard.com/india/news/road-to-development/381731/" title="http://www.business-standard.com/india/news/road-to-development/381731/">http://www.business-standard.com/india/news/road-to-develo<br />pment/381731/</a><font > <br /> <br />Hope for poor states, The Economic Times, 5 January, 2010,<br /></font><a href="http://economictimes.indiatimes.com/opinion/editorial/Hope-for-poor-states/articleshow/5411079.cms" title="http://economictimes.indiatimes.com/opinion/editorial/Hope-for-poor-states/articleshow/5411079.cms">http://economictimes.indiatimes.com/opinion/editorial/Hope<br />-for-poor-states/articleshow/5411079.cms</a><font > <br /> <br />New miracle economies: Bihar, poor states by SA Aiyar, The Times of India, 3 Jauary, 2010, </font><a href="http://blogs.timesofindia.indiatimes.com/Swaminomics/entry/new-miracle-economies-bihar-poor" title="http://blogs.timesofindia.indiatimes.com/Swaminomics/entry/new-miracle-economies-bihar-poor">http://blogs.timesofindia.indiatimes.com/Swaminomics/entry<br />/new-miracle-economies-bihar-poor</a><font > <br /> <br />Bihar grew by 11.03%, next only to Gujarat, The Times of India, 3 January, 2010,</font> </p><p align="justify"><a href="http://timesofindia.indiatimes.com/biz/india-business/Bihar-grew-by-1103-next-only-to-Gujarat/articleshow/5405973.cms" title="http://timesofindia.indiatimes.com/biz/india-business/Bihar-grew-by-1103-next-only-to-Gujarat/articleshow/5405973.cms">http://timesofindia.indiatimes.com/biz/india-business/Biha<br />r-grew-by-1103-next-only-to-Gujarat/articleshow/5405973.cm<br />s</a><font > </font></p><p align="justify"><font >Mind The Shadows by Lola Nayar, Outlook India,<br /></font><a href="http://www.outlookindia.com/article.aspx?263643" title="http://www.outlookindia.com/article.aspx?263643">http://www.outlookindia.com/article.aspx?263643</a><br /><font > <br />Bihar, a growth story by Raj Kumar, The Times of India, 11 January, 2010,</font> </p><p align="justify"><a href="http://timesofindia.indiatimes.com/home/sunday-toi/special-report/Bihar-a-growth-story/articleshow/5428960.cms" title="http://timesofindia.indiatimes.com/home/sunday-toi/special-report/Bihar-a-growth-story/articleshow/5428960.cms">http://timesofindia.indiatimes.com/home/sunday-toi/special<br />-report/Bihar-a-growth-story/articleshow/5428960.cms</a><font > <br /> <br />How Bihar can rise as a developed state by Kailash Nautiyal, Rediff.com,</font> </p><p align="justify"><a href="http://business.rediff.com/slide-show/2010/jan/04/slide-show-1-how-bihar-can-rise-as-a-developed-state.htm#contentTop" title="http://business.rediff.com/slide-show/2010/jan/04/slide-show-1-how-bihar-can-rise-as-a-developed-state.htm#contentTop">http://business.rediff.com/slide-show/2010/jan/04/slide-sh<br />ow-1-how-bihar-can-rise-as-a-developed-state.htm#contentTo<br />p</a><font > <br /> </font> </p>'
$lang = 'English'
$SITE_URL = 'https://im4change.in/'
$site_title = 'im4change'
$adminprix = 'admin'
include - APP/Template/Layout/printlayout.ctp, line 8
Cake\View\View::_evaluate() - CORE/src/View/View.php, line 1413
Cake\View\View::_render() - CORE/src/View/View.php, line 1374
Cake\View\View::renderLayout() - CORE/src/View/View.php, line 927
Cake\View\View::render() - CORE/src/View/View.php, line 885
Cake\Controller\Controller::render() - CORE/src/Controller/Controller.php, line 791
Cake\Http\ActionDispatcher::_invoke() - CORE/src/Http/ActionDispatcher.php, line 126
Cake\Http\ActionDispatcher::dispatch() - CORE/src/Http/ActionDispatcher.php, line 94
Cake\Http\BaseApplication::__invoke() - CORE/src/Http/BaseApplication.php, line 235
Cake\Http\Runner::__invoke() - CORE/src/Http/Runner.php, line 65
Cake\Routing\Middleware\RoutingMiddleware::__invoke() - CORE/src/Routing/Middleware/RoutingMiddleware.php, line 162
Cake\Http\Runner::__invoke() - CORE/src/Http/Runner.php, line 65
Cake\Routing\Middleware\AssetMiddleware::__invoke() - CORE/src/Routing/Middleware/AssetMiddleware.php, line 88
Cake\Http\Runner::__invoke() - CORE/src/Http/Runner.php, line 65
Cake\Error\Middleware\ErrorHandlerMiddleware::__invoke() - CORE/src/Error/Middleware/ErrorHandlerMiddleware.php, line 96
Cake\Http\Runner::__invoke() - CORE/src/Http/Runner.php, line 65
Cake\Http\Runner::run() - CORE/src/Http/Runner.php, line 51
Bihar’s miraculous economic growth: Myth or reality?
A section of the media seems to be mighty impressed with Bihar’s miraculous (11.03%) average annual growth during the 2004-05 to 2008-09, supposedly akin to that of Gujarat (11.05%) but is there a catch in this stunning statistics? (See the graph below).
While the media has quoted the Gross State Domestic Product at factor cost (at constant 1999-2000 prices) as provided by the Central Statistical Organization (CSO), but the corresponding GSDP figures for Gujarat have yet to arrive. And hence, it will be a mistake to compare the average annual growth rate of Bihar from 2004-05 to 2008-09 with the average annual growth rate of Gujarat from 2004-05 to 2007-08. Besides, Bihar figures pertain to a much lower base of previous years. (The CSO does not generate data but merely reissues figures provided by the states.)
The National Human Development Report 2001 of the Planning Commission shows that Bihar comes at the bottom of the Human Development Index (HDI) among the 15 states which were studied. Bihar's HDI (0.367) comes below the HDI of Madhya Pradesh (0.394, Rank: 12), Orissa (0.404, Rank: 11) and Rajasthan (0.424, Rank: 9). Bihar is way below the average national HDI (0.472). This, obviously, strengthens the case for looking at the discrepancy between GSDP growth rate and actual development on the ground. For instance we can’t forget that about half the population of Bihar figures below the poverty line and over 56 per cent of Bihar’s children below the age of three years are underweight.
Even on the statistics front, there are other states too who's GSDP at factor cost (at 1999-2000 prices) data for the year 2008-09 is yet to arrive. Some of them are: Madhya Pradesh, Maharastra, West Bengal etc. From a research point of view, it is not proper to compare Bihar with any other state in the absence of corresponding data.
Instead of taking the period 2004-05 to 2008-09, if the period 1999-2000 and 2008-09 is considered, then Bihar's average annual growth rate falls down from 11.03% to 8.13%. Similarly, if the period for growth calculation is changed, then Gujarat's average annual growth rate reduces from 11.05% to 8.83% and India's average annual growth rate reduces from 8.49% to 7.09%.
If we look at the various components of Bihar's GSDP (at 1999-2000 prices), we get some alarming results. Agriculture and allied activities' economic progress have been dismal in the recent years. This means that the state’s shrinking agriculture sector, on which about 80 per cent of the state’s population depends for livelihood, continues to stagnate. During 2005-06, the growth experienced by this sector was (-) 10.82 percent, while during 2007-08 it was (-) 8.72%. For the same years, industry in Bihar grew by 28.26% and 17.83% whereas services grew by 3.09% and 14.73%, respectively. The percentage share of Agriculture and Allied activities in the entire GSDP at factor cost (at 1999-2000 constant prices) has declined from 38.8% in 2000-01 to 26.2% in 2008-09.
The average annual growth rate of GSDP from construction (at 1999-2000 prices) between 2004-05 and 2008-09 was 36.16%. If the period is changed to between 1999-2000 and 2008-09, then the average annual growth rate of GSDP from construction turns out to be 24.44%. The percentage share of construction in the overall GSDP of Bihar has increased from 3.8% in 1999-2000 to 12.6% in 2008-09.
The percentage share of Banking and Insurance in the entire GSDP of Bihar has more or less remained the same over the years. This sector plays a crucial role in industrial growth. We find that the percentage share of GSDP from registered manufacturing in the total GSDP of Bihar to be falling from 2.3% in 1999-2000 to 0.7% in 2008-09. The average annual growth rate of registered manufacturing GSDP during the period 2004-05 to 2008-09 has been merely 4.06%, which is much lesser than the average annual growth rate of GSDP from Agriculture and allied activities during the same period, i.e. 7.29%.
The annual average growth of GSDP from unregistered manufacturing during the period 2004-05 to 2008-09 was 8.12%. The percentage share of GSDP from unregistered manufacturing in the total GSDP of Bihar has declined from 4.9% in 1999-2000 to 4.0% in 2008-09.
The percentage share of Public Administration in the GSDP of Bihar has been declining overtime.
Graph 1: Economic growth faced by Bihar, Gujarat and India in different years